📊 Metrics
.webp)
Anteon tracks and displays live data on your CPU, memory, disk, and network usage of your cluster instances. All the dashboards are generated out of the box, and you can create alerts based on these metrics' values. Check out alerts for more.
You can filter based on Time and Kubernetes Instance.
Monitoring Your Cluster Metrics
Analyzing cluster metrics is one of the keystones of cluster observability. And it can’t get easier than it is on Anteon. You can view metrics about your CPU, RAM, Memory, Network usage, etc. You can also apply time filters and examine specific nodes. Here’s how you can do that:
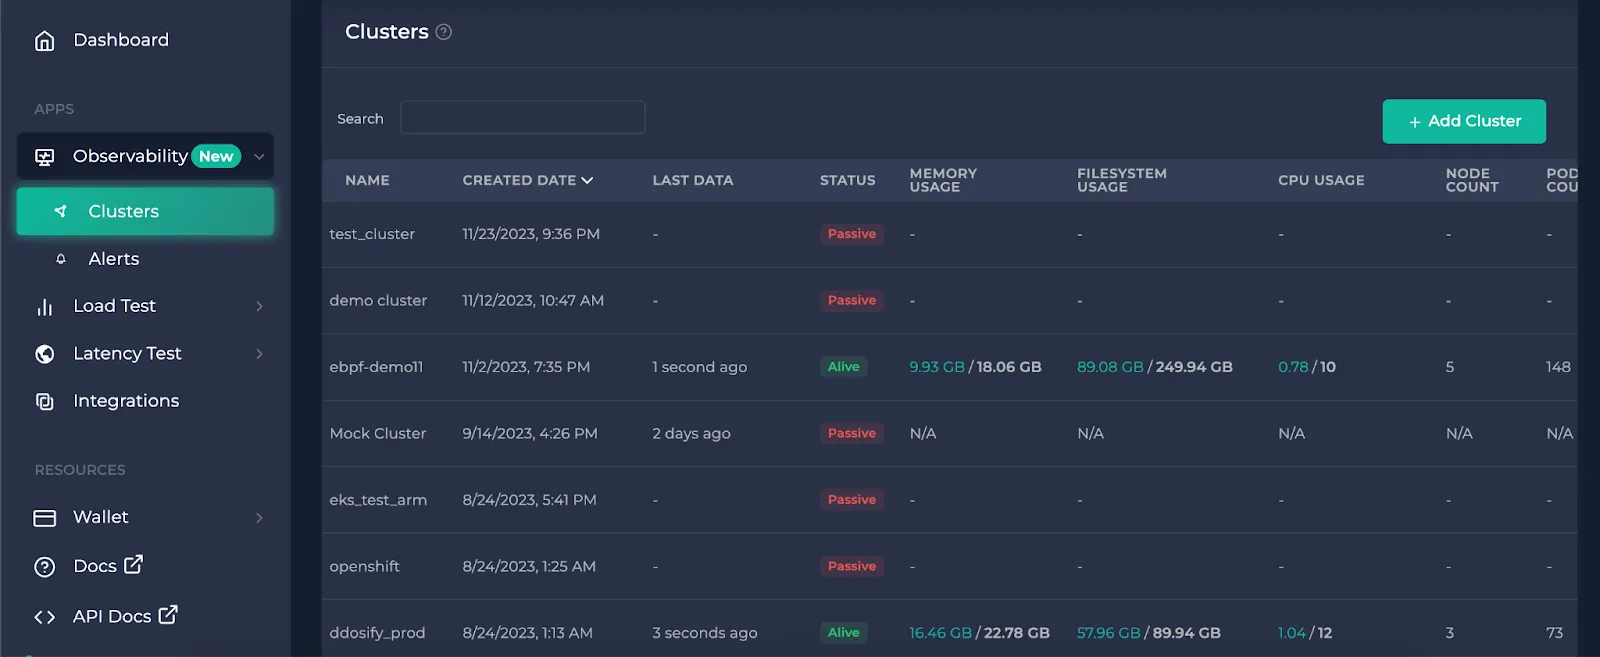
After you click on the cluster you want to observe on the clusters page, the first page that opens is the metrics.
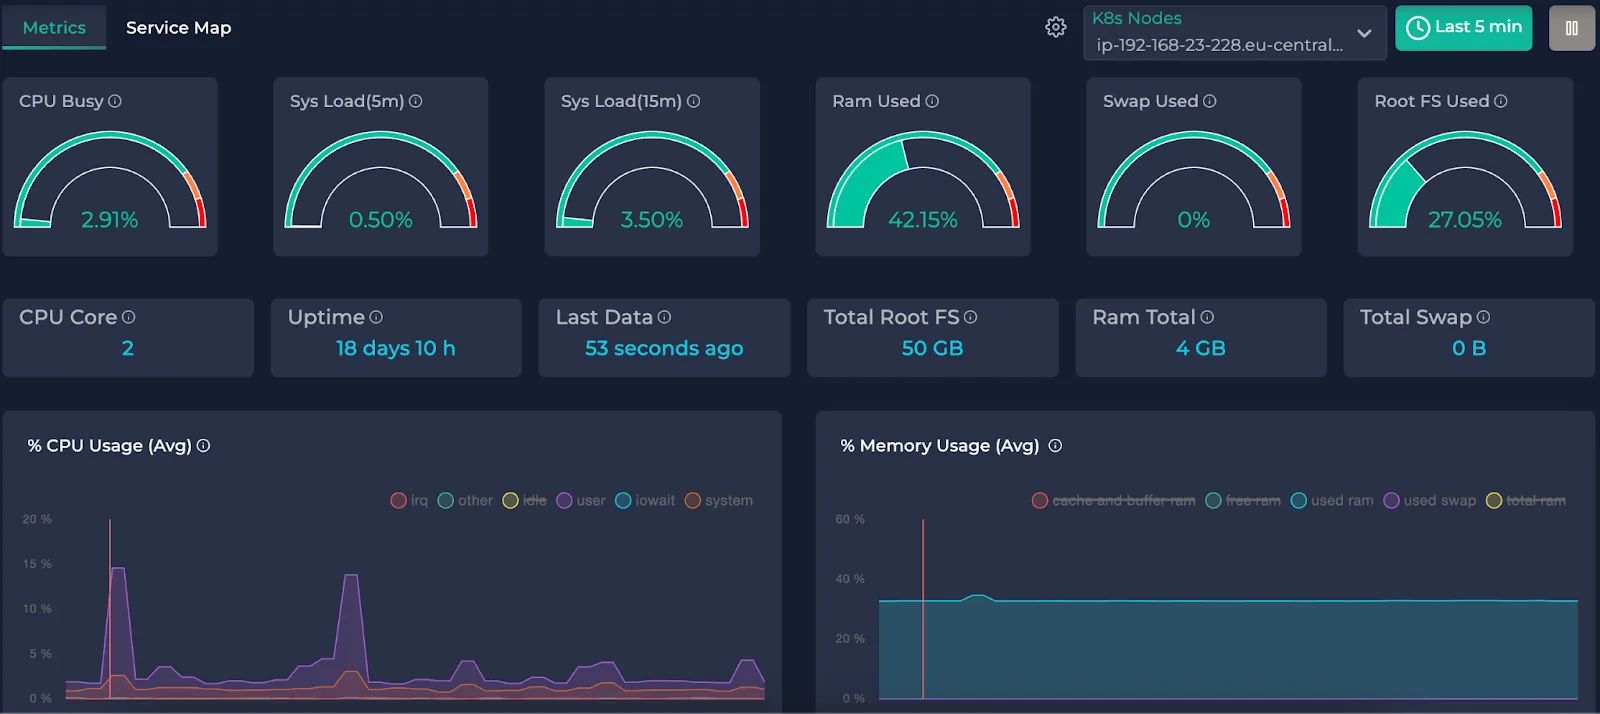
This is an example cluster metrics page. If you haven’t completed the installation of Alaz, you will see this instead:

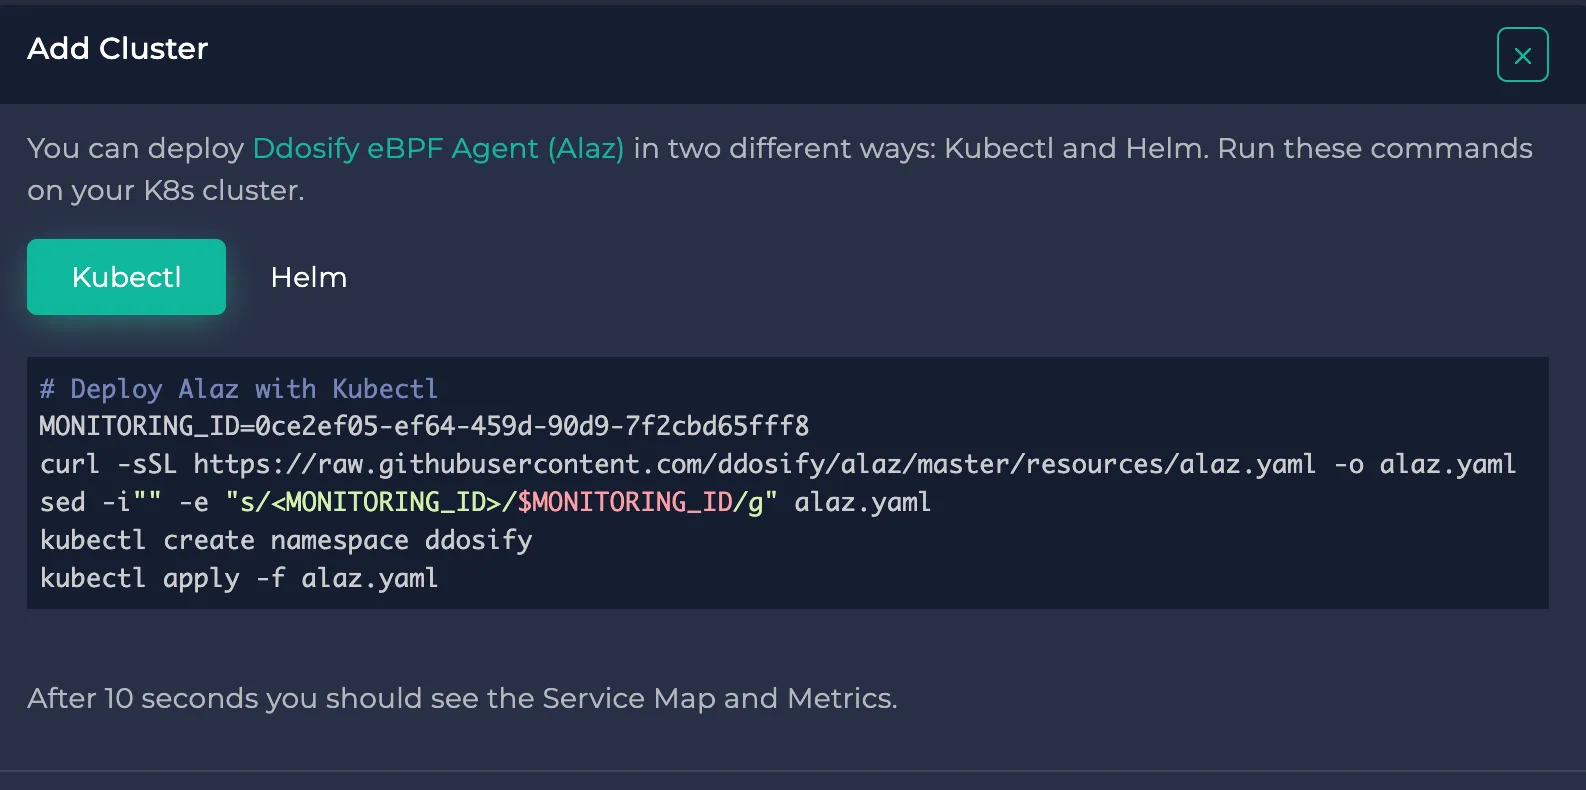
To complete your cluster installation, check the cogwheel button next to the node selector dropdown or click "Set Up Cluster" in the center. It shows you the instructions to connect your cluster to Anteon through Alaz. If you need help on this, you can check the docs.
Filtering
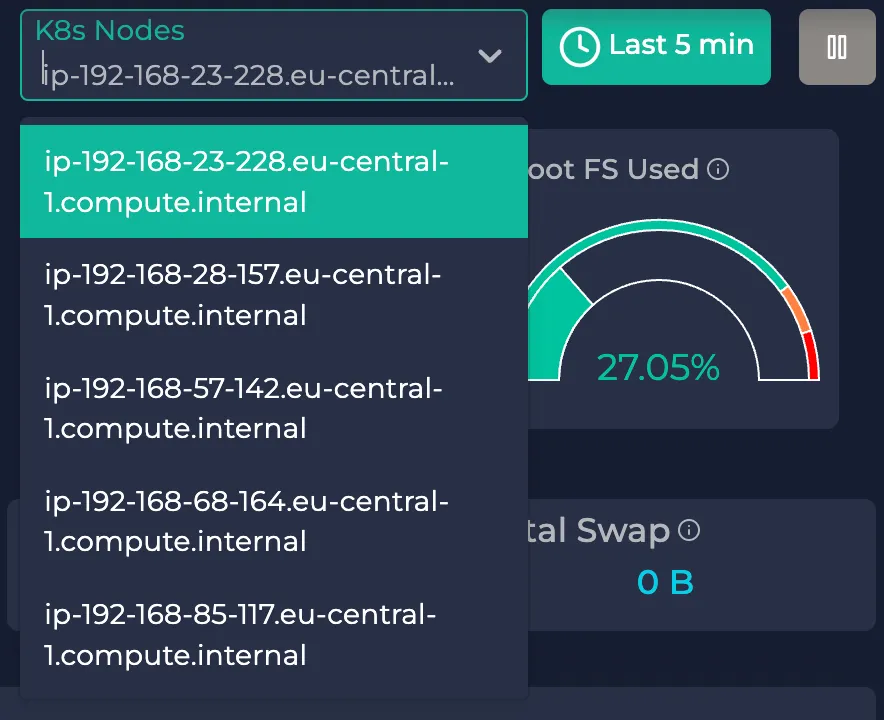
Node selection
Here, you can pick one of your cluster nodes to see how well they operate. To do so, use the node selector in the upper right corner:
Time selection
You can also use the time selector right next to it. You can either specify one of the predetermined time intervals on the right or you can specify your custom time interval:
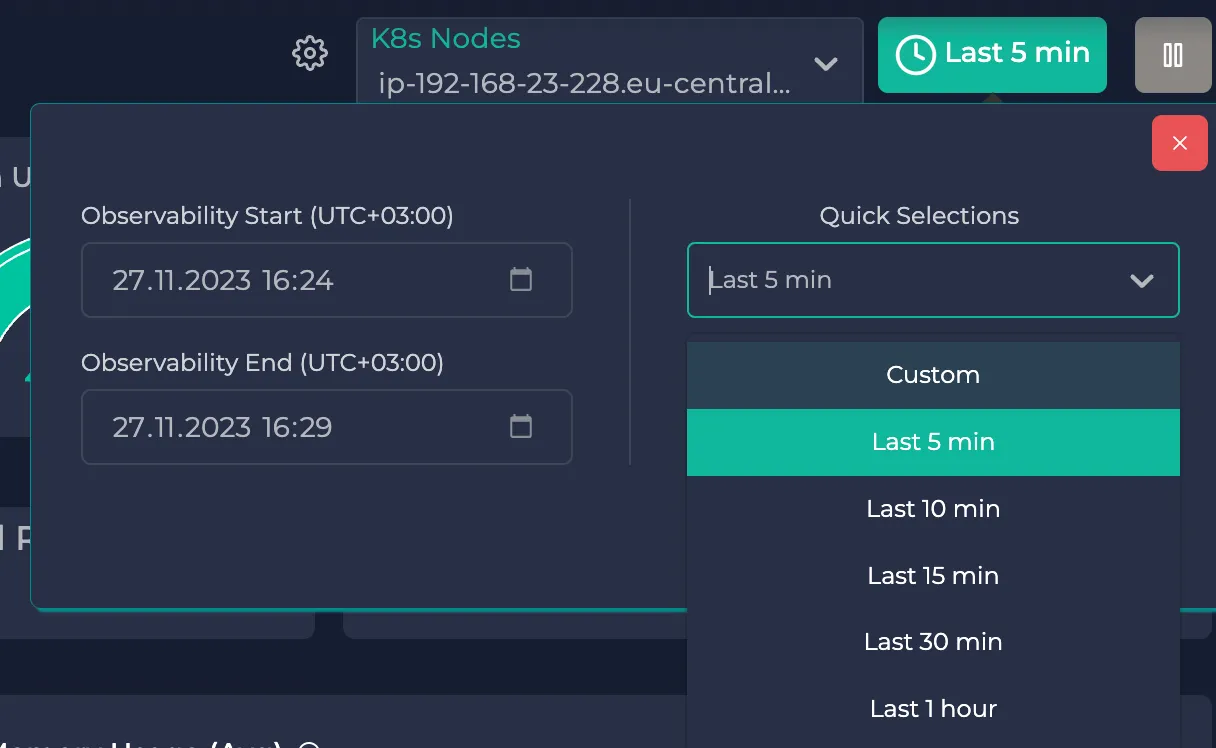
Note: The nodes on the dropdown menu depend on the selected time interval. It will not be shown if a node does not have corresponding data during the selected time interval.
Note: The metrics page is reloaded at about every 5 seconds. If you wish to observe an instant, you can pause the page from the play/pause button in the upper right corner. After you are done, you can enable the reloading by clicking on it again.
Now that you selected your node and desired interval let’s understand what each gauge and time graph presents:
Gauges

| Metric | Definition | Meaning | Numerics |
|---|---|---|---|
| CPU Busy | The amount of time the CPU spends executing non-idle tasks. | High CPU busy percentages over extended periods might indicate that the system is under heavy load, potentially leading to slower response times or performance issues. | It is given as a percentage of the time spent non-idle over the total time spent and can’t exceed 100%. |
| Sys Load (5m) | The average load on the CPU for the past 5 minutes. Sys load represents the number of processes currently running. | If the load consistently stays high compared to the system's capacity (number of CPU cores, for instance), it could signify that the system is under heavy demand or possibly overloaded. | It is given as a percentage of the average process count over the last 5 minutes and it can exceed 100% depending on the CPU core count. |
| Sys Load (15m) | The average load on the CPU for the past 15 minutes. Sys load represents the number of processes currently running. | If the load consistently stays high compared to the system's capacity (number of CPU cores, for instance), it could signify that the system is under heavy demand or possibly overloaded. | It is given as a percentage of the average process count over the last 15 minutes and it can exceed 100% depending on the CPU core count. |
| RAM Used | The amount of Random Access Memory (RAM) currently being utilized by active processes and the operating system. | Consistent high usage may lead to performance issues and it may result from memory leaks or inefficient resource usages. | It is given as a percentage of the used amount over the total amount and can’t exceed 100%. |
| Swap Used | Swap is a space on a disk that is used when the amount of RAM (physical memory) is full. | Swap usage indicates the amount of swap space currently being used by the system. High swap usage may indicate that the system is running out of physical memory and is relying more heavily on disk storage. | It is given as a percentage of the used swap space over the total swap space and can’t exceed 100%. |
| Root FS Used | The Root File System (Root FS) contains essential files required for the system to boot and operate. Root FS usage refers to the amount of space on the root filesystem that is currently in use. | High usage could potentially lead to system performance issues or, in extreme cases, cause the system to run out of space. | Given as a percentage of the used disk space over the total disk space. It can’t exceed 100%. |

- CPU Core: Total CPU core count
- Uptime: The duration for which the node has been continuously running without a restart or shutdown
- Last Data: The timestamp of the last recorded data
- Total Root FS: The total disk space of the root filesystem
- RAM Total: The total RAM bytes of the node
- Total Swap: The total Swap bytes of the node
Time Graphs
Avg CPU Usage %
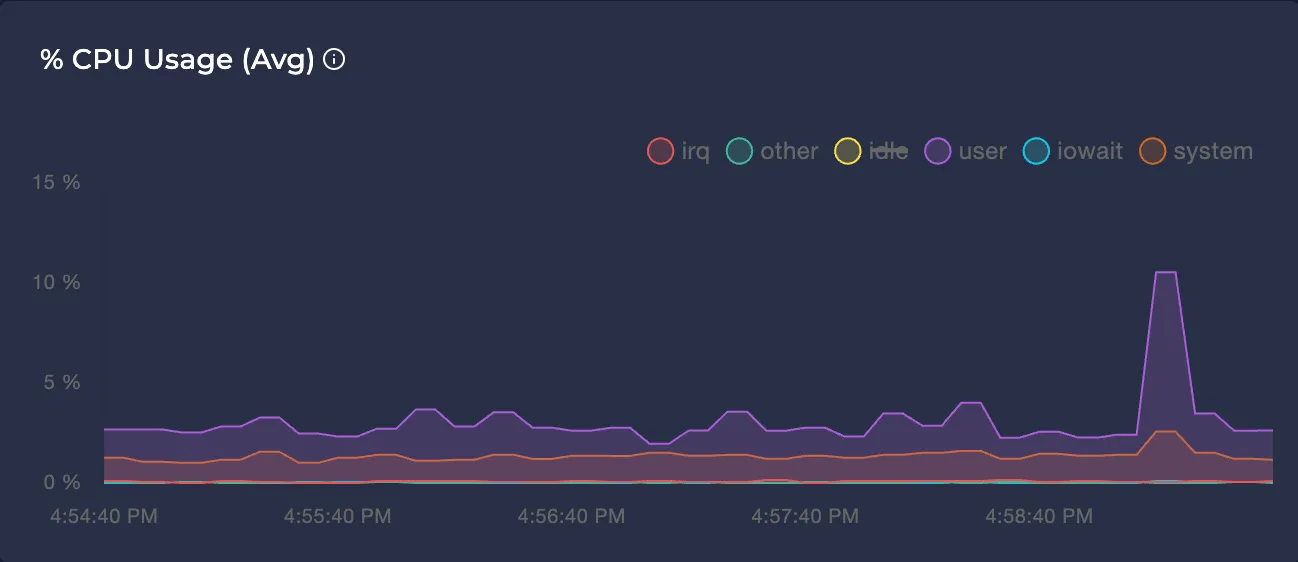
Represents the average CPU usage percentage of the node in different modes over the selected time interval.
Avg Disk Usage %
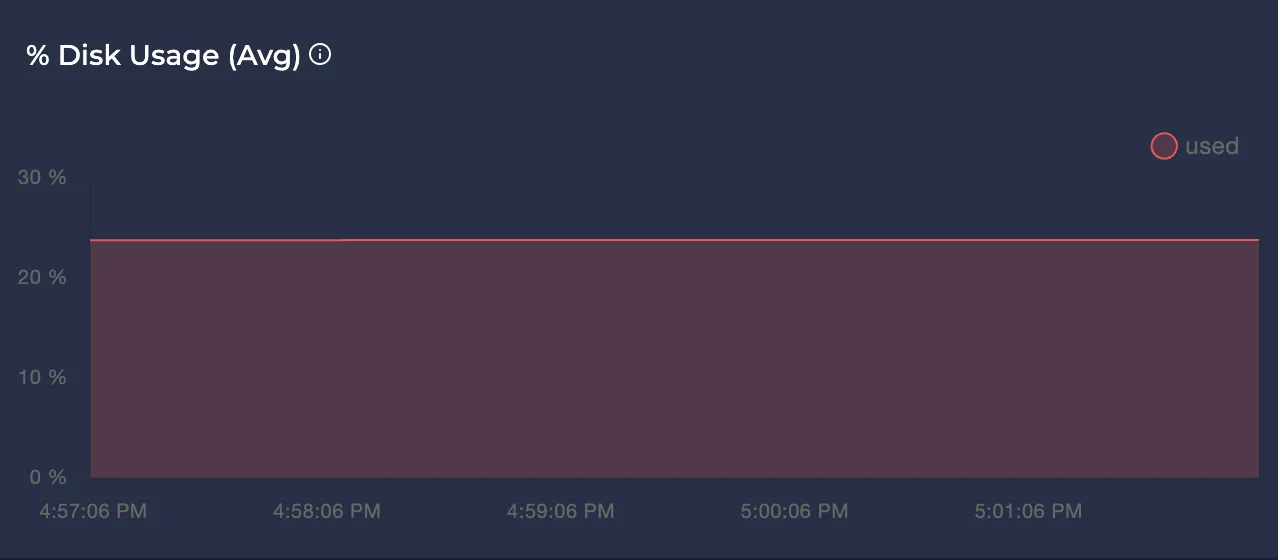
Represents the average disk usage percentage of the node over the selected time interval.
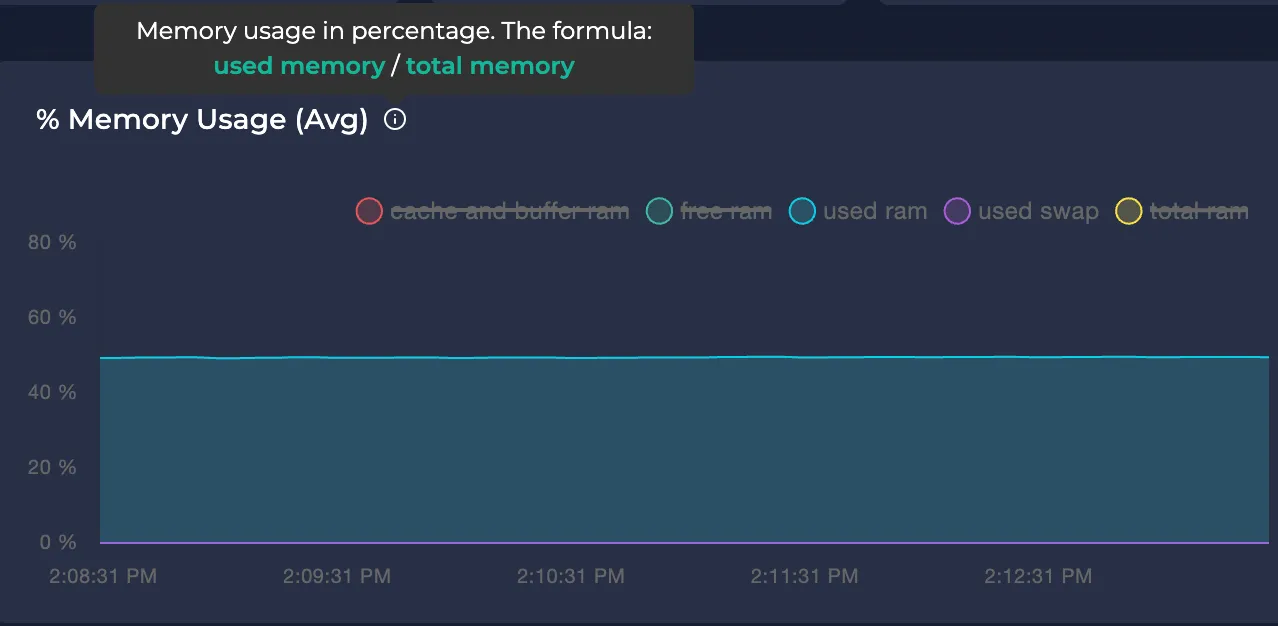
Avg Memory Usage
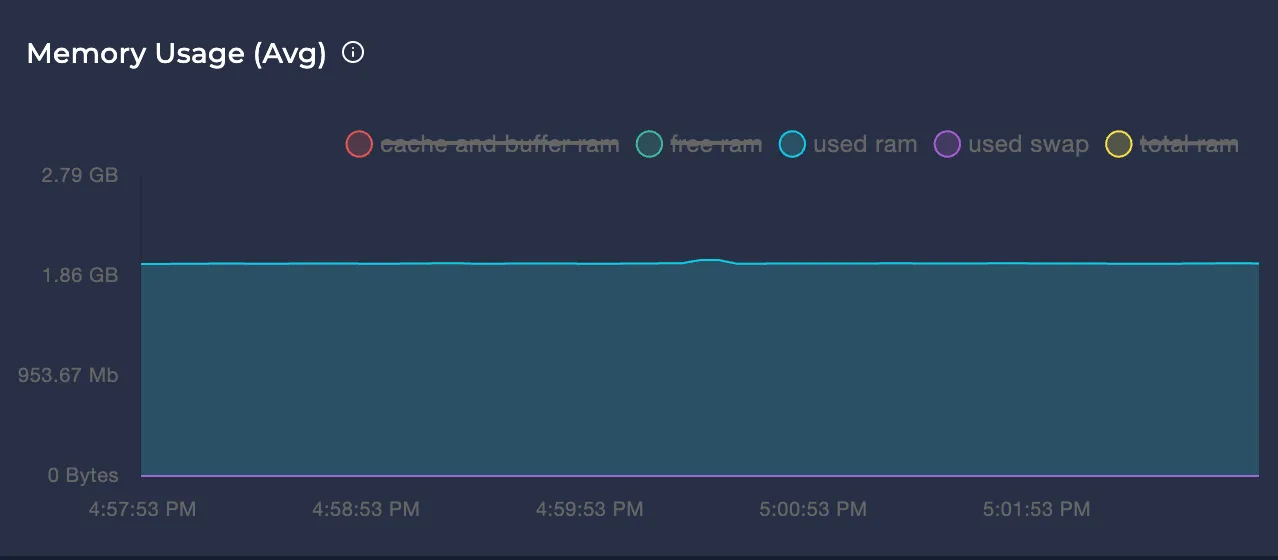
Represents the node's memory usage over the selected time interval in bytes.
Avg Network Usage
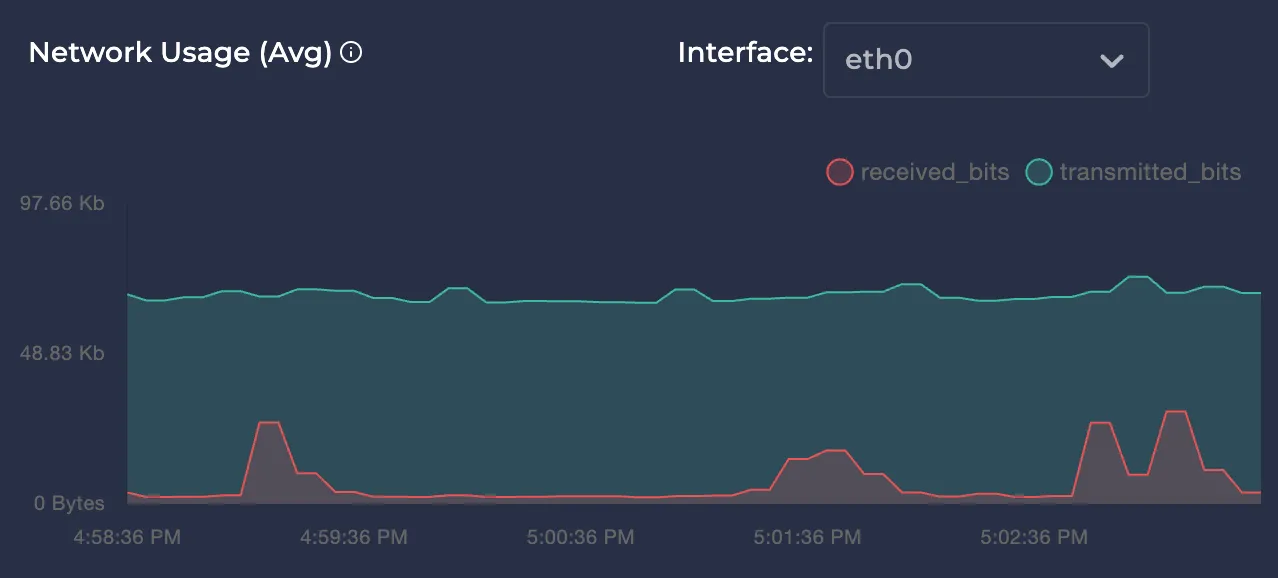
Represents the average network usage of the node over the selected time interval in bytes. You can select your node's network interfaces in the upper right for better monitoring.

Note: You can click on the colors of each time graph’s legend to enable or disable them. This way, you can focus only on the modes you care about.
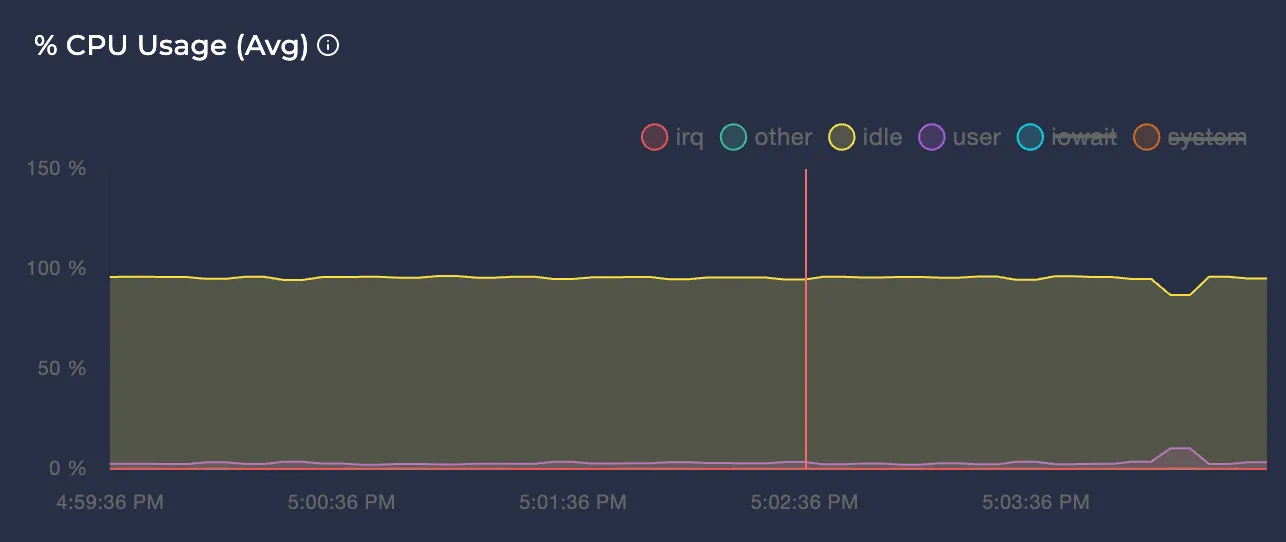
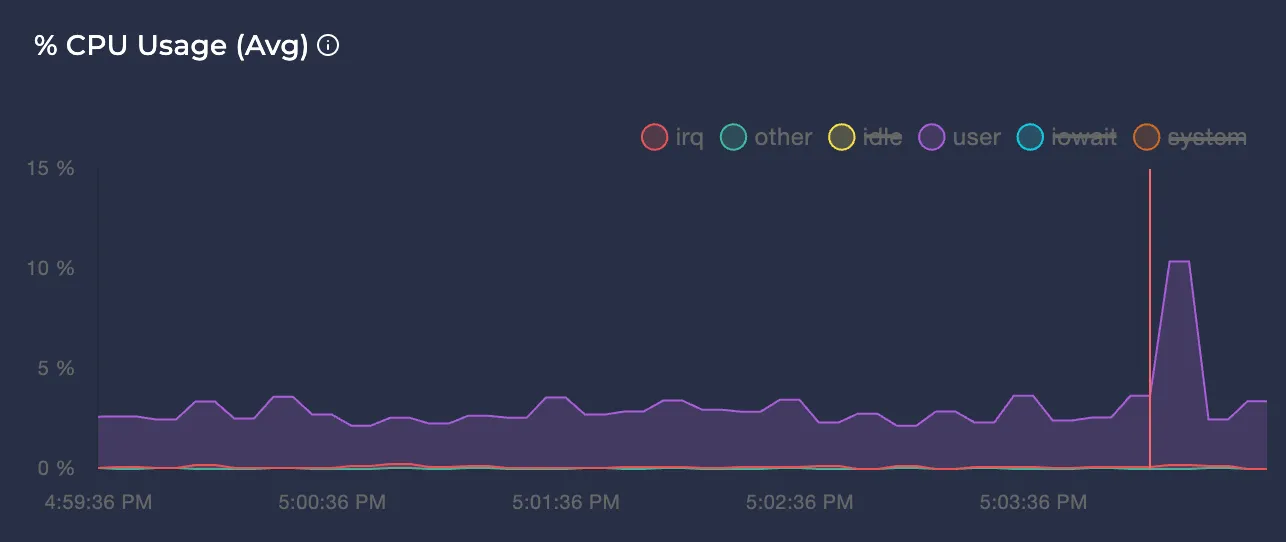
Note: To learn more about each metric, you can hover on the tooltip icon next to them:
If you require assistance with monitoring your cluster metrics, you can join our Discord or send an email to [email protected].