🔔 Alerts
Anteon monitors your Kubernetes cluster with different rules and sends alerts when necessary. For example, it can send an alert when a node's CPU usage is too high or low Disk space via Email, Slack, Opsgenie or Webhook.
Anteon monitors CPU, memory, disk space, and network usage, sending alerts when exceeding thresholds.
Alerts feature is available on Anteon Cloud and Anteon Self-hosted Enterprise.
Key Features and Benefits
- Comprehensive Monitoring: Continuously tracks the health of your system's vital signs like CPU, Memory, Disk and Network.
- Customizable Alerts: Set up alerts based on specific conditions that matter to you.
- Scalable: The system scales with your needs, whether you’re monitoring a single node or a thousand nodes.
- Integrative: Seamlessly integrates with popular platforms like Slack, Email, Opsgenie, and Webhooks for streamlined notifications. For more integrations, check integrations.
Prerequisites
Before adding an alert, you must install the Anteon eBPF agent (Alaz) on your Kubernetes cluster. You can find the installation guide here: k8s-clusters.
If you need help creating clusters or adding alerts, you can ask a question on our Discord server.
Add Alert
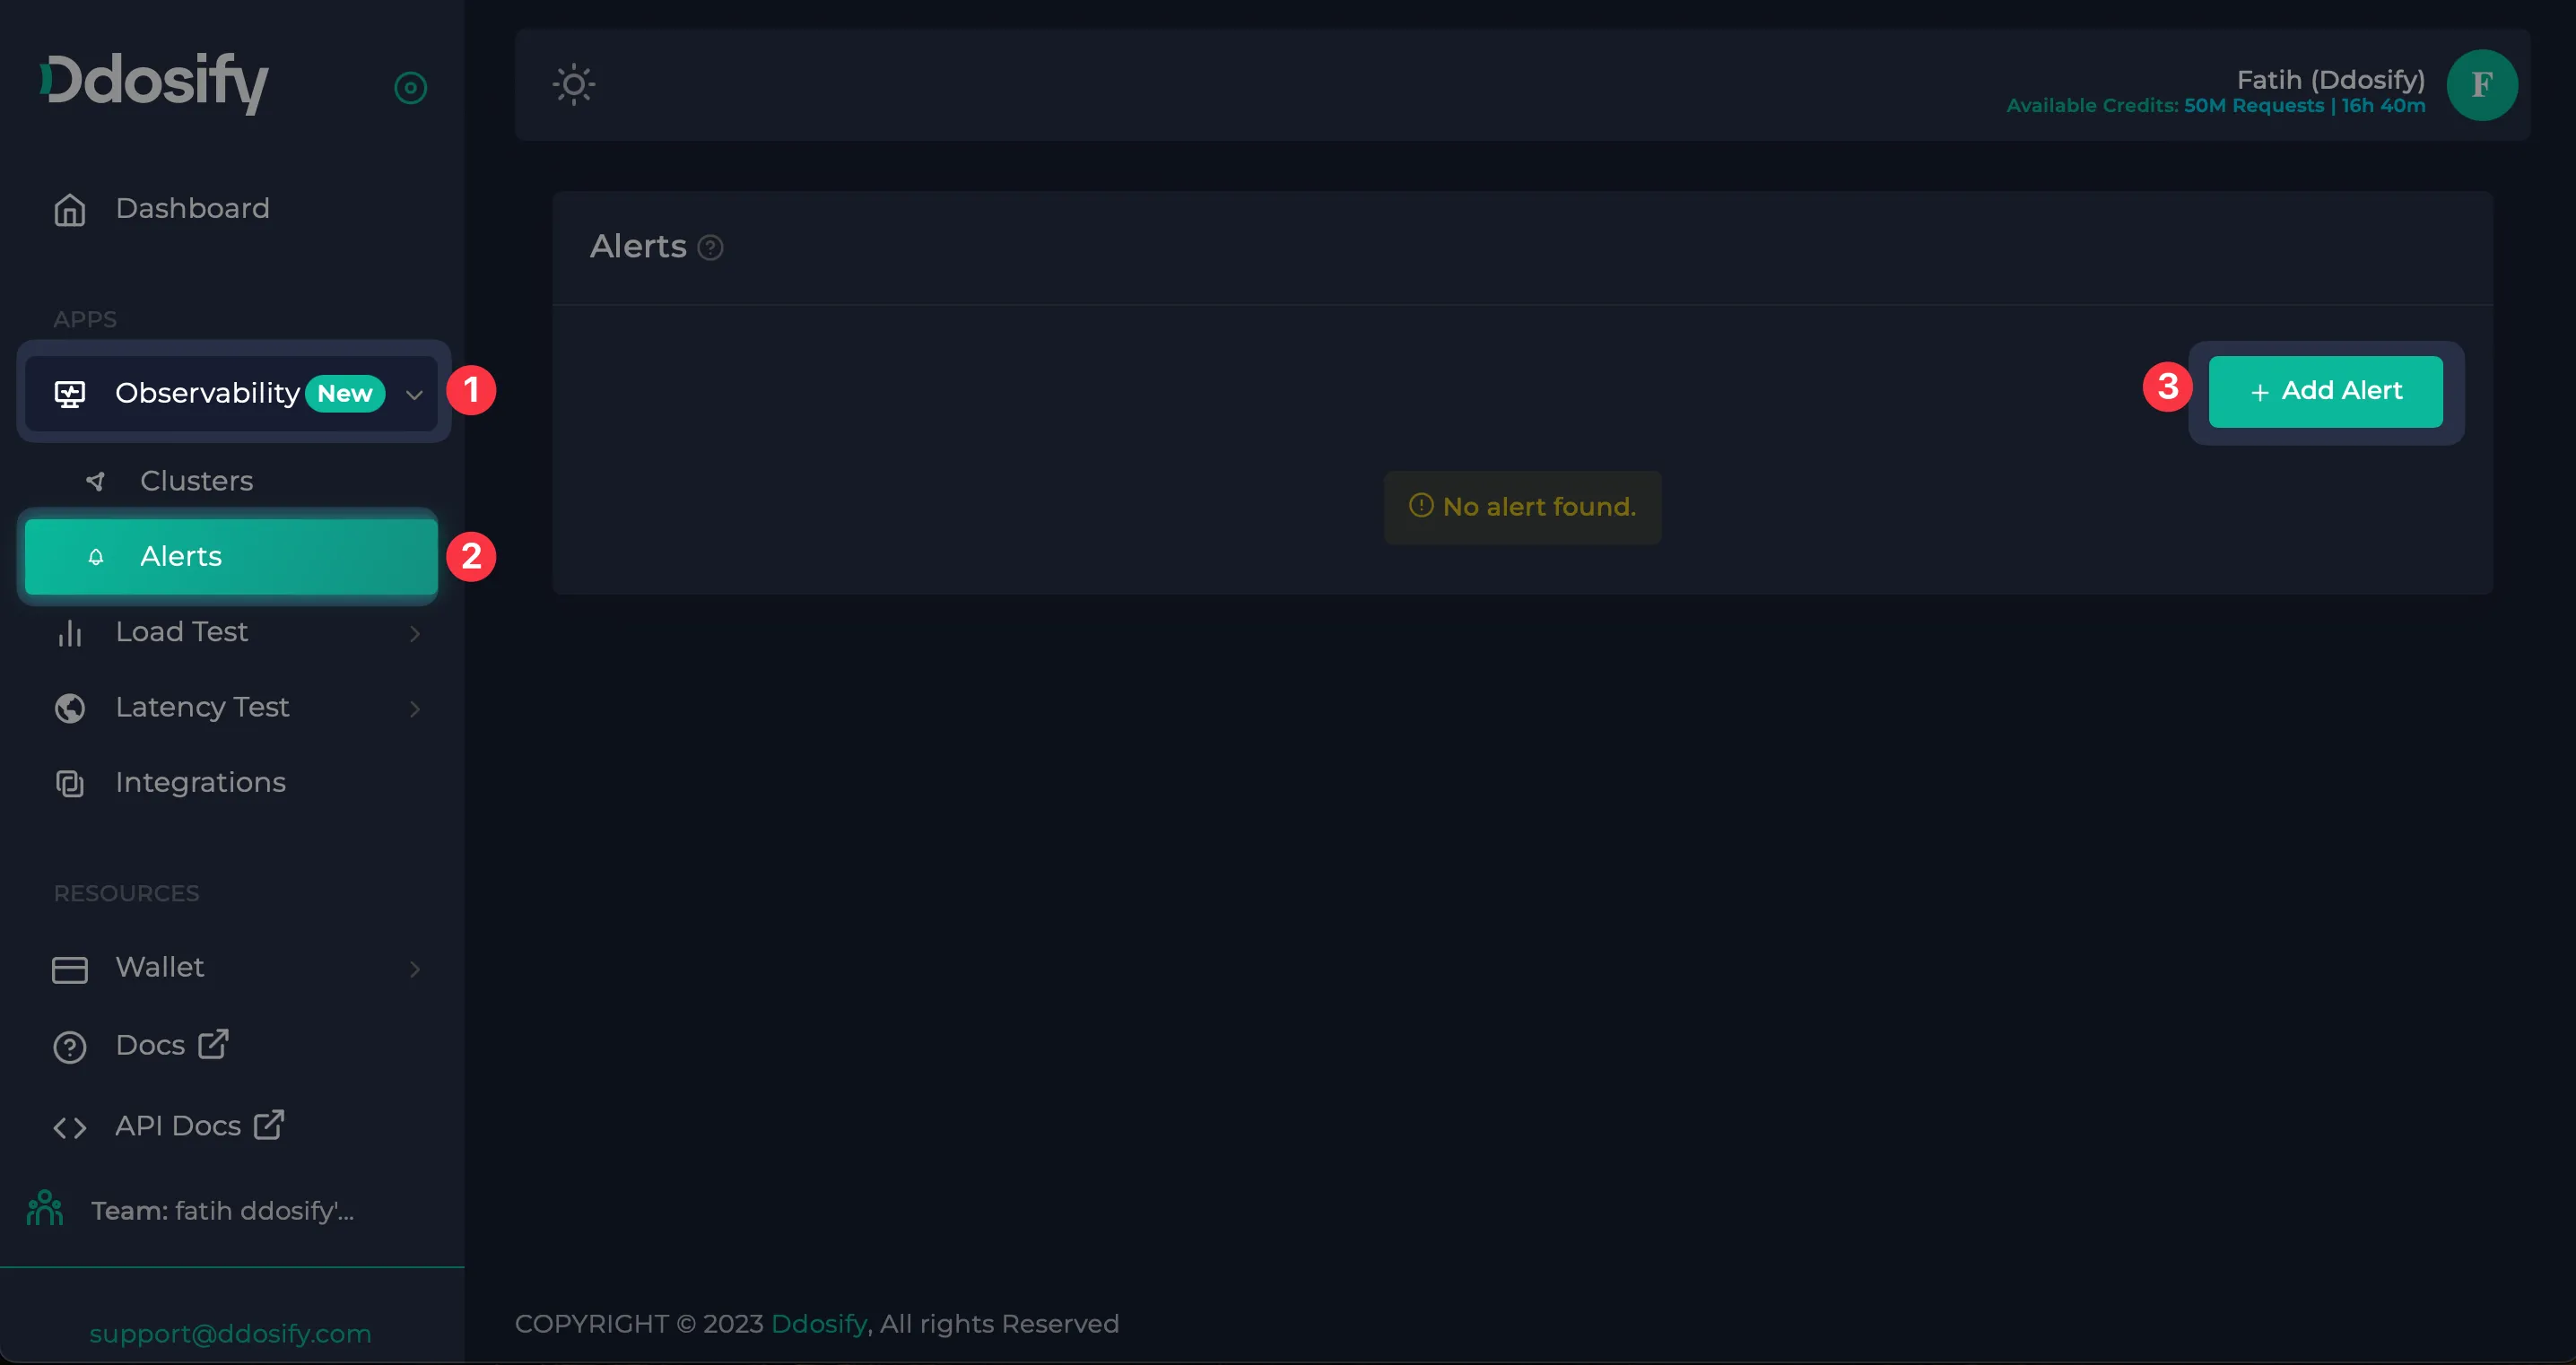
On Anteon, click the Observability tab and then the Alerts tab. On this page, you can see the list of alerts that you have added before. To add a new alert, click on the + Add Alert button.
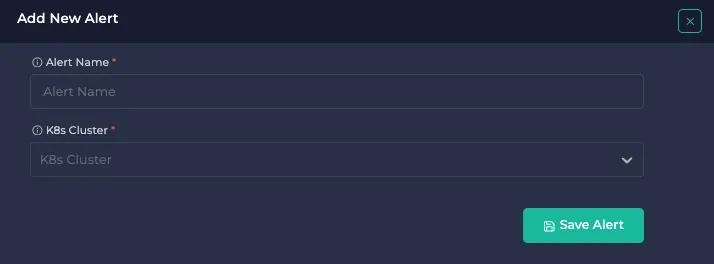
Give a name and select your Kubernetes Cluster.
Monitor All Current & Future Nodes checkbox is selected by default. This means all current and future nodes will be monitored, irrespective of the K8s autoscale. However, if you want to monitor only specific nodes, you can uncheck the Monitor All Current & Future Nodes checkbox and manually select the nodes you want to monitor.
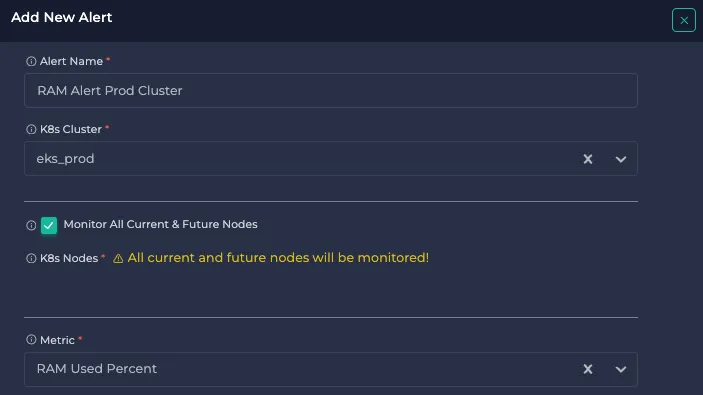
Select Metric for alerting. Here are the metrics that Anteon supports:
CPU Metrics:
| Metric Name | Min. Value | Max. Value | Description |
|---|---|---|---|
| CPU Busy Percent | 0 | 100 | Measures the percentage of time the CPU is working on processes instead of being idle. A value close to 100% indicates that your CPU is very busy. |
| CPU Usage Percent IRQ | 0 | 100 | Tracks the percentage of CPU usage consumed by interrupt requests from hardware devices. |
| CPU Usage Percent Other | 0 | 100 | Percentage of CPU time spent in non-idle, non-user, non-system modes |
| CPU Usage Percent Idle | 0 | 100 | Shows the percentage of time the CPU is not being used by any process. |
| CPU Usage Percent User | 0 | 100 | Indicates the percentage of CPU utilized by user-initiated processes or applications. |
| CPU Usage Percent IOWait | 0 | 100 | Measures the percentage of time the CPU is waiting for Input/Output operations to complete. |
| CPU Usage Percent System | 0 | 100 | Refers to the percentage of CPU used by system processes (kernel code). |
| CPU Core | 0 | - | Gives the count of CPU cores available on your system. |
System Load Metrics:
| Metric Name | Min. Value | Max. Value | Description |
|---|---|---|---|
| Sys Load 5m | 0 | - | Represents the system load average over the last 5 minutes, indicating how many processes are actively running or waiting to run. The max. value is your CPU core count * 100. |
| Sys Load 15m | 0 | - | Similar to the 5-minute metric but averaged over 15 minutes. |
RAM Metrics in Percent:
| Metric Name | Min. Value | Max. Value | Description |
|---|---|---|---|
| RAM Used Percent | 0 | 100 | Shows the percentage of the total RAM that is currently being used. |
| Swap Used Percent | 0 | 100 | Indicates the percentage of the swap space that is in use. Swap space is used when the RAM is full. |
| RAM Usage Percent Cache and Buffer | 0 | 100 | Displays the percentage of RAM used for buffers and cache. |
| RAM Usage Percent Used | 0 | 100 | Reflects the portion of RAM being actively used by processes. |
| RAM Usage Percent Free | 0 | 100 | Shows the percentage of RAM that is free and available for new processes. |
| RAM Usage Percent Swap | 0 | 100 | Measures the percentage of the swap space currently in use. |
| RAM Usage Percent Total | 0 | 100 | Represents the total percentage of RAM used, including all buffers and caches. |
RAM Metrics in Bytes:
These metrics are similar to their percent-used counterparts but provide the raw values in bytes, giving you an exact memory usage figure.
| Metric Name | Min. Value | Max. Value | Description |
|---|---|---|---|
| Total RAM Bytes | 0 | - | The total amount of RAM available on the system, in bytes. |
| Total Swap Bytes | 0 | - | The total size of swap space available on the system, in bytes. |
| RAM Usage Bytes Cache and Buffer | 0 | - | The amount of RAM in bytes used for cache and buffers. |
| RAM Usage Bytes Used | 0 | - | The total bytes of RAM that are currently used by processes. |
| RAM Usage Bytes Free | 0 | - | The amount of free RAM available in bytes. |
| RAM Usage Bytes Swap | 0 | - | The size of used swap space in bytes. |
| RAM Usage Bytes Total | 0 | - | The total size of RAM in bytes. |
Disk Metrics:
| Metric Name | Min. Value | Max. Value | Description |
|---|---|---|---|
| Root FS Used Percent | 0 | 100 | Displays the percentage of the root filesystem that is used. |
| Total Root FS Bytes | 0 | - | The total size of the root filesystem, measured in bytes. |
| Disk Usage Percent Used | 0 | 100 | Indicates the percentage of disk space used across all mounted filesystems. |
Network Metrics:
| Metric Name | Min. Value | Max. Value | Description |
|---|---|---|---|
| Network Usage Amount Bits Received | 0 | - | The total number of bits received over the network. |
| Network Usage Amount Bits Transmitted | 0 | - | The total number of bits transmitted over the network. |
Miscellaneous Metrics:
| Metric Name | Min. Value | Max. Value | Description |
|---|---|---|---|
| Uptime Seconds | 0 | - | The total time, in seconds, that the system has been running since the last reboot. |
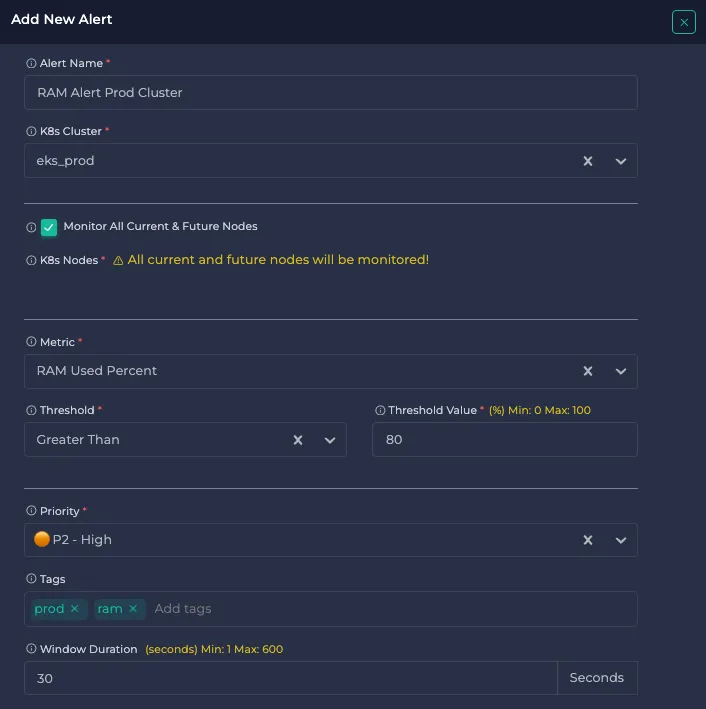
After you select the Metric, select Threshold and Threshold Value.
Select Priority, which will be used for urgency level. P1 represents the highest priority, while P5 is the lowest. This helps prioritize response to alerts and is used for escalation in integrated systems like Opsgenie and PagerDuty.
Optionally, you can add Tags.
Select Window Duration to specify the time window when the metric value should meet the threshold condition to trigger an alert. This helps prevent false positives and ensures consistent problematic behavior before alerting. All the data points in the window duration should be alerted to make an alert.
For example, in this configuration, an alert will be triggered if the RAM Used Percent exceeds 80 for at least 30 seconds.
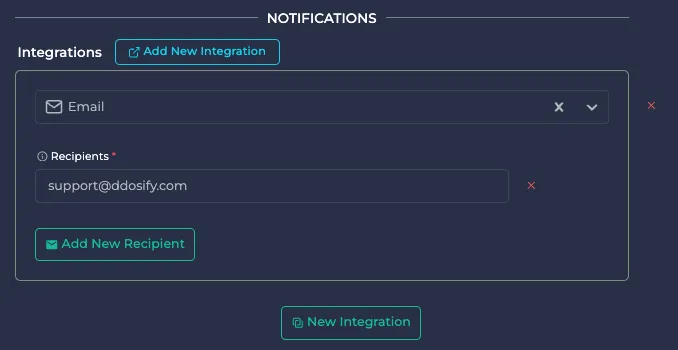
By default, your e-mail address is used for notifications. You can add additional e-mail addresses by clicking the Add New Recipient button.
You can add another integration with e-mail notification by clicking the New Integration button. In this configuration, if an alert is triggered, a notification will be sent using e-mail, Slack and OpsGenie.
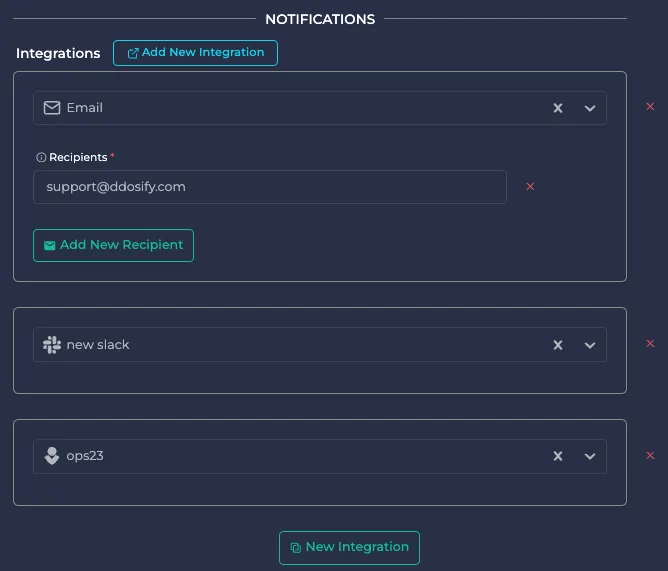
To add new integrations, check integrations page.
Click Save Alert to save the alert. Every 30 seconds, the condition will be checked and if an alert is triggered.
Anteon alert system sends notifications on the 1st, 10th, 20th, and 30th occurrence of an issue. This allows you to stay on top of critical events with minimal distractions.
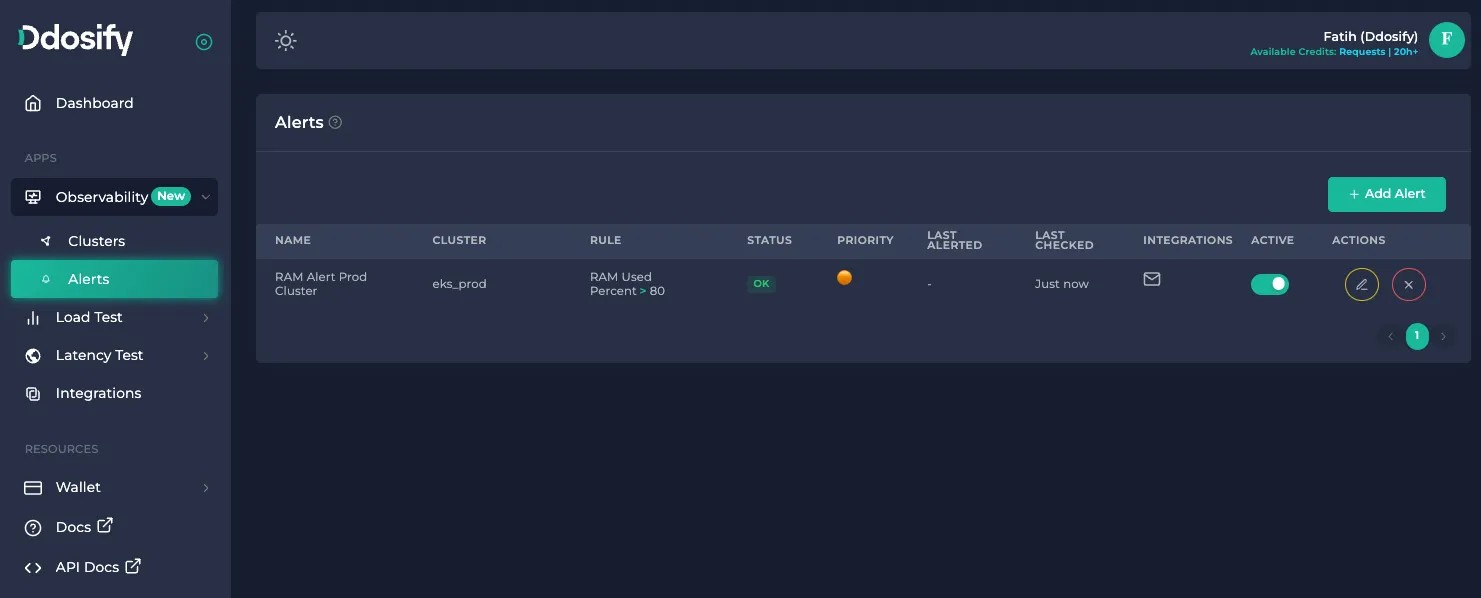
List Alerts
On the Alerts page, you can see your alerts as a list. You can enable/disable alerts by active column, Edit and Delete alerts. Status columns can be OK if everything is fine and Alert if there is an alert condition.
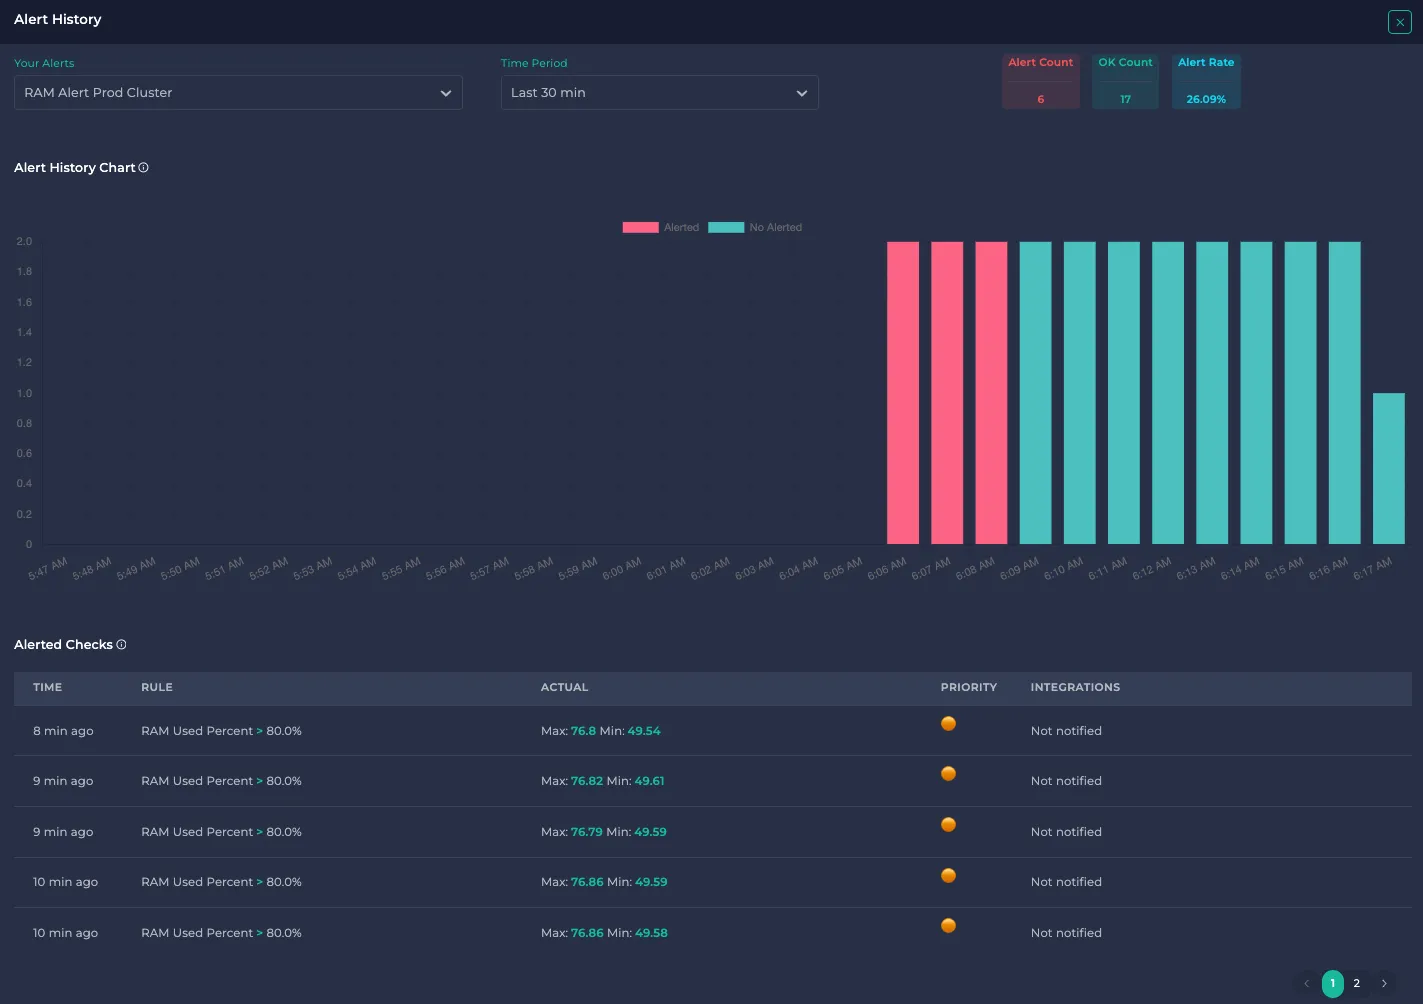
Alert History
You can access the Alert History by clicking the Alert name in the Alert list. In this section, you can see Alert Count, OK Count and Alert Rate with time period (Last 5 min, Last 30 min, ...). In this example, the Alert Rate is 26.09% in the last 30 minutes.
The table shows the Time, Rule, Actual value on the window, Priority and Integrations for Alerted checks.
If you require assistance with Alerts, you can join our Discord or send an email to [email protected].