📈 Dashboard
The first page that welcomes you after logging in is the dashboard. Here, you can think of this page as a summary of your account. Through the dashboard, you can view your observability summary, latest load/latency tests, subscription status etc.
.webp)
There are 7 sections in the dashboard:
- Available Credits
- Observability Stats
- Load Test Stats
- Latency Test Stats
- Latest Load Test Runs
- Latest Latency Test Runs
- Usage Report
Available Credits

Here, information about your plan and subscription status is written. Your Cloud and Self-Hosted plans differ and thus they are represented separately. You can also use the button below to change your subscription plan.
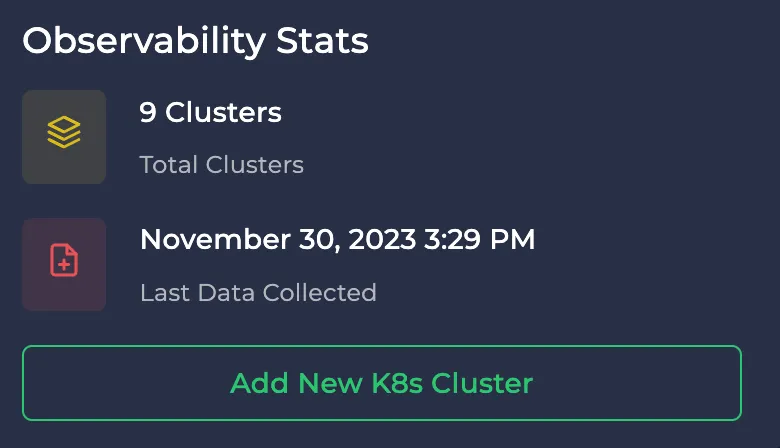
Observability Stats

Here, you can view the number of clusters you’ve created and the latest data collected from any of them. You can also use the button below to create a new cluster.
Load Test Stats

Here, you can view the total number of load test results and the number of test plans you have. You can also use the button below to create a new load test.
Latency Test Stats

Here, you can view the total number of latency test plans and the number of schedulers you have. Schedulers are based on these test plans and they are designed to run regularly. You can also use the button below to create a new latency test.
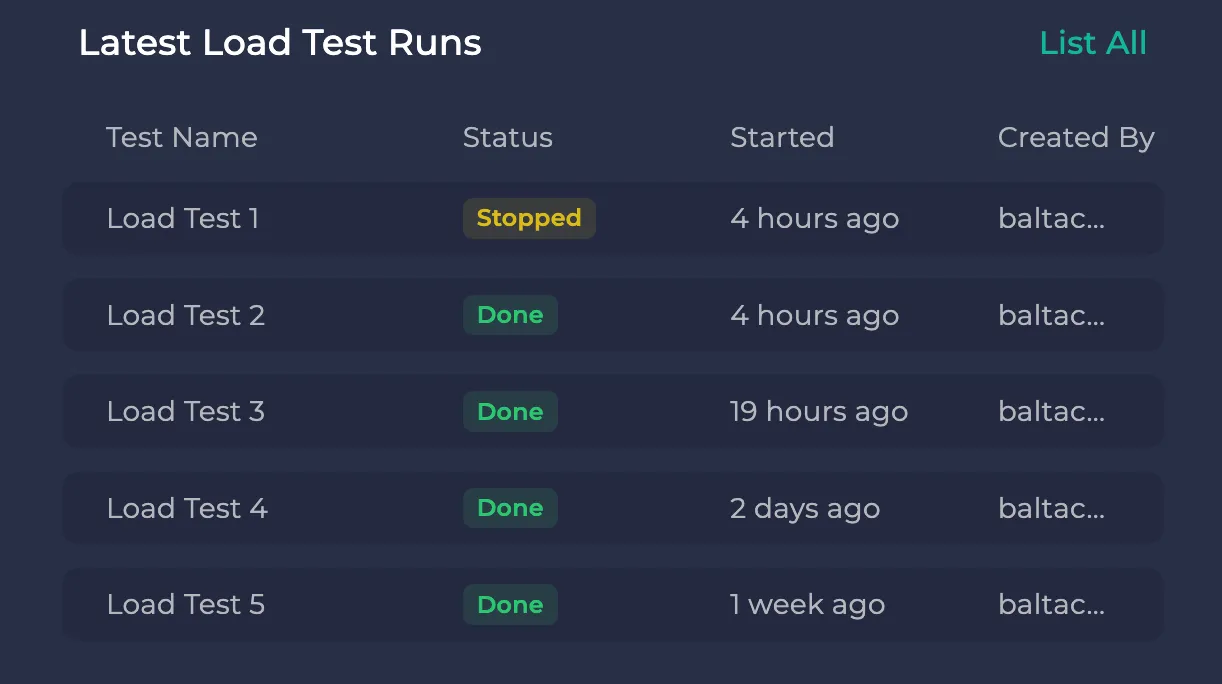
Latest Load Test Runs

Here, you can view your latest 5 load tests and their status. You can also click on the “List All” button to view all of your load test results.
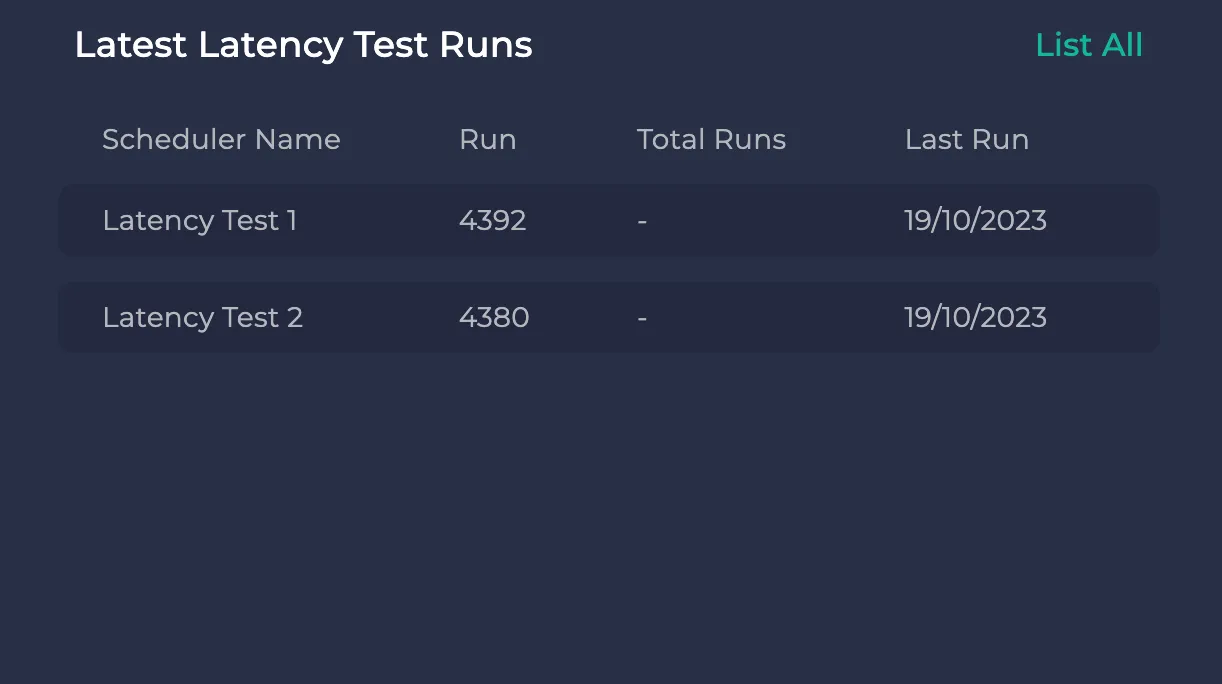
Latest Latency Test Runs

Here, you can view your latest 5 latency tests and their run counts along with the last run timestamp. You can also click on the “List All” button to view all of your latency test schedulers.
Usage Report

Here, you can view your request count and duration usage summary for the last 30 days. You can see more details if you hover on the data:
