🔎 Kubernetes Monitoring
If you have a Kubernetes Cluster that you want to observe, look no further. Anteon Observability allows you to monitor your Kubernetes Clusters with nearly zero manual effort. You only need to run our open-source eBPF agent (Alaz) as a DaemonSet on your Kubernetes cluster. Anteon will handle the rest of the work and Service Map and Metrics Dashboard will be available on Anteon UI.
Service Map
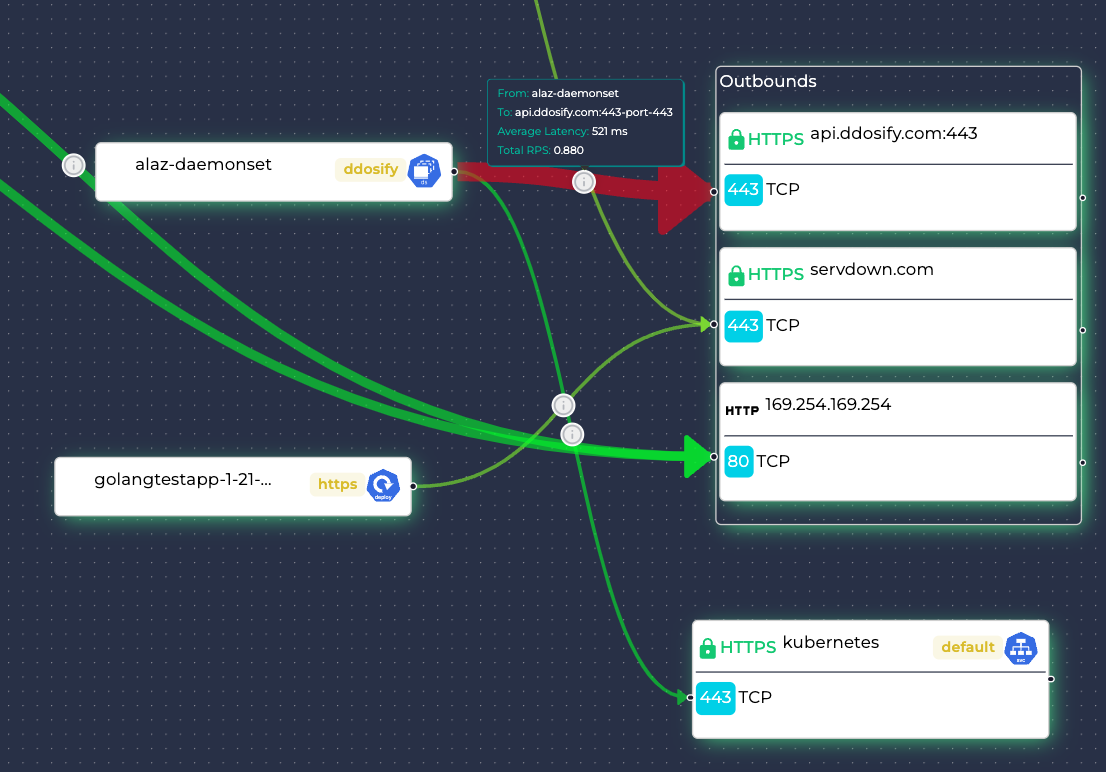
Service Map allows you to view the interactions between the resources in your K8s Cluster. Here, you can take a look at the requests sent, their latency, RPS and many more. You can also filter them however you want to get the insights you require.
.webp)
You can easily get insights about what is going on in your cluster. You do not have to change your code or add sidecars anymore.

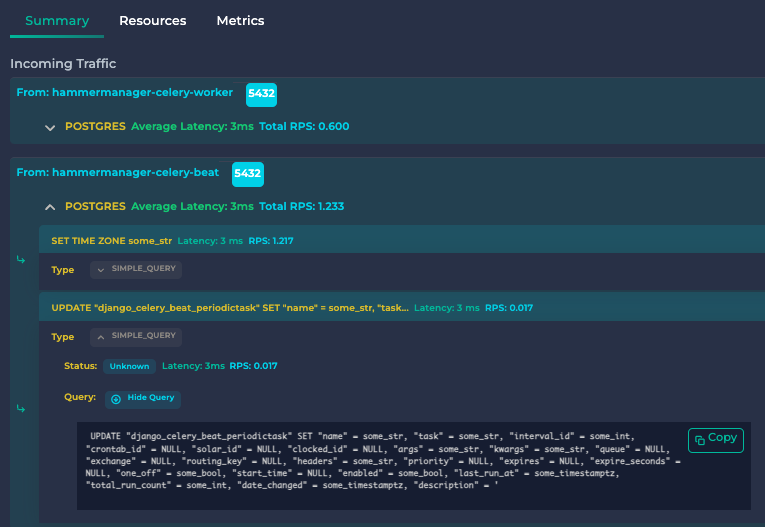
Inspect incoming, outgoing traffic, SQL queries, golden signals, HTTP 5xx status codes, Top Latencies and RPS, and more.

Metrics
Metrics allow you to view statistics about your K8s instances such as CPU/Memory/Disk usage. You can also see their change over time and apply time filtering if you want to take a look at a specific time interval.
.webp)
Kubernetes Monitoring feature of Anteon is available for both Anteon Self-Hosted or Anteon Cloud. See Anteon Stack for more information.
Finding Bottlenecks
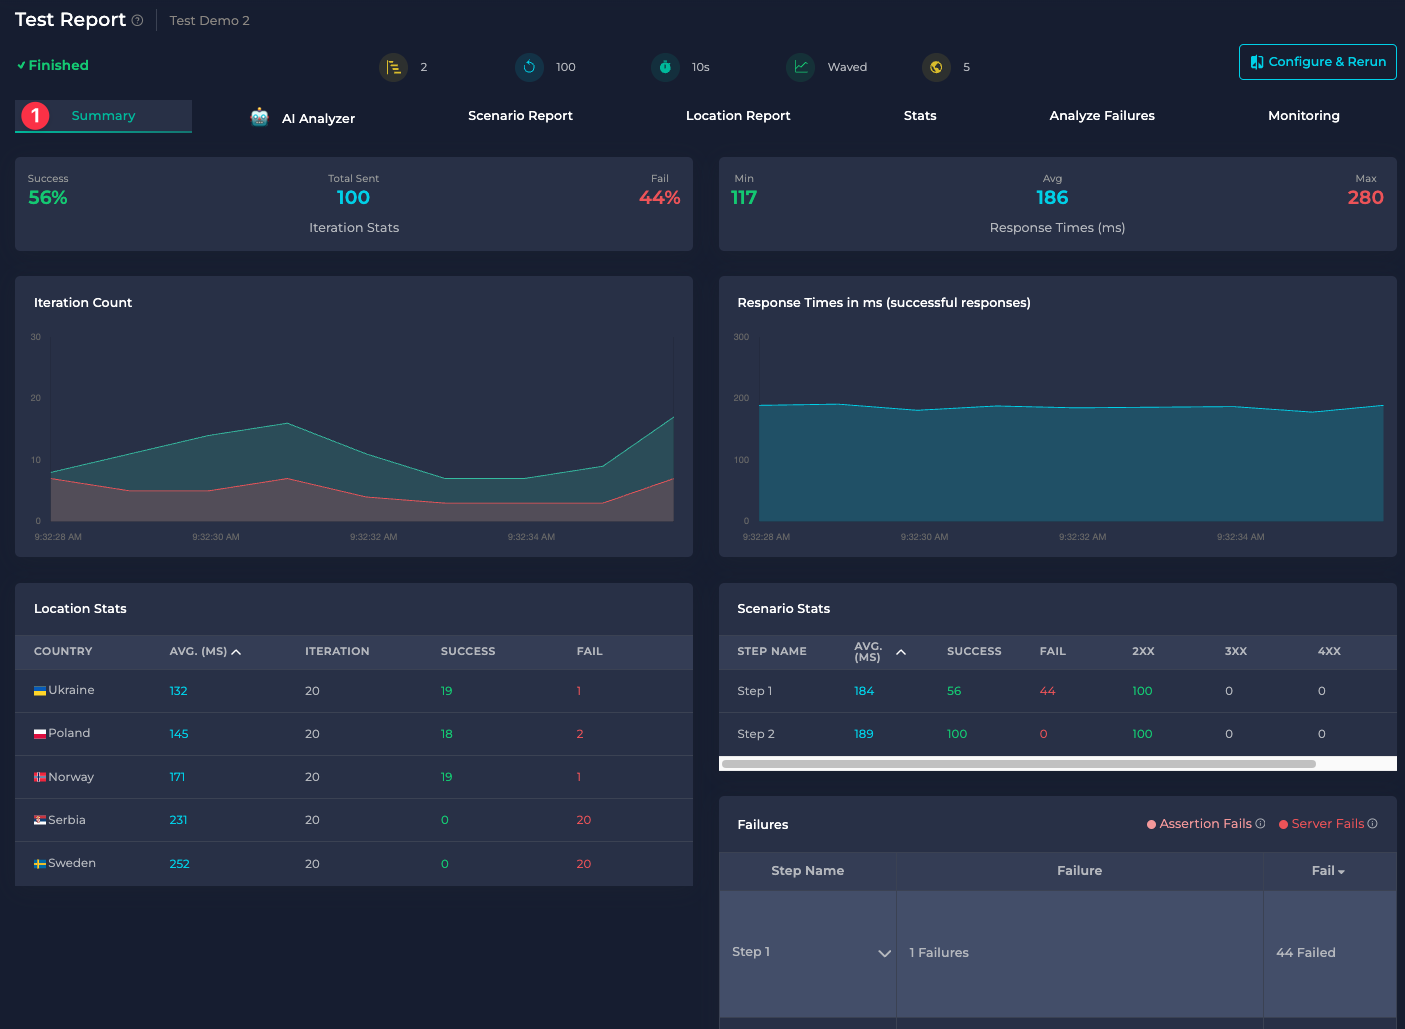
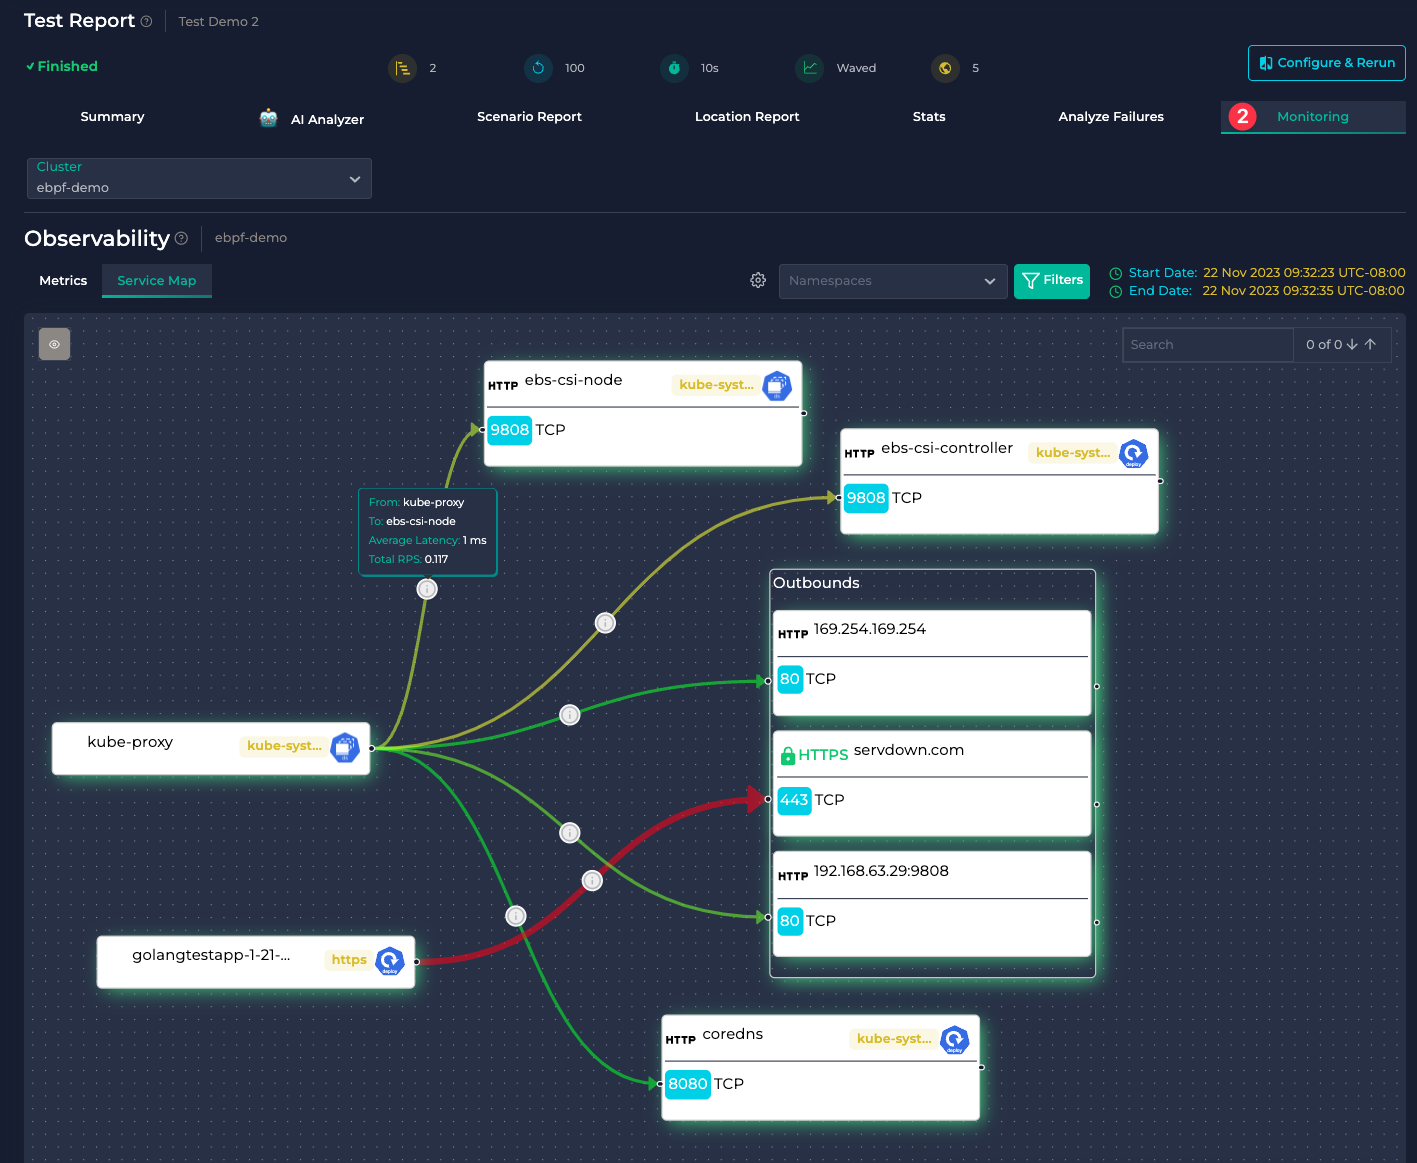
Start a load test and monitor your system all within the same UI. You do not need to correlate the load test results with the monitoring data and switch between different tools.
You will see the outgoing requests, response times and status codes on the load test Summary tab.

You will see the incoming requests to your K8s cluster, service-to-service traffic, RPS, latencies, SQL queries, and more on the Monitoring tab. So you can easily correlate the load test results with the monitoring data without switching between different tools.
