Introduction
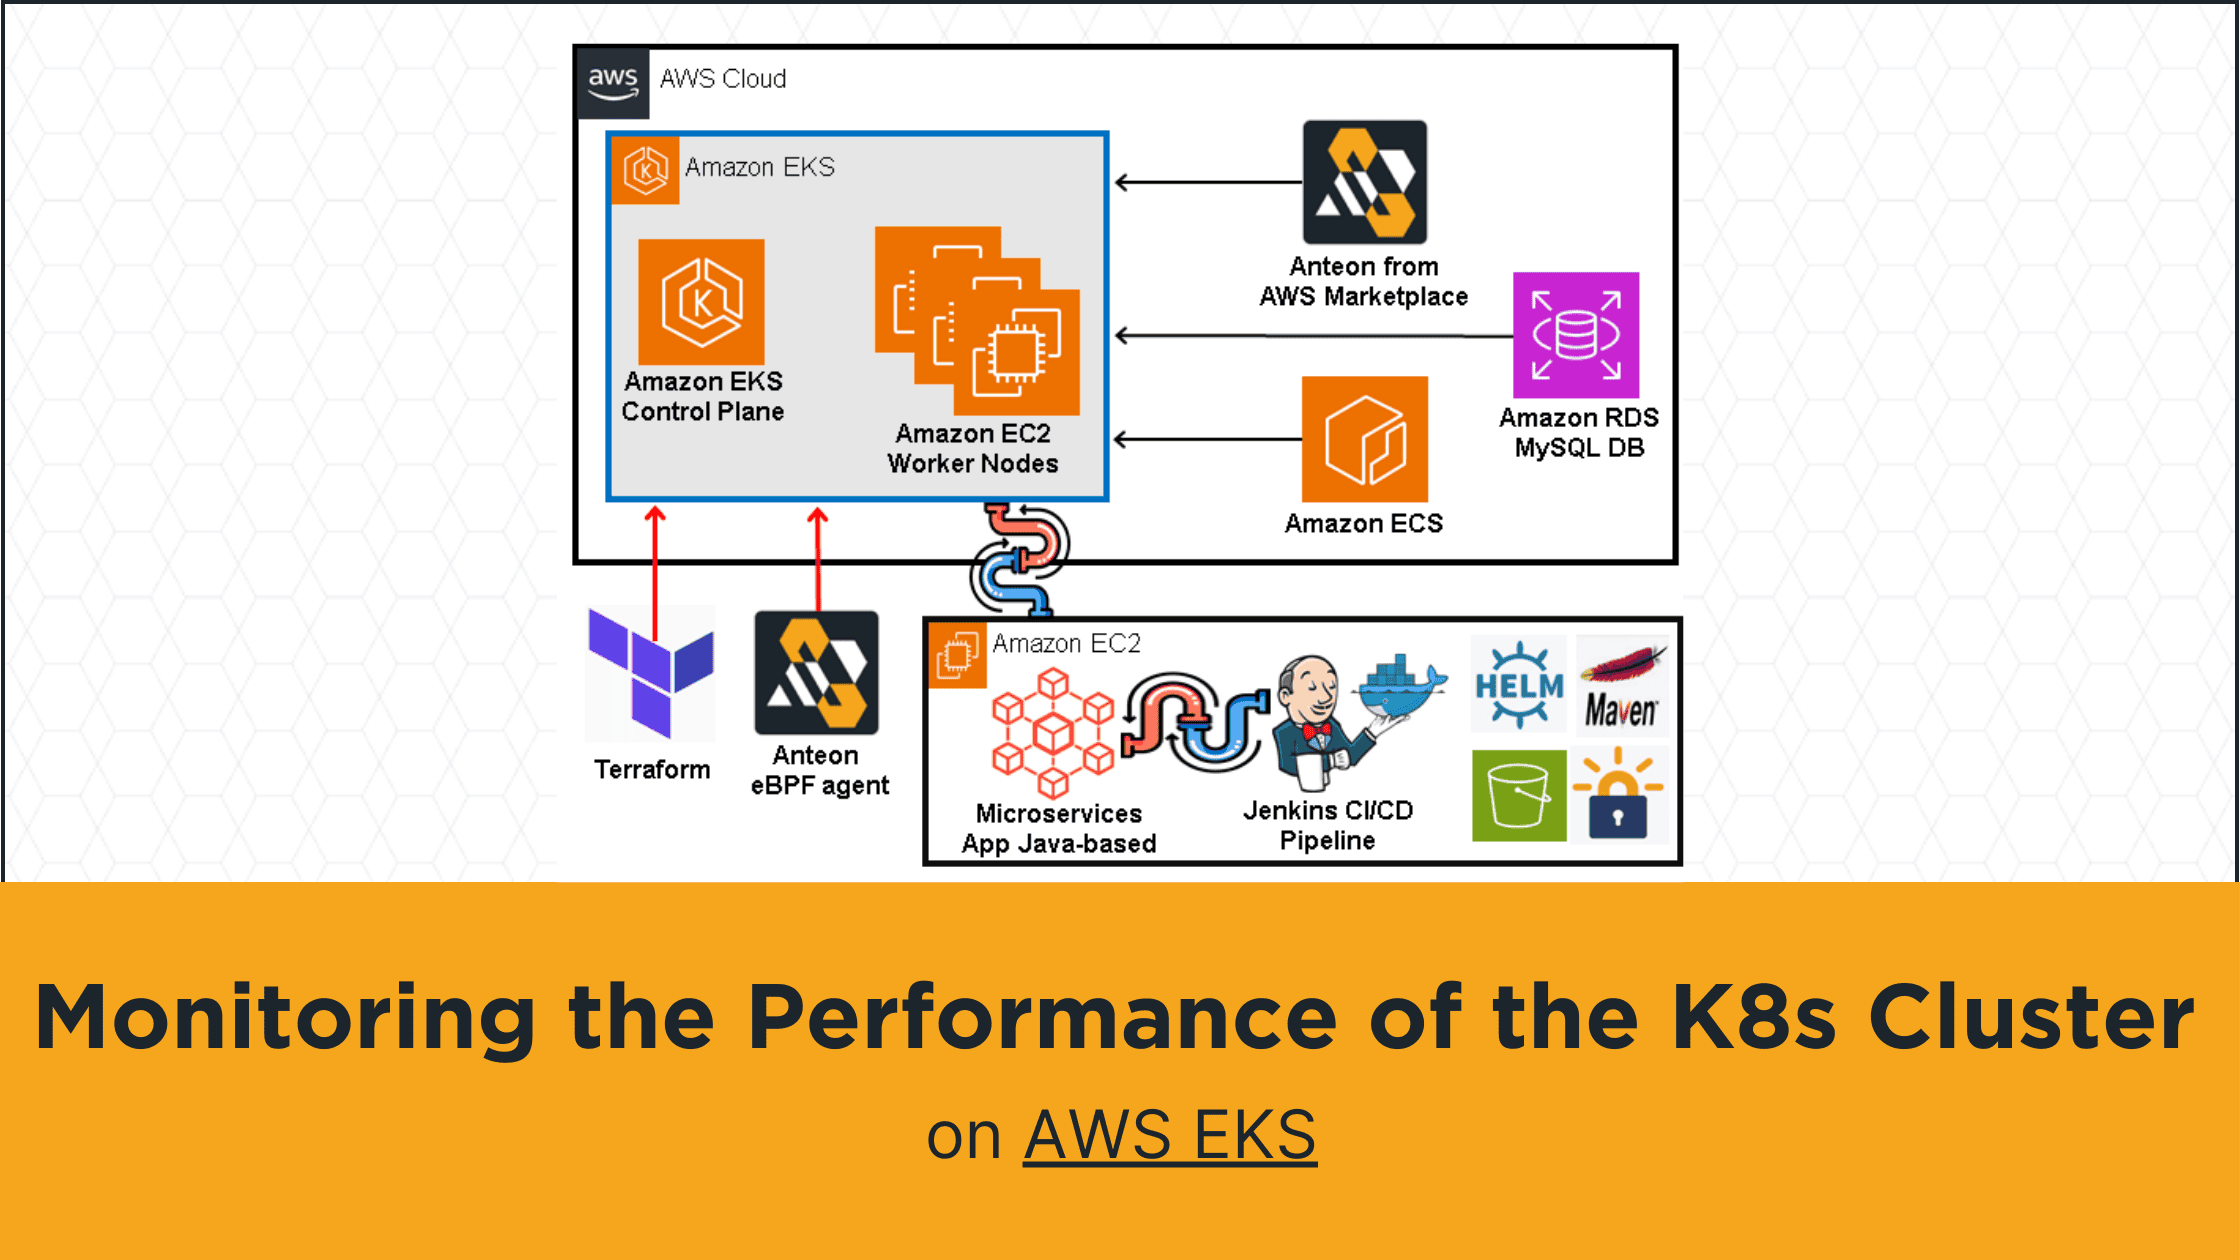
In this article, we’ll focus on setting up a CI/CD pipeline for the deployment of a microservices application with MySQL Database into the Amazon EKS Kubernetes cluster. We’ll walk through the process of setting up a CI/CD pipeline on Amazon EKS, with a specific focus on Kubernetes clusters.
Also, we’ll monitor and set an alarm for the K8s cluster using Anteon. We’ll explore how Anteon can be used for comprehensive monitoring of the Kubernetes clusters, to ensure optimal performance and reliability.
First, we’ll create an AWS EKS Kubernetes Cluster to do these. Then, we’ll prepare a pipeline in Jenkins, and deploy a Java-based web application that consists of 11 microservices into the Kubernetes cluster by using Helm on the Jenkins pipeline. We’ll integrate the Amazon RDS MySql Database for customer records into the microservices app on the Jenkins pipeline. We’ll also use a GitHub Repository for Source Code Management and an Amazon ECR Private Repository for Artifacts.
Additionally, we’ll use Amazon Route 53 for the domain registrar, and configure a TLS/SSL certificate for HTTPS connection to the domain name using Let’s Encrypt-Cert Manager. After running the Jenkins pipeline, we will check whether our microservices application works in the browser or not.
Finally, we’ll use Anteon Cloud as a complete SaaS solution for Kubernetes Cluster Monitoring. We’ll add the Kubernetes cluster into the Anteon to start observability with nearly zero manual effort. We’ll monitor the microservices apps in the cluster with Anteon, view statistics about the Kubernetes instances such as CPU/Memory/Disk usage with Anteon Metrics, view the interactions between the resources in the Kubernetes Cluster with Anteon Service Map, and set an alarm for the Kubernetes cluster using Anteon Alerts, get an alert message via mail when we run a dummy load in our K8s cluster.
We will do these practically step by step in this article.
If you like the article, you can follow my LinkedIn account to be informed about new articles. If you write your valuable comments for this article and subscribe, I will be happy and this will encourage me to write more articles like this.
1. Kubernetes Monitoring and Anteon
Microservice Architecture, Kubernetes Cluster, and Monitoring
One of the primary advantages of microservices is the ability to independently scale individual components. Kubernetes supports this through several scaling mechanisms. The most common is the Horizontal Pod Autoscaler (HPA), which automatically adjusts the number of replicas of a specific pod based on demand. We can also implement the Vertical Pod Autoscaler (VPA) to set appropriate container resource limits based on live data and the Cluster Autoscaler (CA) to dynamically scale infrastructure to accommodate the fluctuating needs of a microservices-based application(1). Leveraging Kubernetes within your Amazon EKS cluster can significantly enhance the deployment and management of your microservices architecture.
However, Kubernetes cluster management and maintenance can be challenging; continuous monitoring and troubleshooting are necessary to guarantee optimal performance and reliability. By monitoring and evaluating a Kubernetes cluster, we can identify potential problems before they become critical, and adjust our strategy or resources accordingly.
Without a monitoring solution, you’ll have to guess at possible sources of problems, and then use trial and error to test fixes. This increases the workload of developers, especially newcomers who are unfamiliar with the system. Detecting problems earlier minimizes downtime.
To do this, there are various Kubernetes monitoring tools such as Prometheus-Grafana, Kubernetes Dashboard, Datadog, Anteon, cAdvisor, Helios, New Relic, and Dynatrace, etc. Also, Cloud Services-based solutions; Amazon CloudWatch, Azure Monitor, and Google Cloud Monitoring, etc.
Additionally, there are also various Kubernetes logging tools such as Elastic Stack (ELK), Loki, Fluentd, Zebrium, etc. Also, Cloud Services-based solutions; Amazon CloudWatch Logs, Azure Monitor Logs, and Google Cloud Logging, etc.
Kubernetes Cluster Monitoring with Anteon
I used some of these tools in my projects and mentioned them in my articles. But one tool I used recently really impressed me with its simplicity of setup, ease of use, and functionality: Anteon.
Anteon is an open-source Kubernetes Monitoring and Performance Testing platform(2). In my opinion, the most important features that make it advantageous compared to its competitors are a 1-minute easy setup to monitor the Kubernetes, automatically creating a Service Map for interactions among the resources in the Kubernetes Cluster, and it is also a high-performance testing tool for the Kubernetes Cluster.
Deployment of Anteon
There are various deployment options(3):
We can deploy Anteon Self-Hosted on Kubernetes using the Helm chart.
We can also set up using Docker Compose to the VM instances.
We can also deploy Anteon by using AWS Marketplace for easy deployment on AWS (Amazon Web Services).
We can also use Anteon Cloud as a complete SaaS solution for Kubernetes Cluster Monitoring. We’ll add the K8s cluster into the Anteon Cloud to start observability with nearly zero manual effort. If you do not want to manage the services, Anteon Cloud is the right choice. In this article, we'll use Anteon Cloud.
Anteon Stack
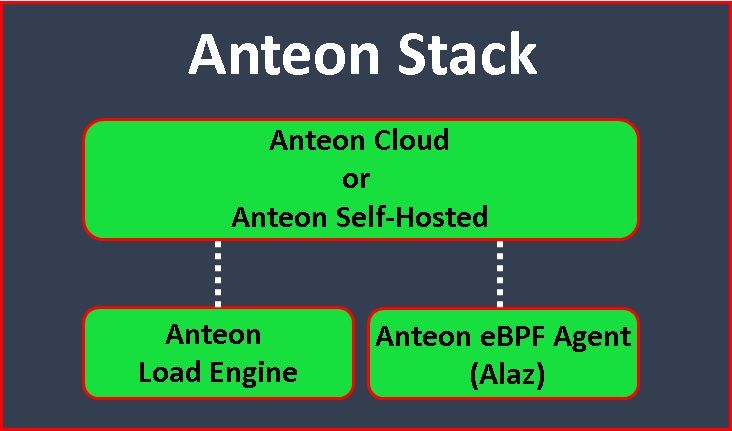
Anteon Stack consists of 4 parts(2):
- Anteon Engine: It is the load engine and a CLI load-testing tool. Anteon Self-Hosted and Anteon Cloud use it under the hood for load generation.
- Anteon eBPF Agent (Alaz): It is deployed as a DaemonSet on your Kubernetes cluster. It collects metrics and service traffic and then sends them to Anteon Cloud or Anteon Self-Hosted.
- Anteon Self-Hosted: It has a web-based user interface, Performance Testing, and Kubernetes Monitoring capabilities. You can add your servers as Load Engines to the platform for distributed performance testing. While it shares many of the same functionalities as Anteon Cloud, the Self-Hosted version is designed to be deployed within your infrastructure for enhanced control and customization.
- Anteon Cloud: It is a complete SaaS solution for Kubernetes Cluster Monitoring. It features a web-based user interface, multi-location-based Performance Testing, and Kubernetes Monitoring. With Anteon Cloud, you can generate traffic to your endpoints from 25+ countries without code or scripting.
Anteon Features
- Kubernetes Monitoring (CPU, memory, disk space, and network usage) and sending Alerts when exceeding thresholds.
- Effortlessly visualize Kubernetes clusters as Service Map, thus we can view the interactions between the resources in the K8s Cluster.
- Viewing statistics about K8s instances with Metrics Dashboard.
- Distributed Tracing, Anteon automatically collects traces from your Kubernetes cluster and generates context propagation without changing a single line of code (4).
- No-code Performance Testing generates load/performance tests from over 25 countries worldwide and creates test scenarios easily without writing any code (5).
- Detailed Reporting, Insightful reports, and charts to improve your observations. Analyze the failed requests on UI (6).
- Latency Testing, Evaluate the latency of your endpoints with detailed city-level analysis. Schedule regular latency tests to monitor your endpoint’s performance over time (6).
- Comprehensive Dashboard.
2. Hands-on Experience of Setting up Microservices on Kubernetes and Monitoring
Now it’s time to get some hands-on experience. We will do what we explained above practically step by step in the following items. Let’s start.
2.1. Prerequisites
- Amazon AWS Account: An Amazon AWS Account is required to create resources for the Jenkins server in the AWS cloud. If you don’t have one, you can register here.
- Amazon AWS Access Key: Use this link to follow a tutorial to create an Amazon AWS Access Key if you don’t have one yet.
- An Amazon EC2 key pair: If you don’t have one, refer to creating a key pair.
- Jenkins: It is a Continuous Integration/Continuous Delivery and Deployment (CI/CD) automation software. If you don’t have it, you can install it from here.
- Docker: It is a containerization platform (to build, run, test, and deploy distributed applications quickly in containers. If you don’t have it, you can install it from here.
- GitHub Account: It is a developer platform that allows developers to create, store, manage, and share their code. If you don’t have it, you can create an account on GitHub from here.
2.2. The tools we will use in this article
We will use the below tools in this article:
Amazon EKS (Amazon Elastic Kubernetes Service) is an AWS-managed Kubernetes service to run Kubernetes on AWS without needing to install, operate, and maintain.
Amazon S3 bucket is an object storage, we’ll use it as a repository for Helm charts.
Amazon ECR (Amazon Elastic Container Registry) is an AWS-managed Docker container image registry service.
Amazon Route53 is a Domain Name System (DNS) service (for domain registration, DNS forwarding, and health checking without coding requirements).
Let’s Encrypt, to enable HTTPS on your website, you need to get a certificate (a type of file) from a Certificate Authority (CA). Let’s Encrypt is a CA. Let’s Encrypt uses the ACME protocol in order to control your domain.
Cert Manager gives certificates from supported sources such as Let’s Encrypt. Cert-manager adds certificates and certificate issuers as resource types in Kubernetes clusters and simplifies the process of obtaining, renewing, and using those certificates.
AWS Certificate Manager is a public and private SSL/TLS(Secure Sockets Layer/Transport Layer Security) certificate provider (for connecting to the web page of the microservices application via HTTPS protocol).
Amazon RDS (Amazon Relational Database Service) is a fully managed, cloud relational database service.
Amazon CloudFront is a content delivery network (CDN) operated by Amazon Web Services. We’ll use it to reduce the load on the server and protect against DDoS attacks.
GitHub is a developer platform that allows developers to create, store, manage, and share their code. We’ll use it as a source code repository.
Jenkins is a Continuous Integration/Continuous Delivery and Deployment (CI/CD) automation software.
Maven is a software project management tool (for building and managing the Java-based project).
Docker is a containerization platform (to build, run, test, and deploy distributed applications quickly in containers).
Terraform is an infrastructure-as-code software tool. We’ll use it to set up Jenkins Server.
Anteon is an open-source Kubernetes Monitoring and Performance Testing platform(2).
3. Creating an AWS EKS cluster
3.1. Connecting to Your Server (AWS EC2 instance)
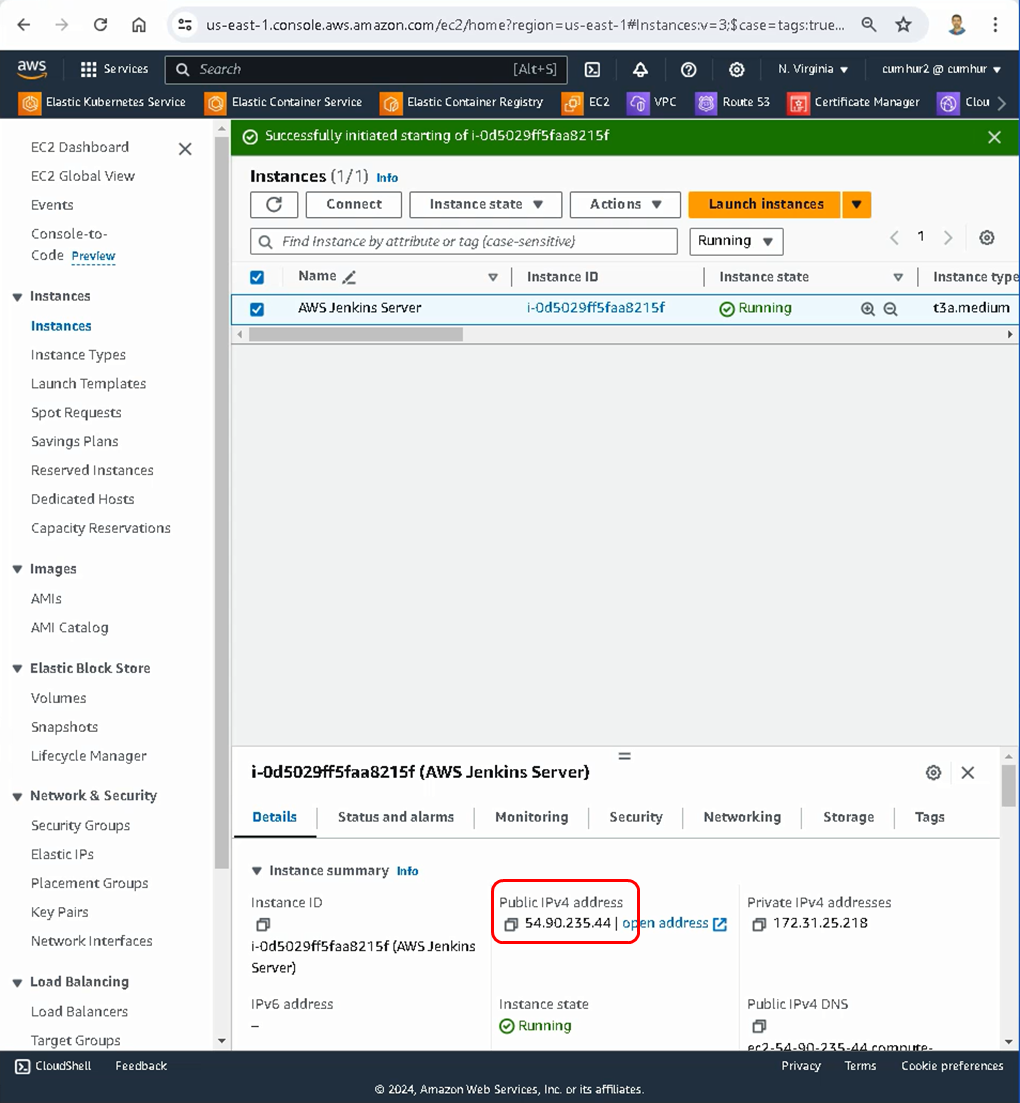
We will use an Amazon EC2 (Amazon Elastic Compute Cloud) instance to set up and reach our Kubernetes cluster. We will install the necessary installations to our Kubernetes cluster through this EC2 instance. We will also install and use Jenkins in this EC2 instance. I will use my EC2 instance named AWS Jenkins server for this job. You can use this link to set up an EC2 instance on AWS.
Copy your EC2 instance's public IP to connect to the EC2 instance (The name of my EC2 instance is AWS Jenkins server), as shown in the figures below.
I use VSCode to connect to my servers. Paste the AWS Jenkins server’s public IP into the VSCode config file, and then click on the Connect to host, and select the host you want to connect to, that’s all, I connected to my EC2 instance named AWS Jenkins server, as shown in the figures below.
Note: You can check my article link for more information about the connection to the EC2 instance using VSCode. You can also check this link for more information about different connection methods to EC2 instances.

Switch the user to jenkins from ec2-user with the following command, as shown in the figures above.
Since the CI/CD pipeline will run on the jenkins user, we need to create the cluster.yaml file in this user.
sudo su -s /bin/bash jenkins
cd /var/lib/jenkins
whoami
jenkins
pwd
/var/lib/jenkins
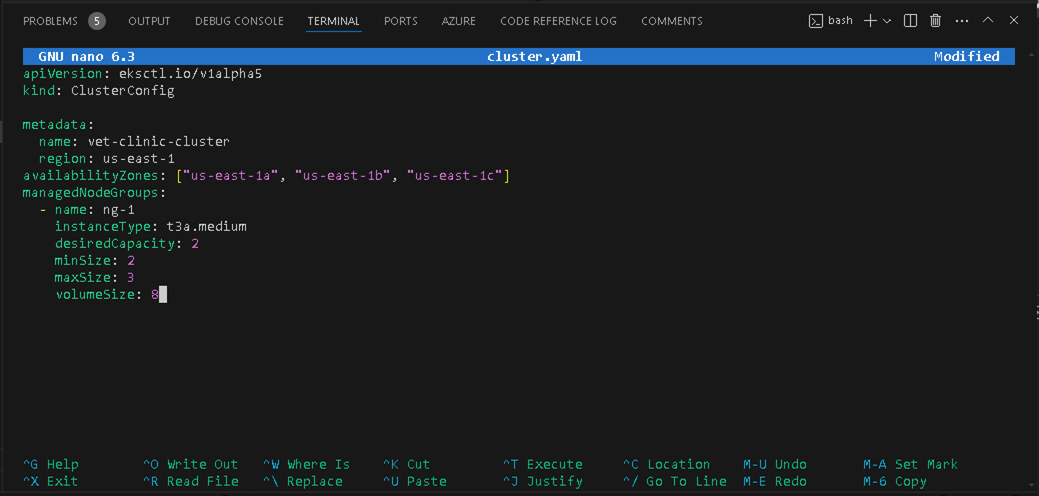
3.2. Creating cluster.yaml file
In order to create an AWS EKS cluster, firstly, create a cluster.yaml file under the /var/lib/jenkins folder, and use the following content, as shown in the figure below. Use the sudo nano cluster.yamlcommand to create cluster.yamlfile.
apiVersion: eksctl.io/v1alpha5
kind: ClusterConfig

metadata:
  name: petclinic-cluster
  region: us-east-1
availabilityZones: ["us-east-1a", "us-east-1b", "us-east-1c"]
managedNodeGroups:
  - name: ng-1
    instanceType: t3a.medium
    desiredCapacity: 2
    minSize: 2
    maxSize: 3
    volumeSize: 8
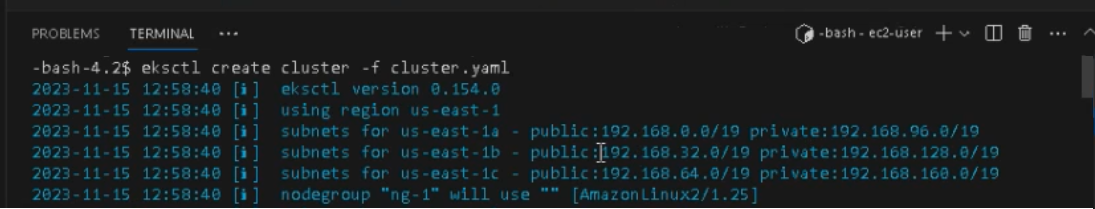
3.3. Creating a Cluster Using eksctl
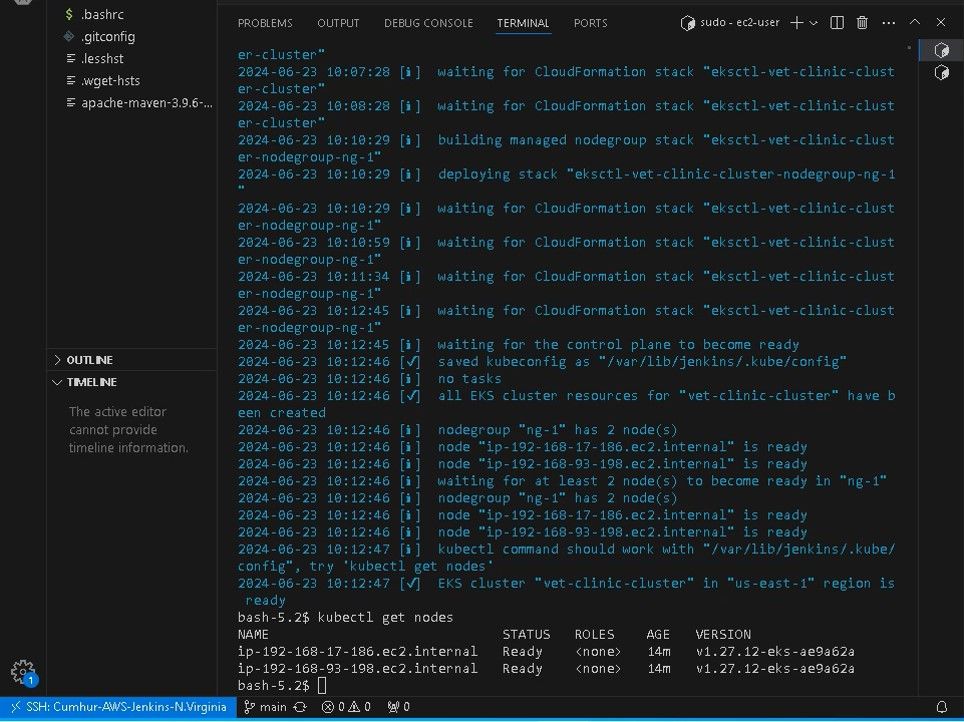
Create your Amazon EKS cluster and worker nodes with the following eksctl commands. Cluster provisioning usually takes between 15 and 20 minutes, as shown in the figures below.
eksctl create cluster -f cluster.yaml
Note: If you create a cluster with eksctl, by default eksctl creates a role for you. If you don’t use eksctl, you have to create an Amazon EKS cluster IAM role(7).
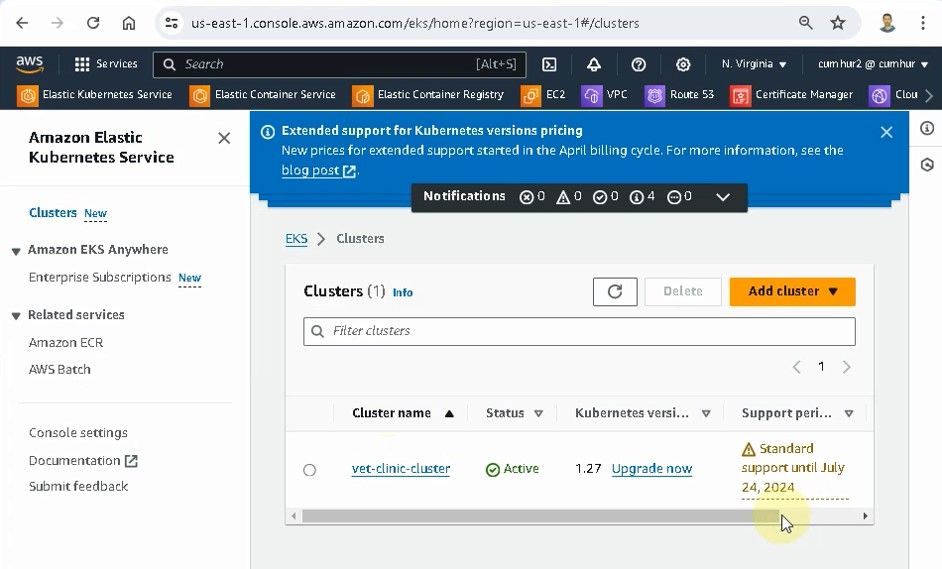
We can also check that our cluster was created with the name we gave in the Amazon EKS>Clusters menu, as shown in the figure below.
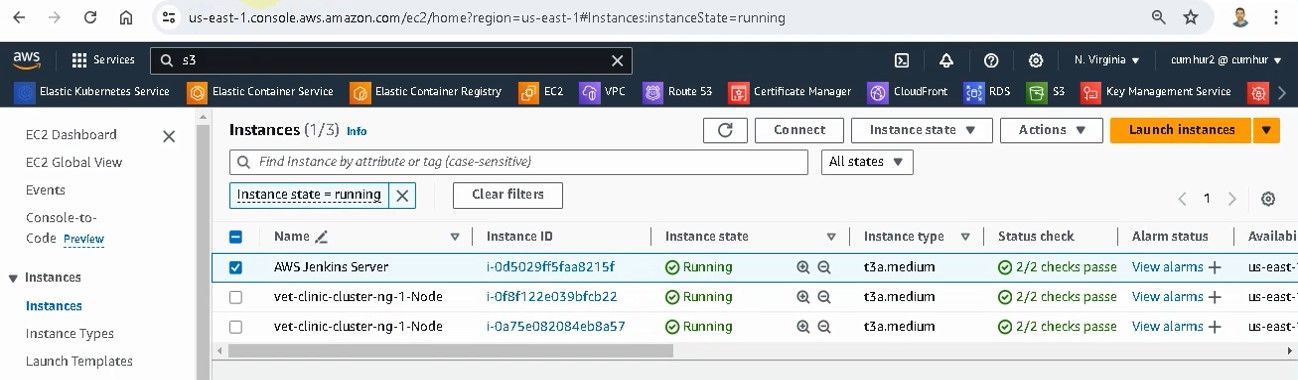
In addition, we can check that our nodes were created with the name we gave in the EC2>Instances menu, as shown in the figure below.
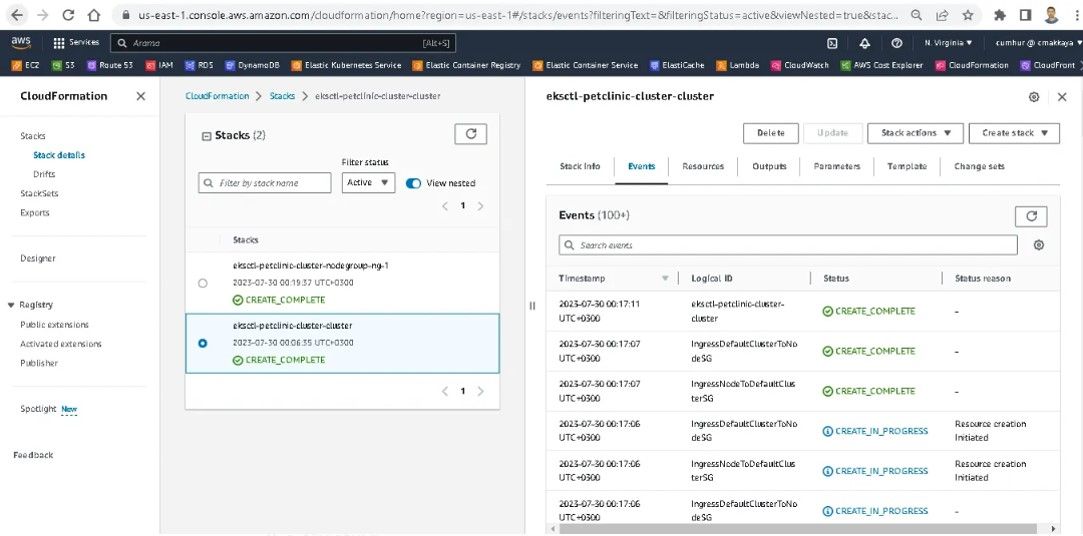
The eksctl command we entered runs two Cloudformation templates to set up the AWS EKS cluster in the background, it takes between 15 and 20 minutes for them to create the cluster, as shown in the figure below.
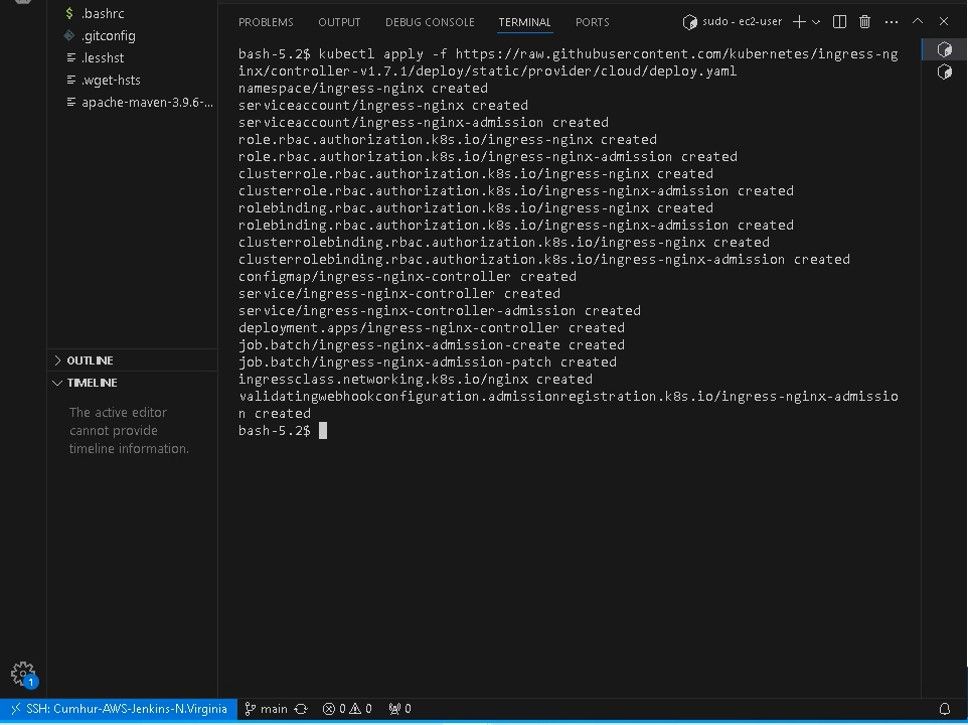
3.4. Creating ingress controller
The Ingress Controller is responsible for creating an entry point to the cluster so that Ingress rules can route traffic to the defined Services.
Run the following command to install the ingress controller, as shown in the figure below.
kubectl apply -f https://raw.githubusercontent.com/kubernetes/ingress-nginx/controller-v1.7.1/deploy/static/provider/cloud/deploy.yaml
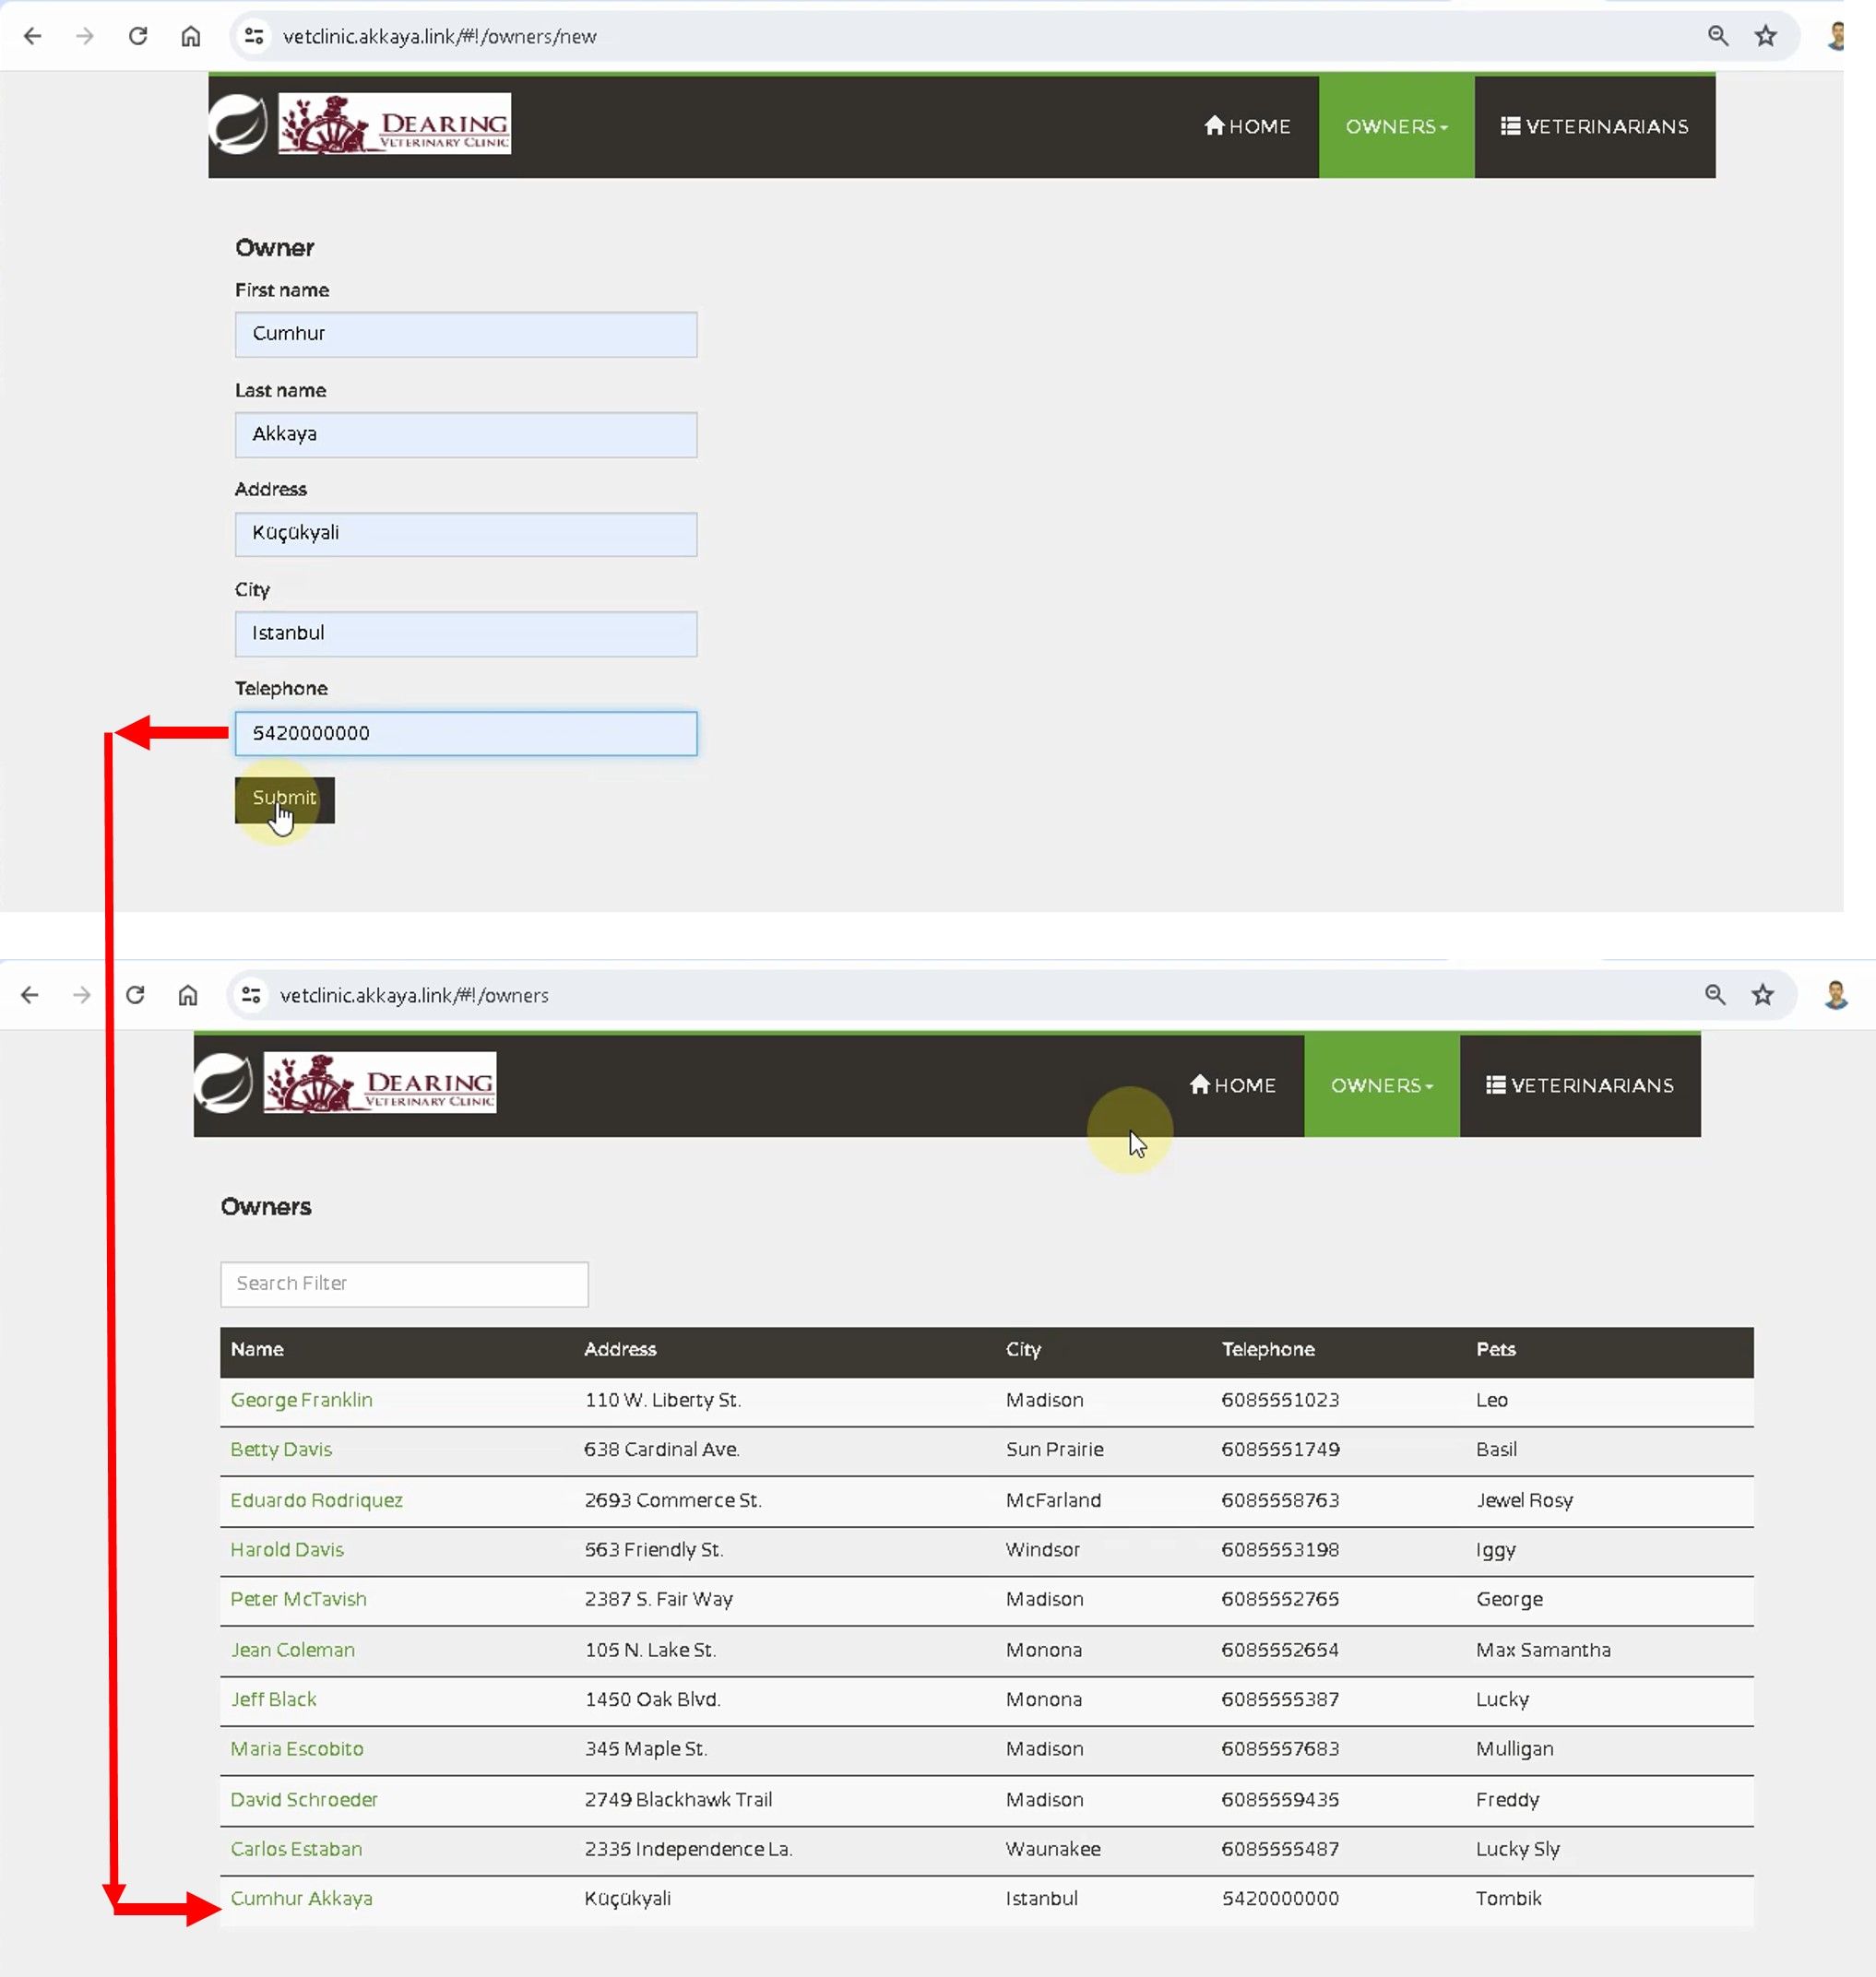
4. Creating a GitHub Repository for Source Code Management
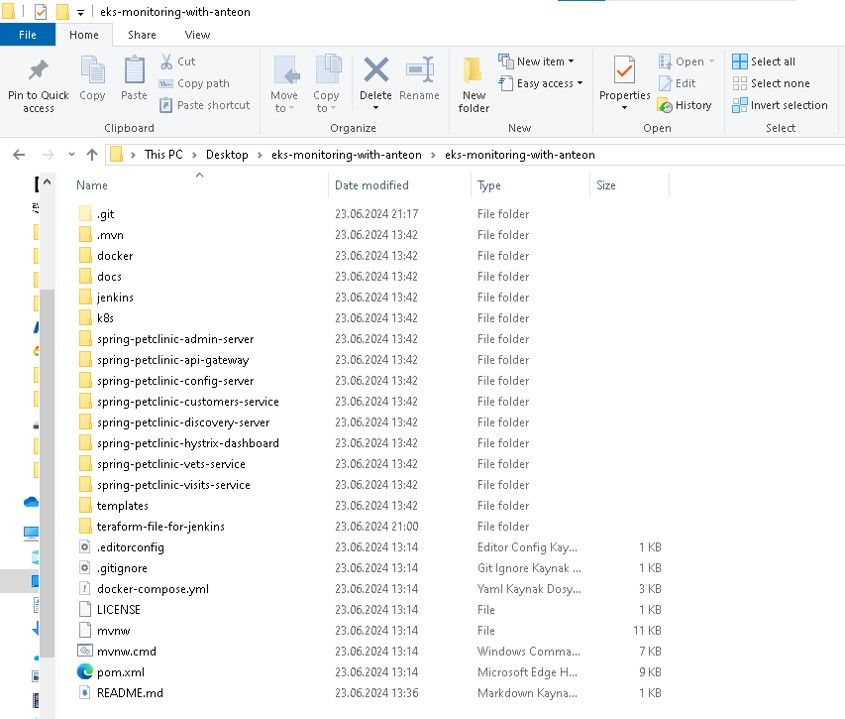
Firstly, download the source code files from my GitHub repo or Anteon GitHub repo into your local disk, as shown in the figures below.
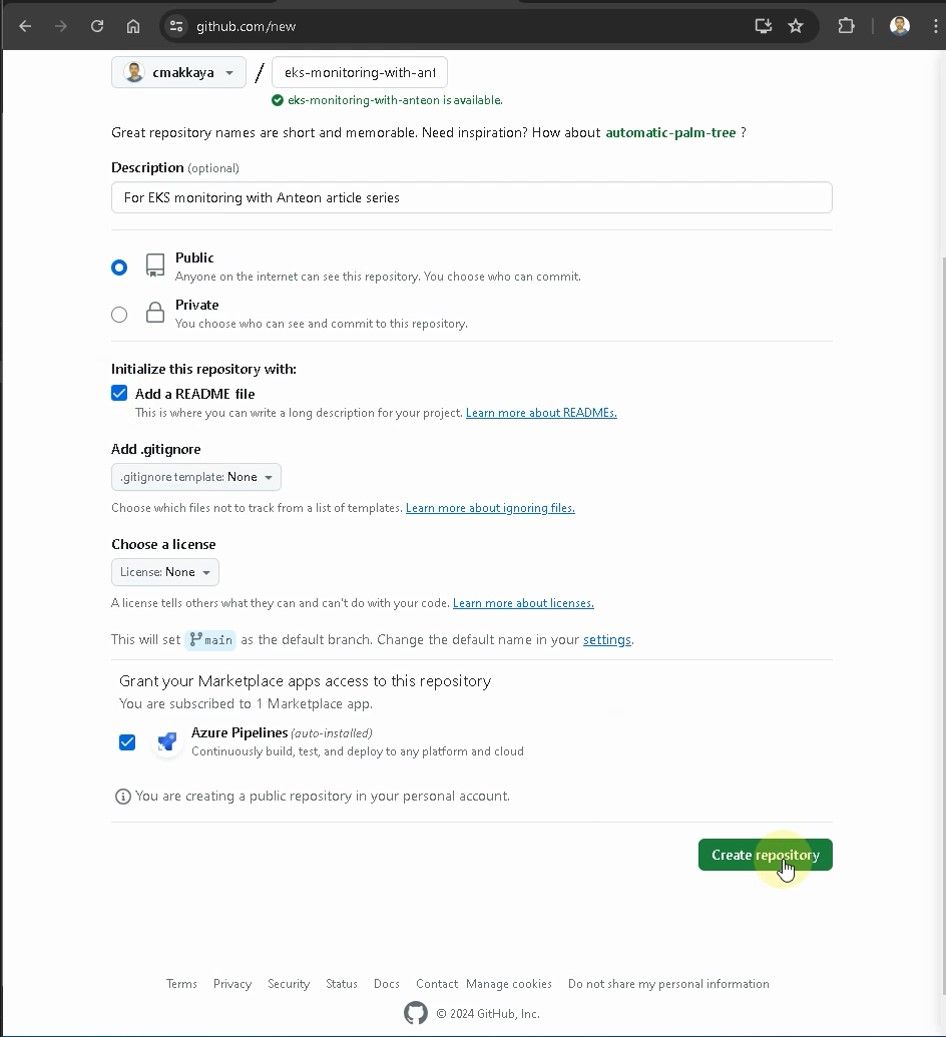
Then, create an empty GitHub repository, and send the source code files into it, as shown in the figures below. We’ll use the main branch.
Note: For more detailed information about creating a repository on GitHub, you can see this link.
Push downloaded files (scripts, yaml files, etc) to your remote GitHub repo by running the commands below, as shown in the figures below.
git add .
git commit -m 'added scripts, yaml files for CI/CD pipeline'
git push
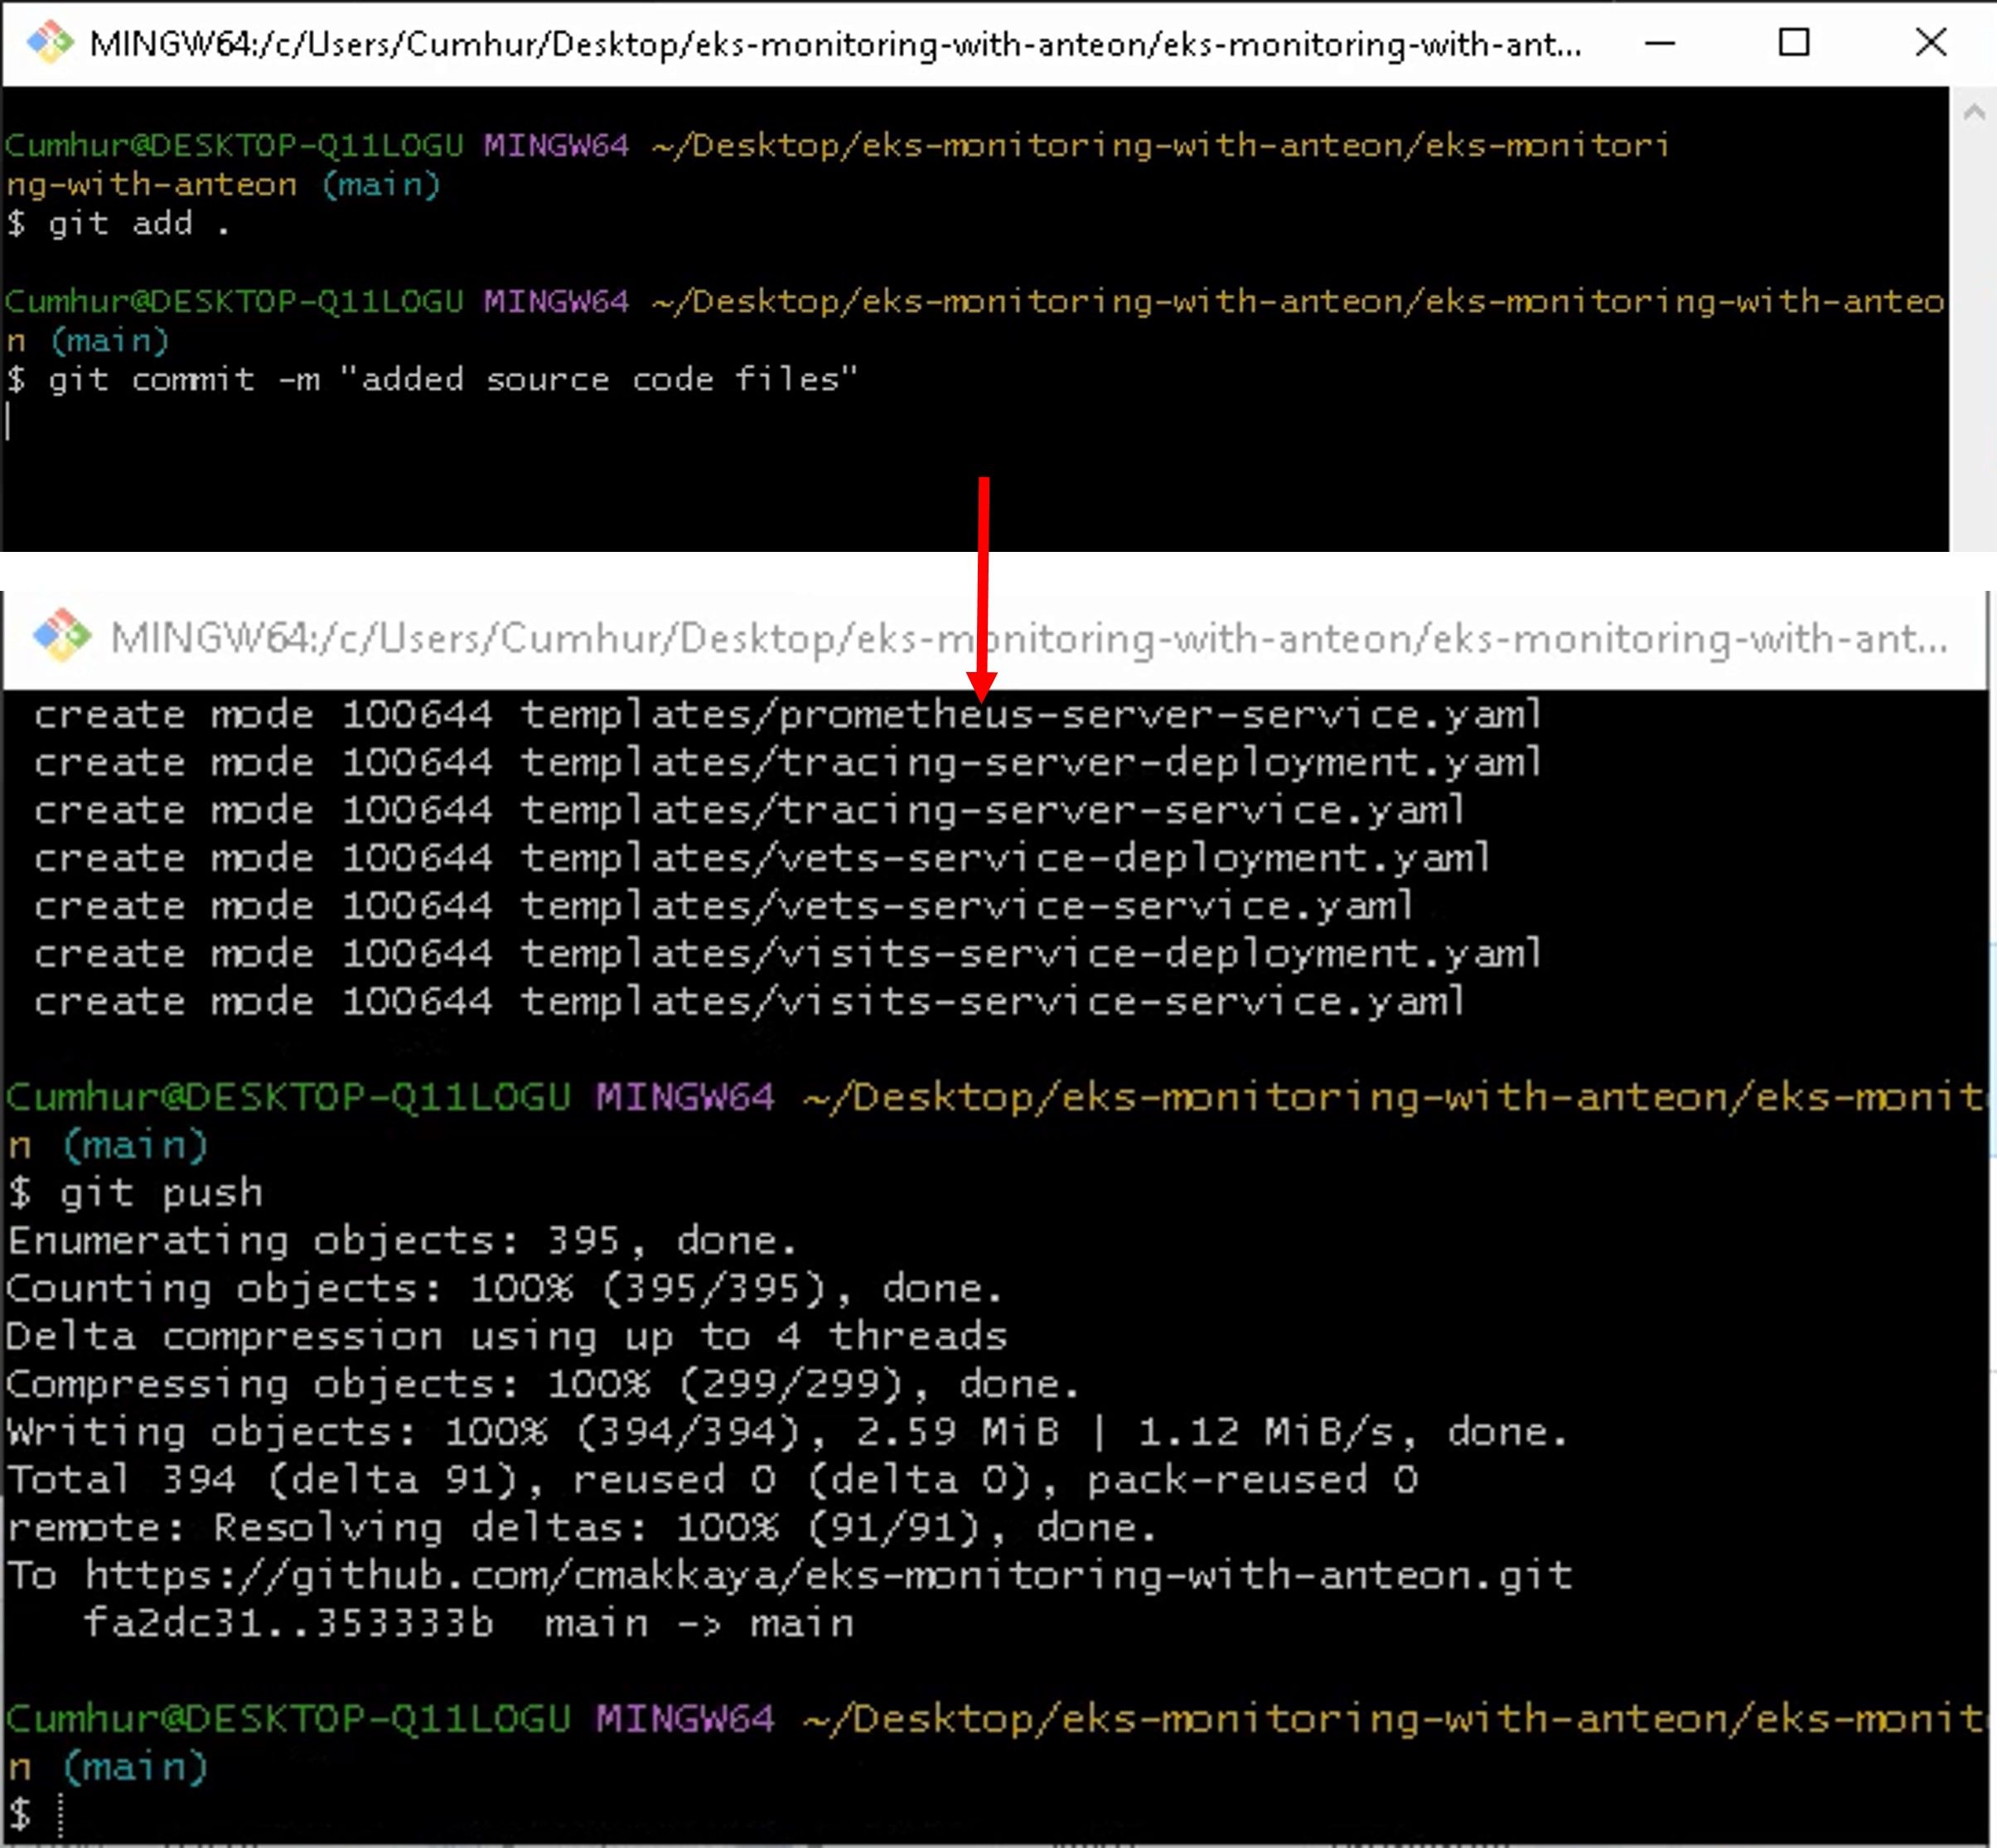
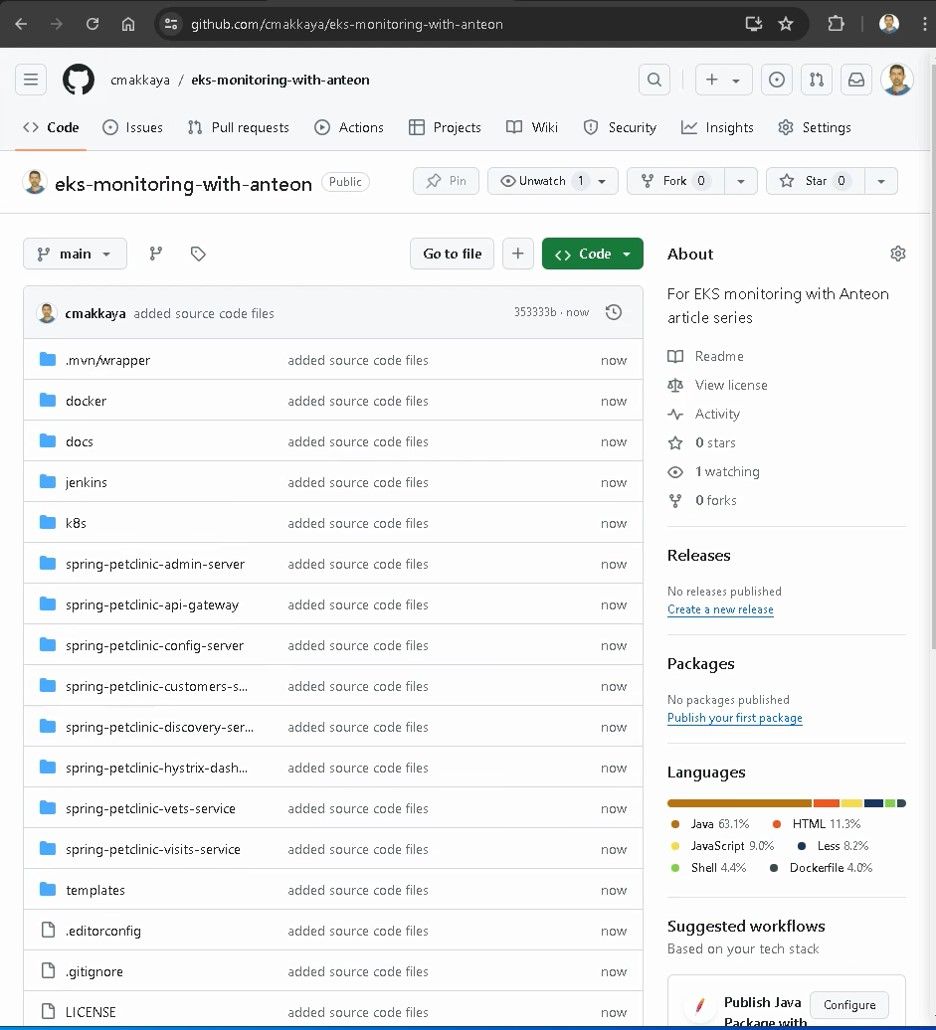
Check that your files have arrived in your GitHub repository.
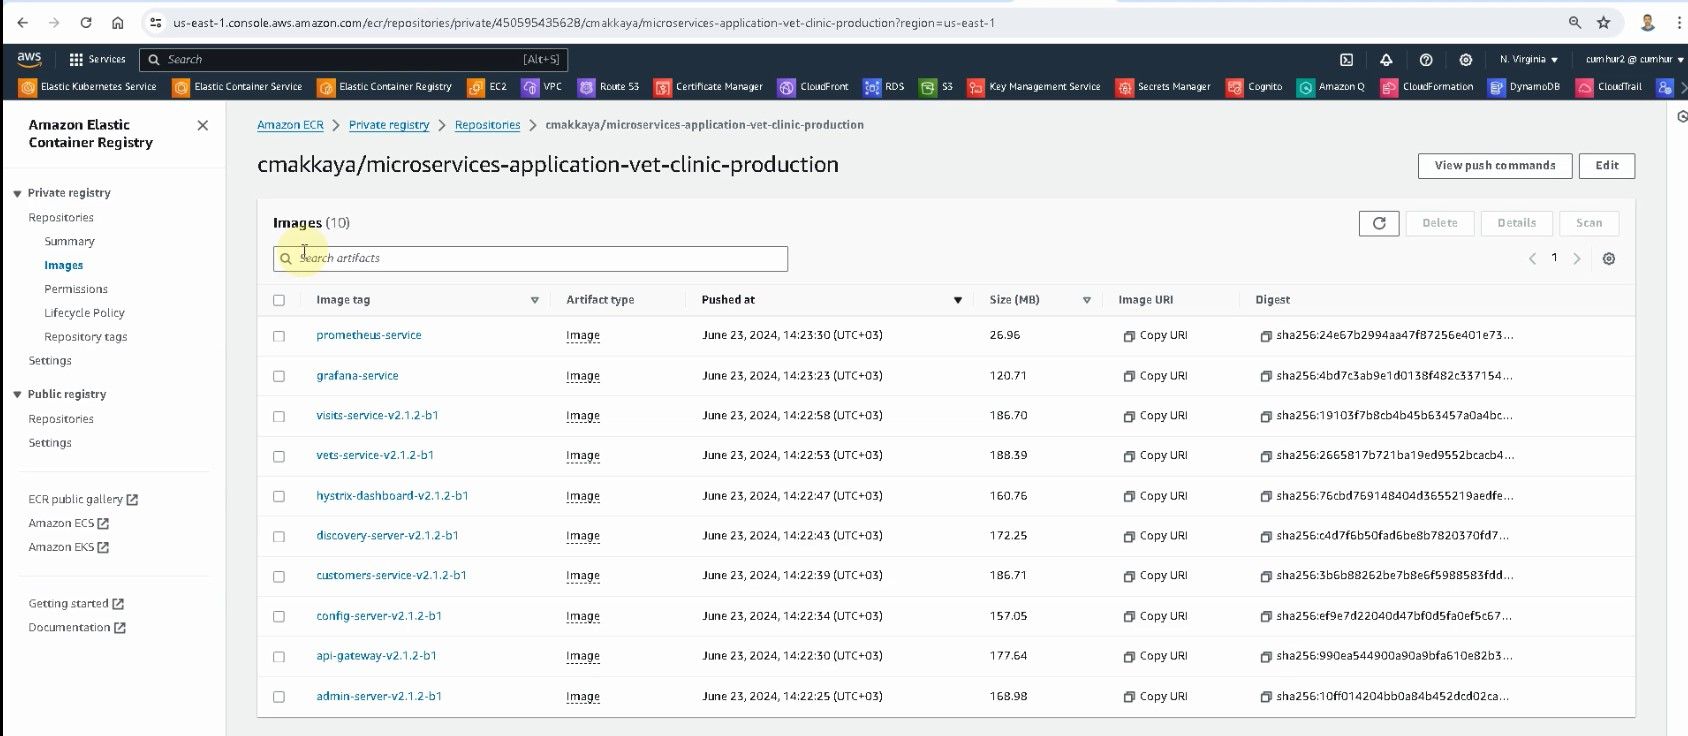
5. Creating an Amazon ECR Repository for Artifact
We’ll create an Amazon ECR private repository, and then use the repository to store our docker container images(8).
Open the Amazon ECR console, and from the navigation bar, choose the Region to create your repository in (mine is N.Virgina). On the Repositories page, click on the Create repository button, and then enter the values given below, as shown in the figures below. After entering the given values, click on the Create repository button.
For Visibility settings: verify that Private is selected.
For Repository name: enter a unique name for your repository. I entered "microservices-application-vet-clinic-production" name.
For Tag immutability: Disabled (Enable tag immutability to prevent image tags from being overwritten by subsequent image pushes using the same tag. Disable tag immutability to allow image tags to be overwritten.)
For Scan on push: on push
For KMS encryption: Disabled
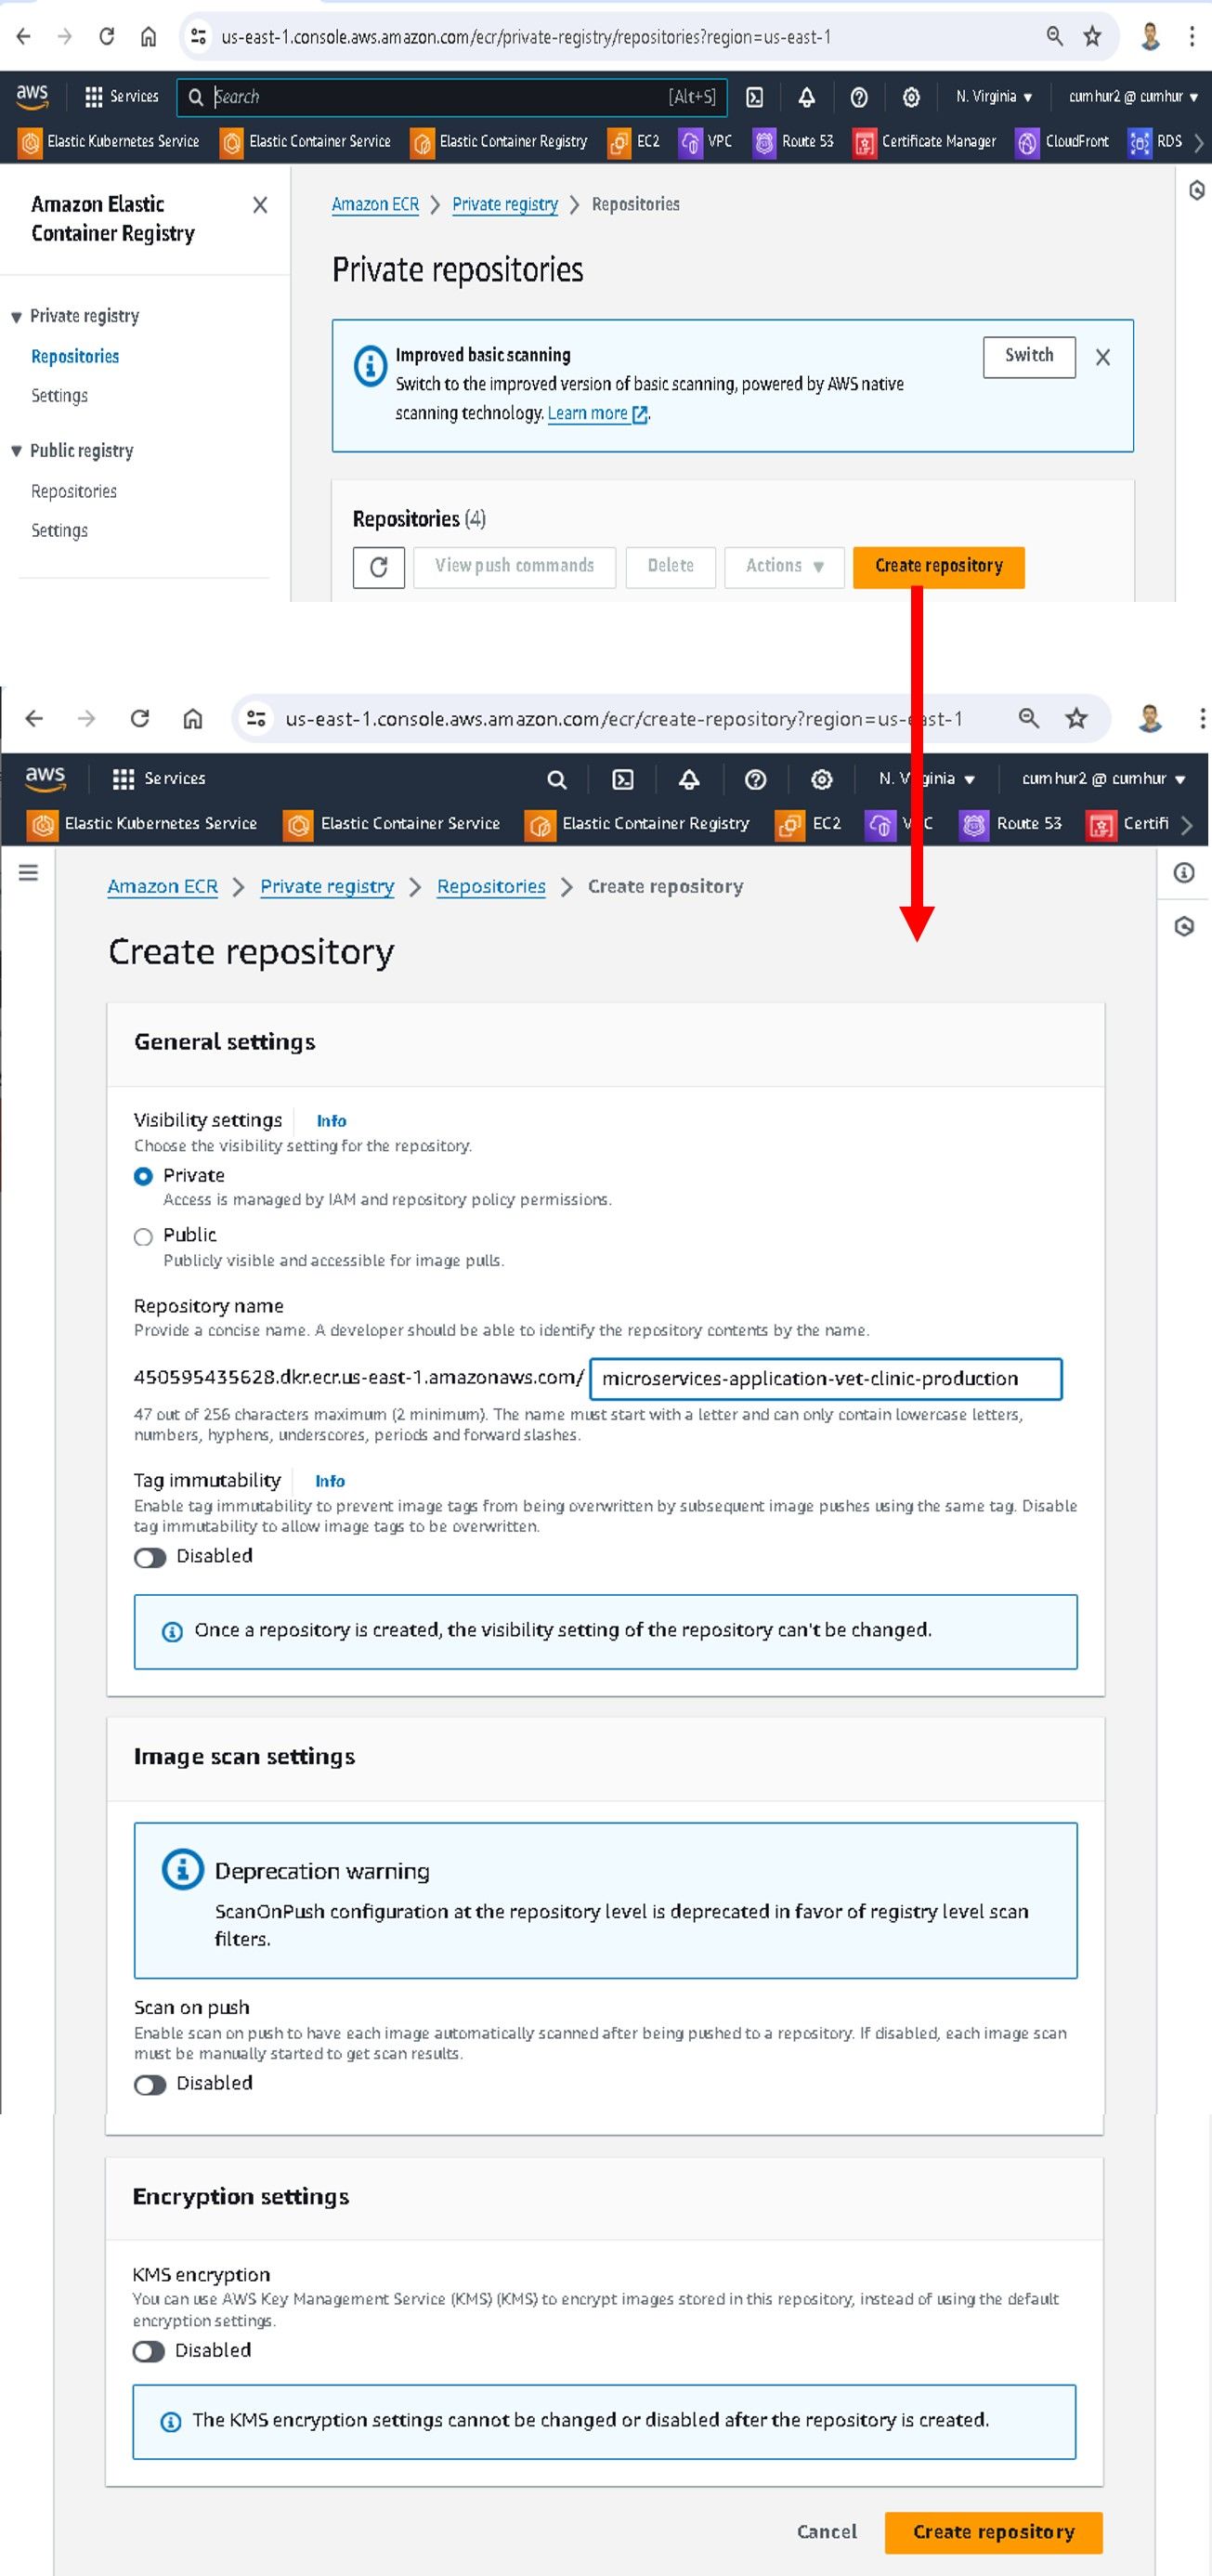
We created an Amazon ECR private repository, as shown in the figures below.
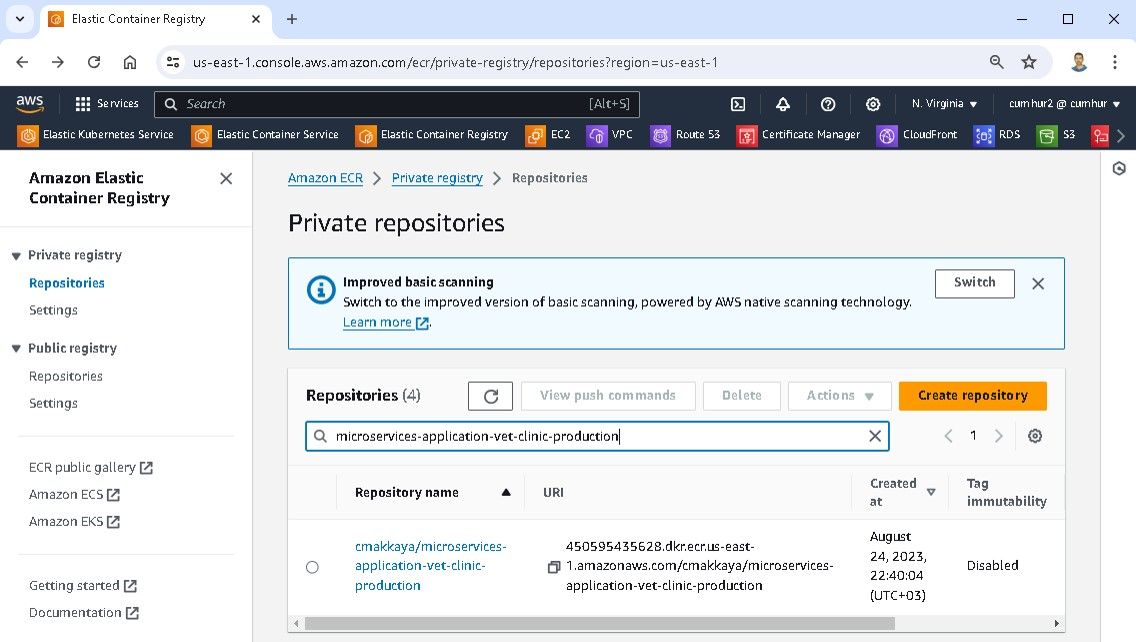
In item 7, we'll replace the Amazon ECR Repository names in the jenkinsfile-microservice-app-production script file with your creation, as shown in the figure below.
6. Creating Amazon S3 Bucket
Create an S3 bucket to store Helm charts.
Go to https://console.aws.amazon.com/s3/, and click on the Create bucket button, as shown in the figure below. Don't forget to check your region, it must be the us-east-1 AWS region.
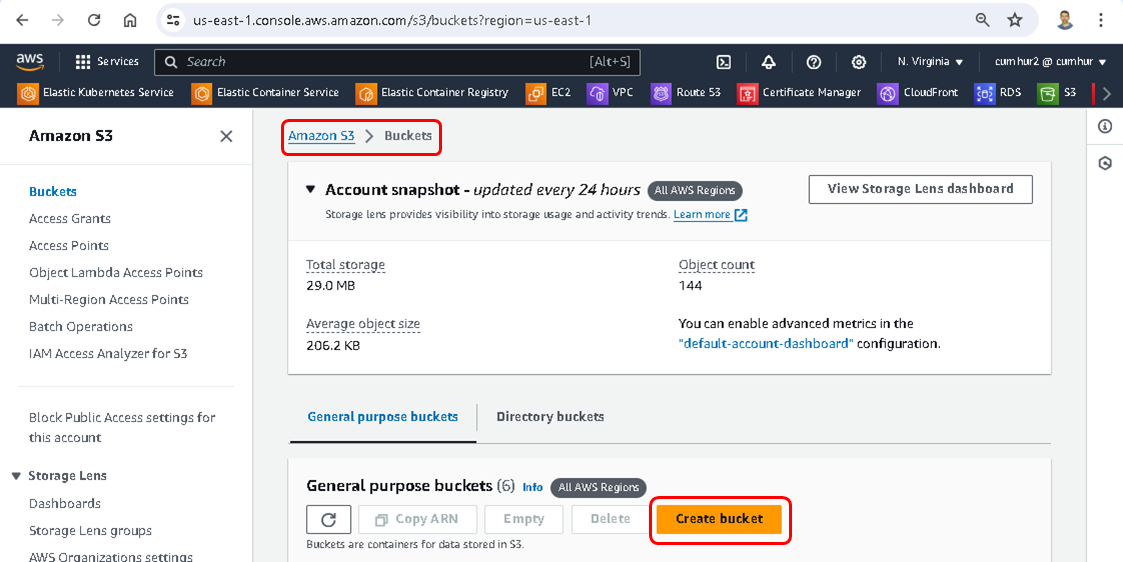
The Create Bucket page opens. For bucket name, enter a name for your bucket. Click on the Create bucket button, leaving the other values as default.
Then, open the bucket, and click on the Create folder button. Create a folder called stable/myapp, as shown in the figure below.
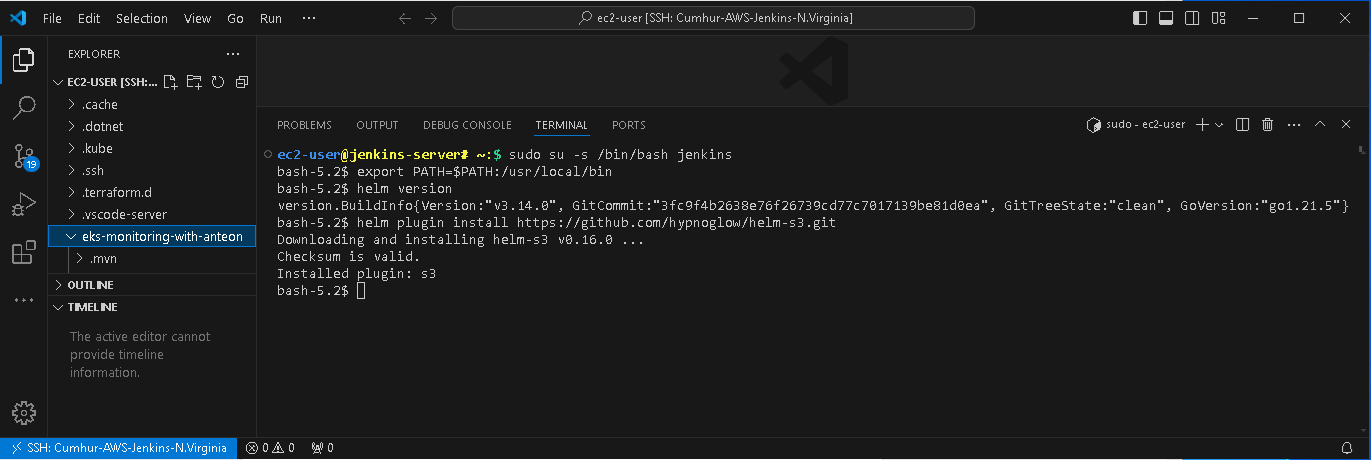
In item 7, we'll enter the bucket name you created into the relevant place in the deploy_app_on_prod_environment.sh script file, as shown in the picture below.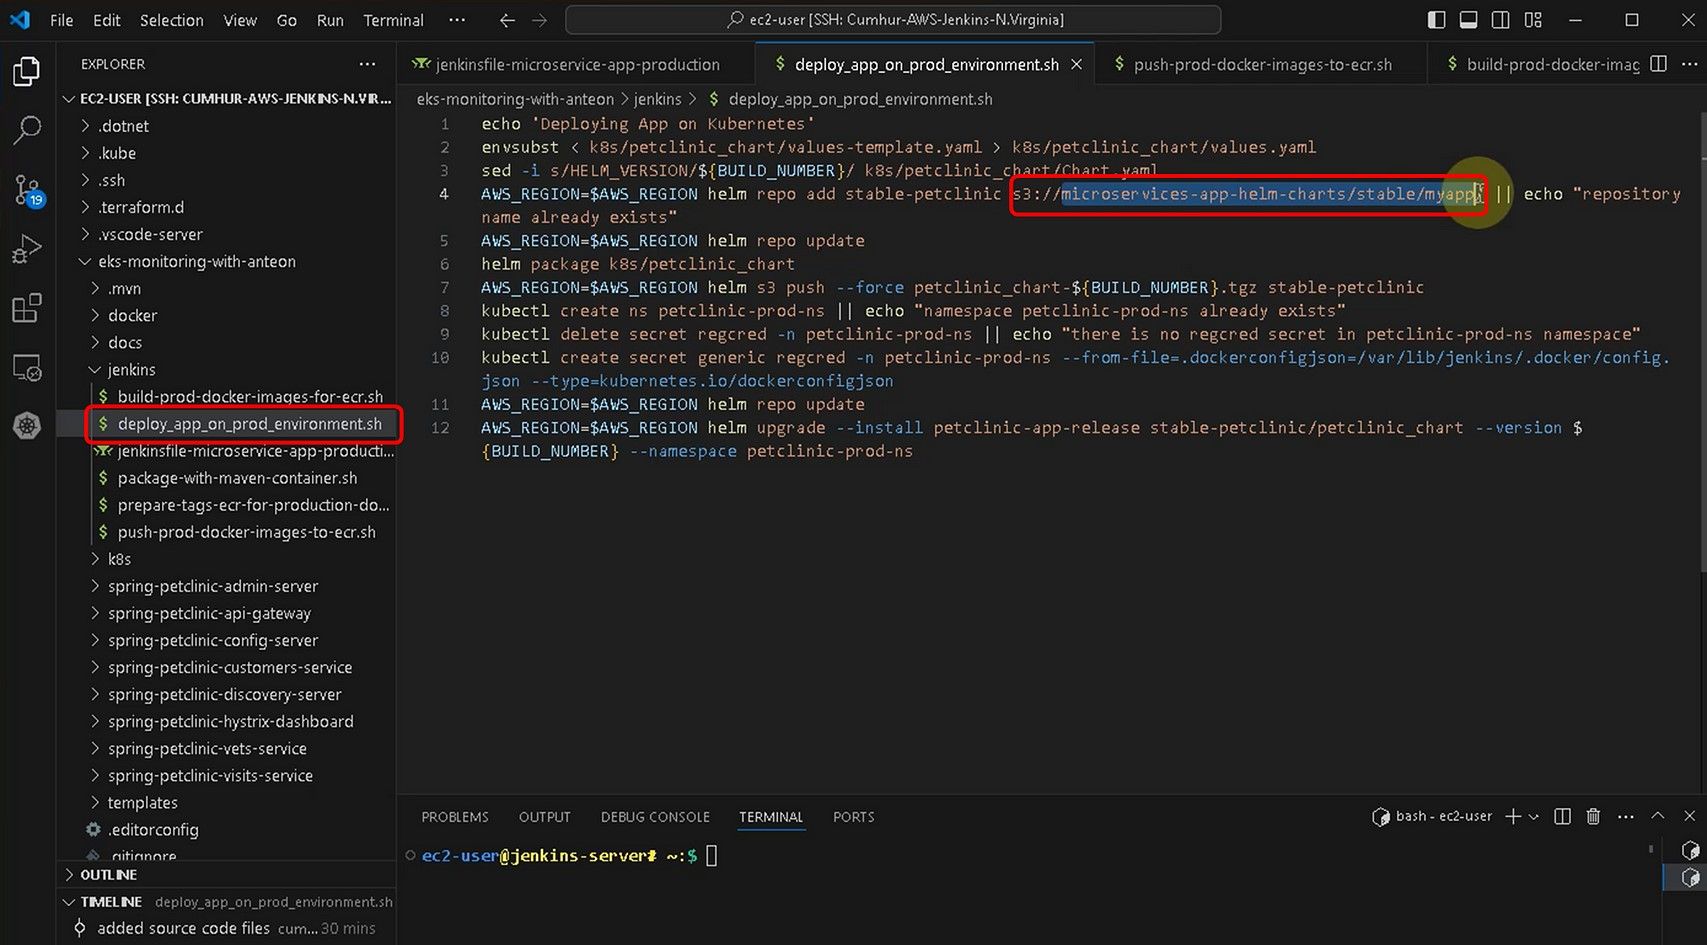 Install the helm-s3 plugin for Amazon S3 with the following commands, as shown in the figure below.
sudo su -s /bin/bash jenkins # You must use "jenkins" user.
export PATH=$PATH:/usr/local/bin
helm version
helm plugin install https://github.com/hypnoglow/helm-s3.git
7. Installing and Integrating the Amazon RDS MySql Database for Customer Records into the Microservices App
Amazon Relational Database Service (Amazon RDS) is a web service that makes it easier to set up, operate, and scale a relational database in the AWS Cloud.
Sign in to the AWS Management Console and open the Amazon RDS console at https://console.aws.amazon.com/rds/. In the upper-right corner of the Amazon RDS console, choose the AWS Region in which you want to create the DB instance. In the navigation pane, choose Databases, and then choose Create database, as shown in the figure below.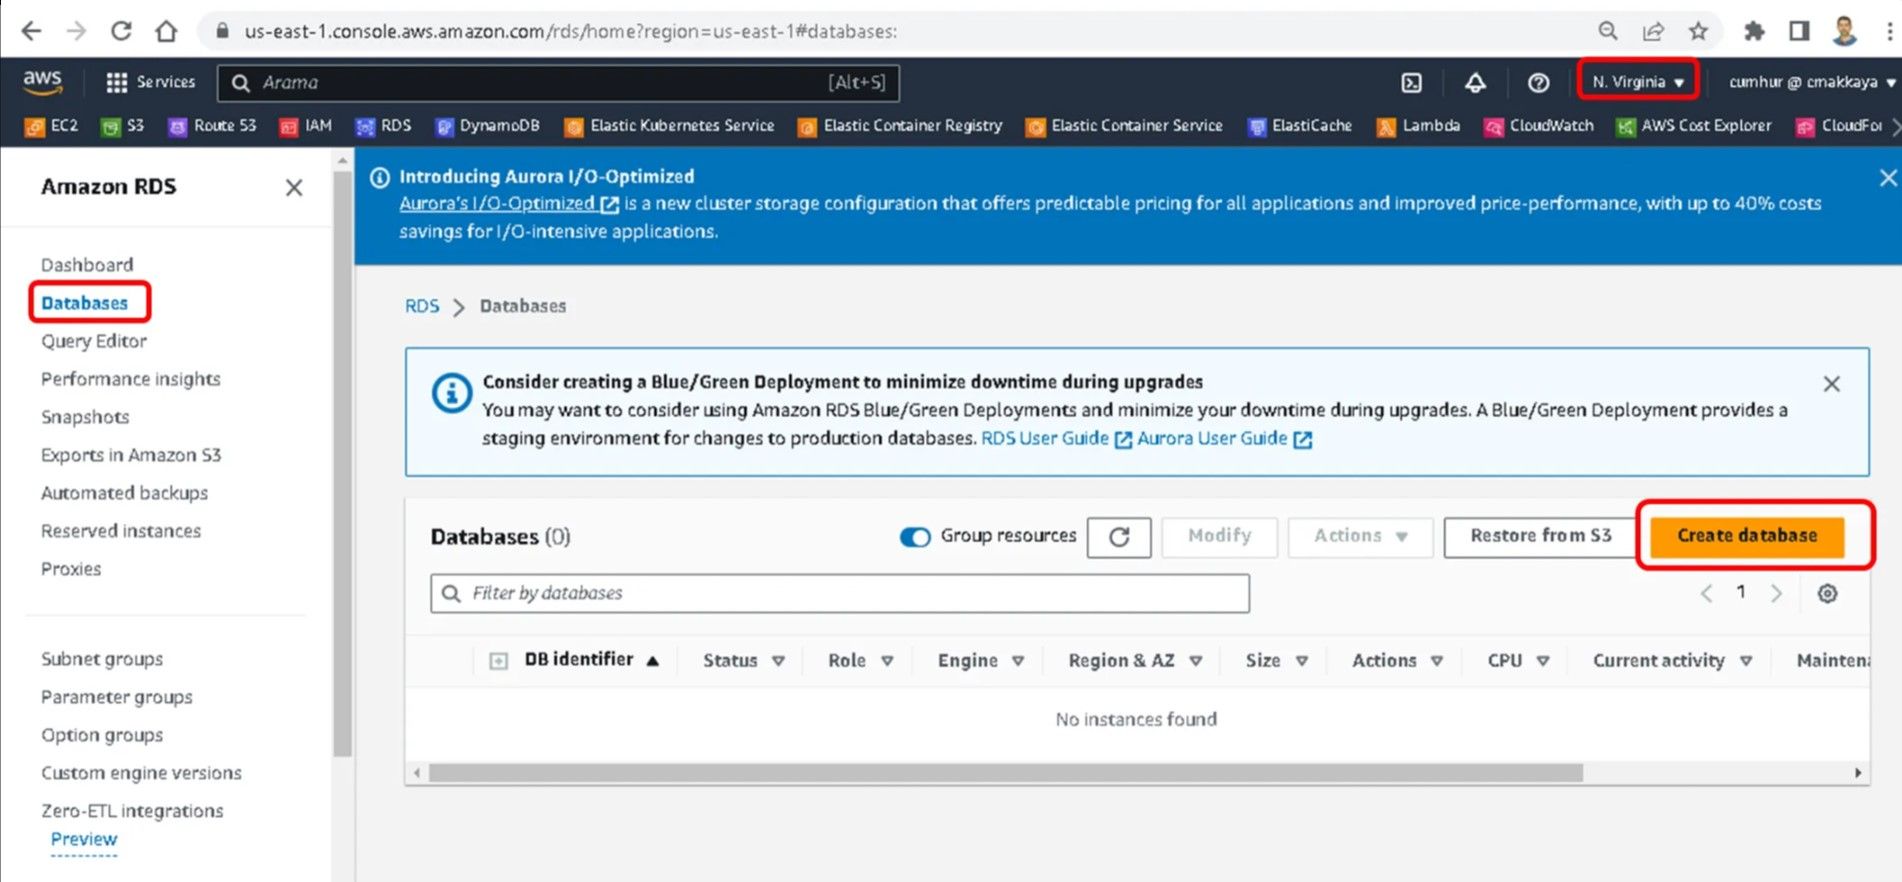
Create a database with the following values and steps. Leave other values as default.
Engine options: MySQL
  - Version : 5.0.39
  - Templates: Free tier
  - DB instance identifier: petclinic
  - Master username: root
  - Master password: petclinic
  - Public access: Yes
  - Initial database name: petclinic
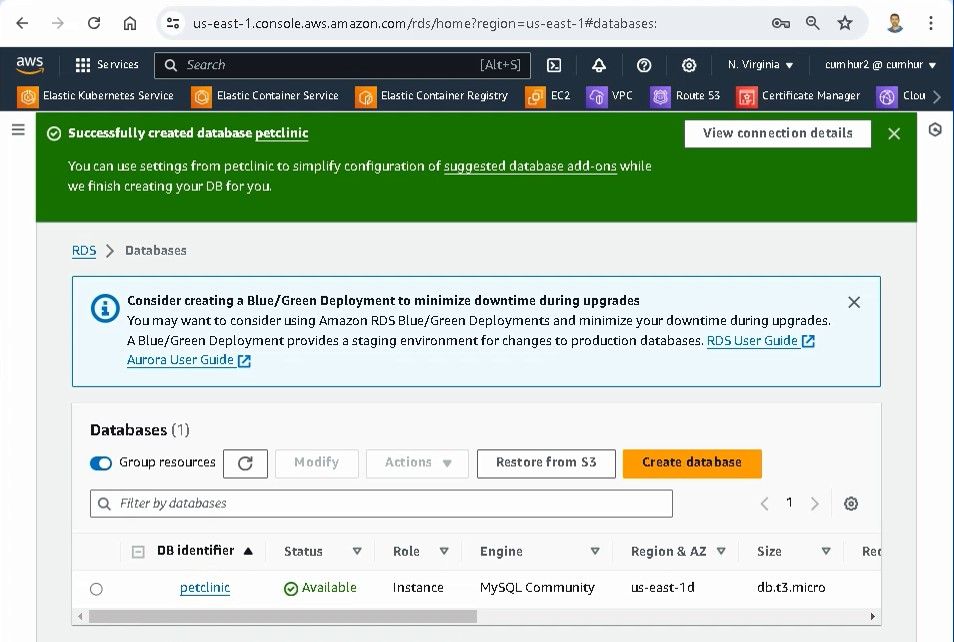
Our database is set up in a few minutes, and it becomes Available, as shown in the figure below.
Copy RDS database endpoint values in the figure below.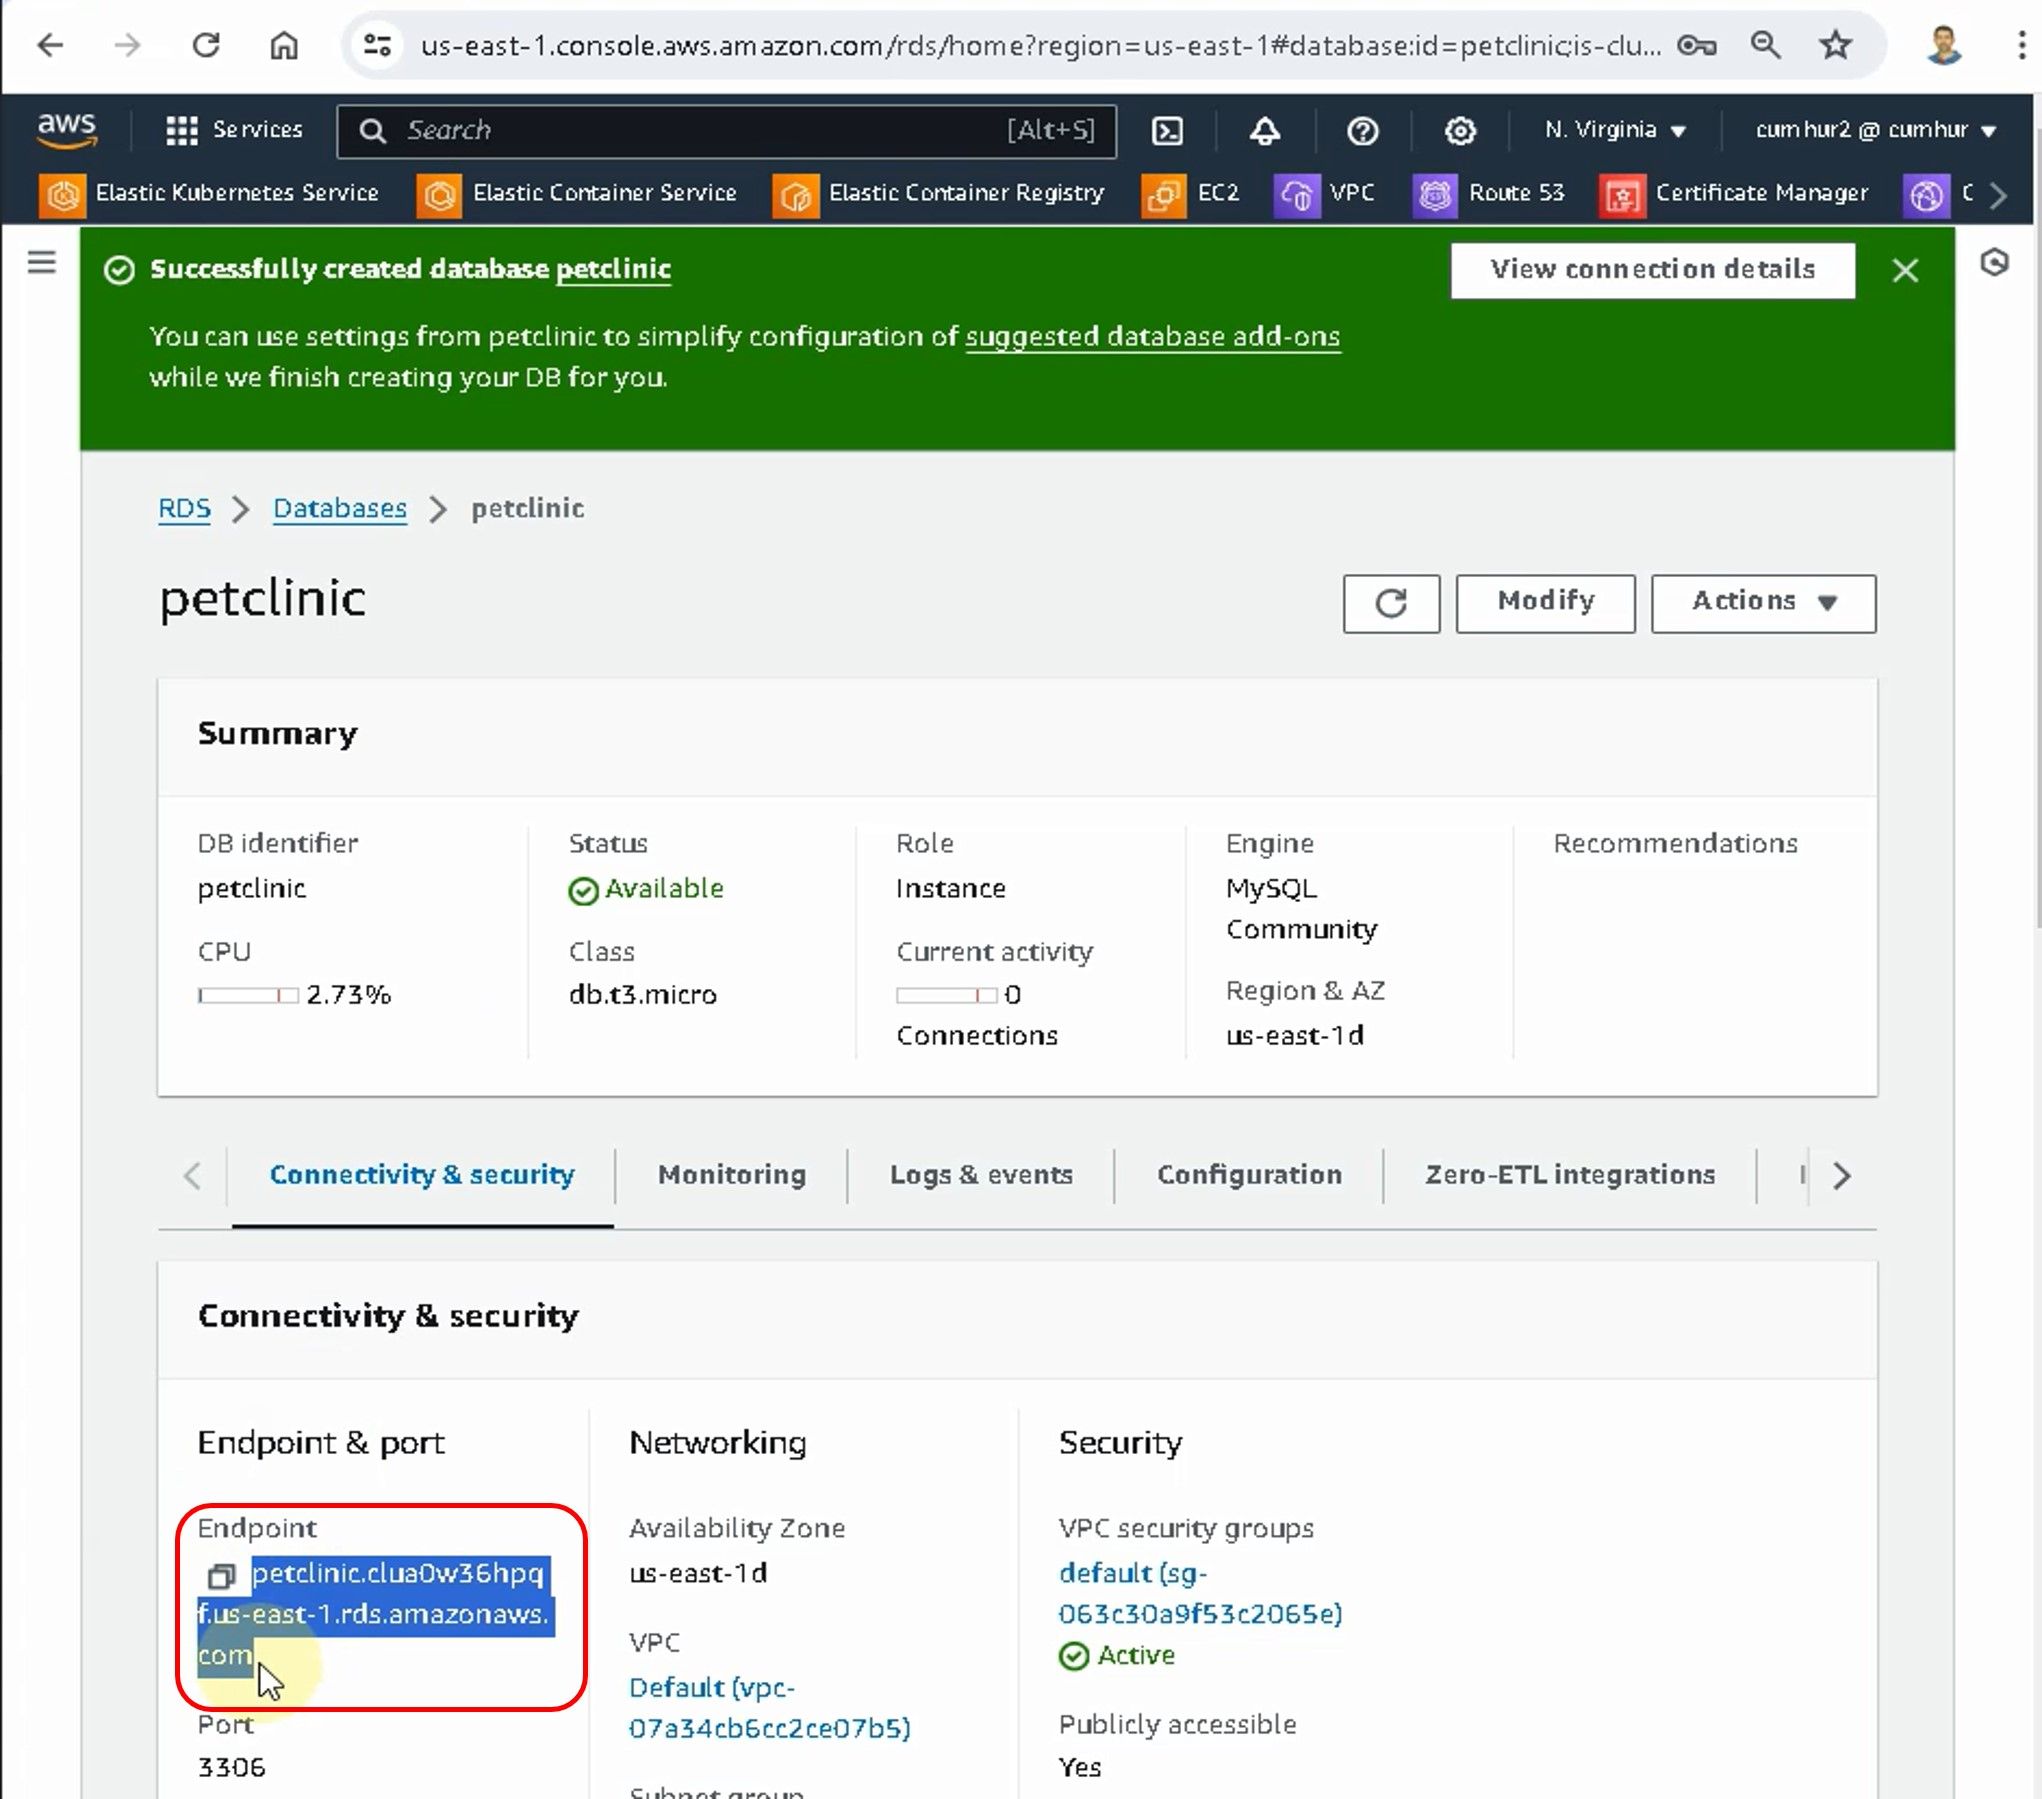
Update k8s/petclinic_chart/templates/mysql-server-service.yaml with the endpoint values, as shown in the figure below.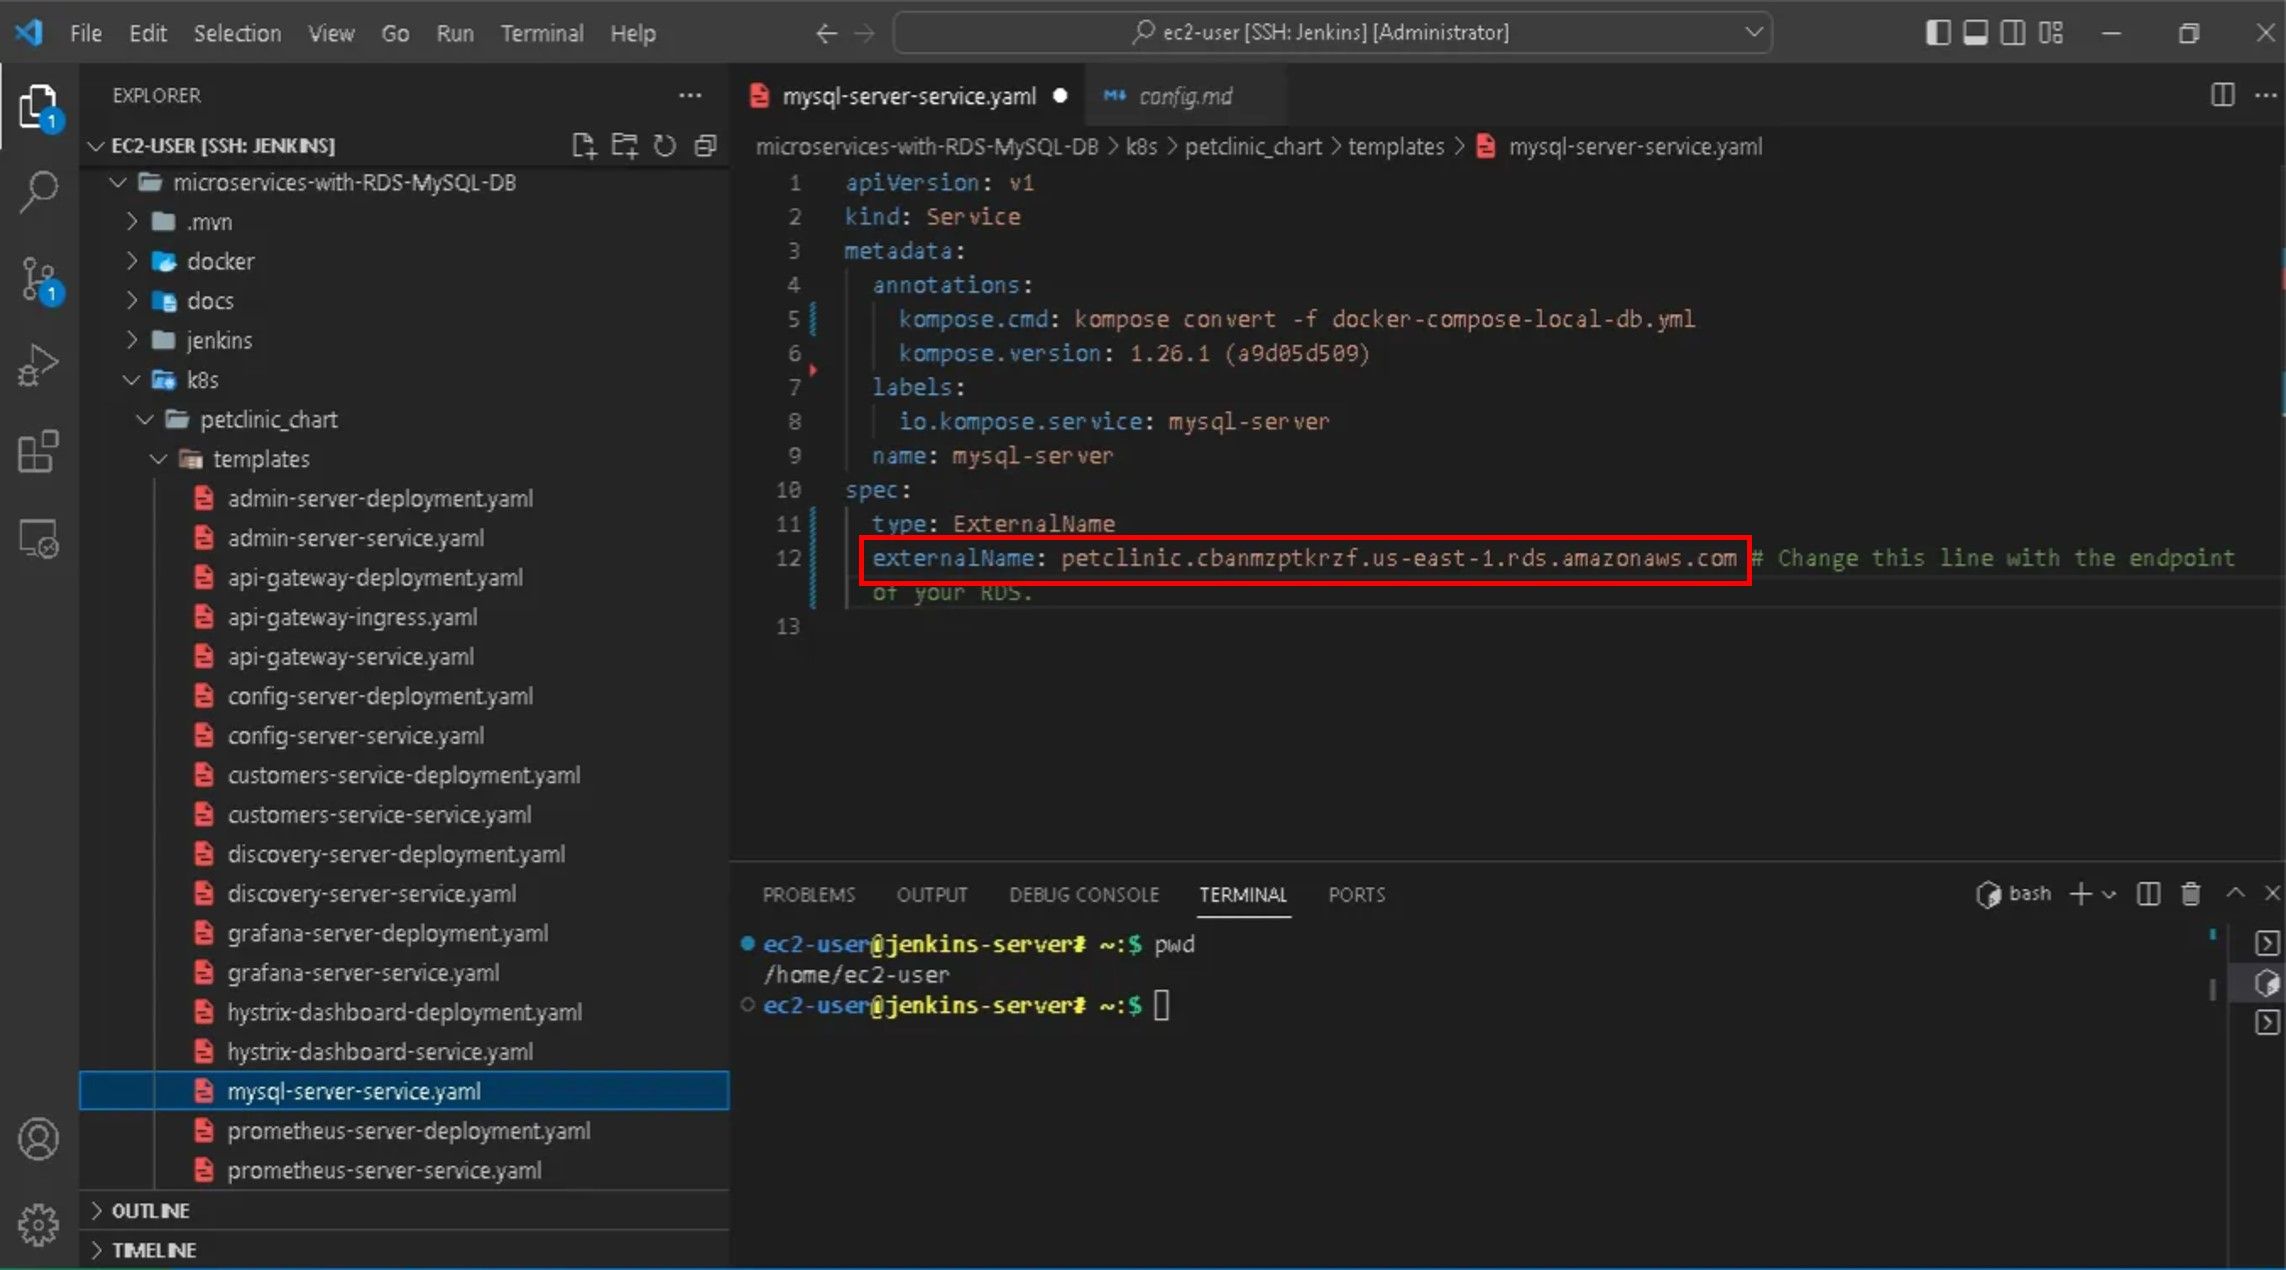
8. Preparing and Running The Jenkins File and CI/CD Pipeline for Kubernetes on AWS EKS
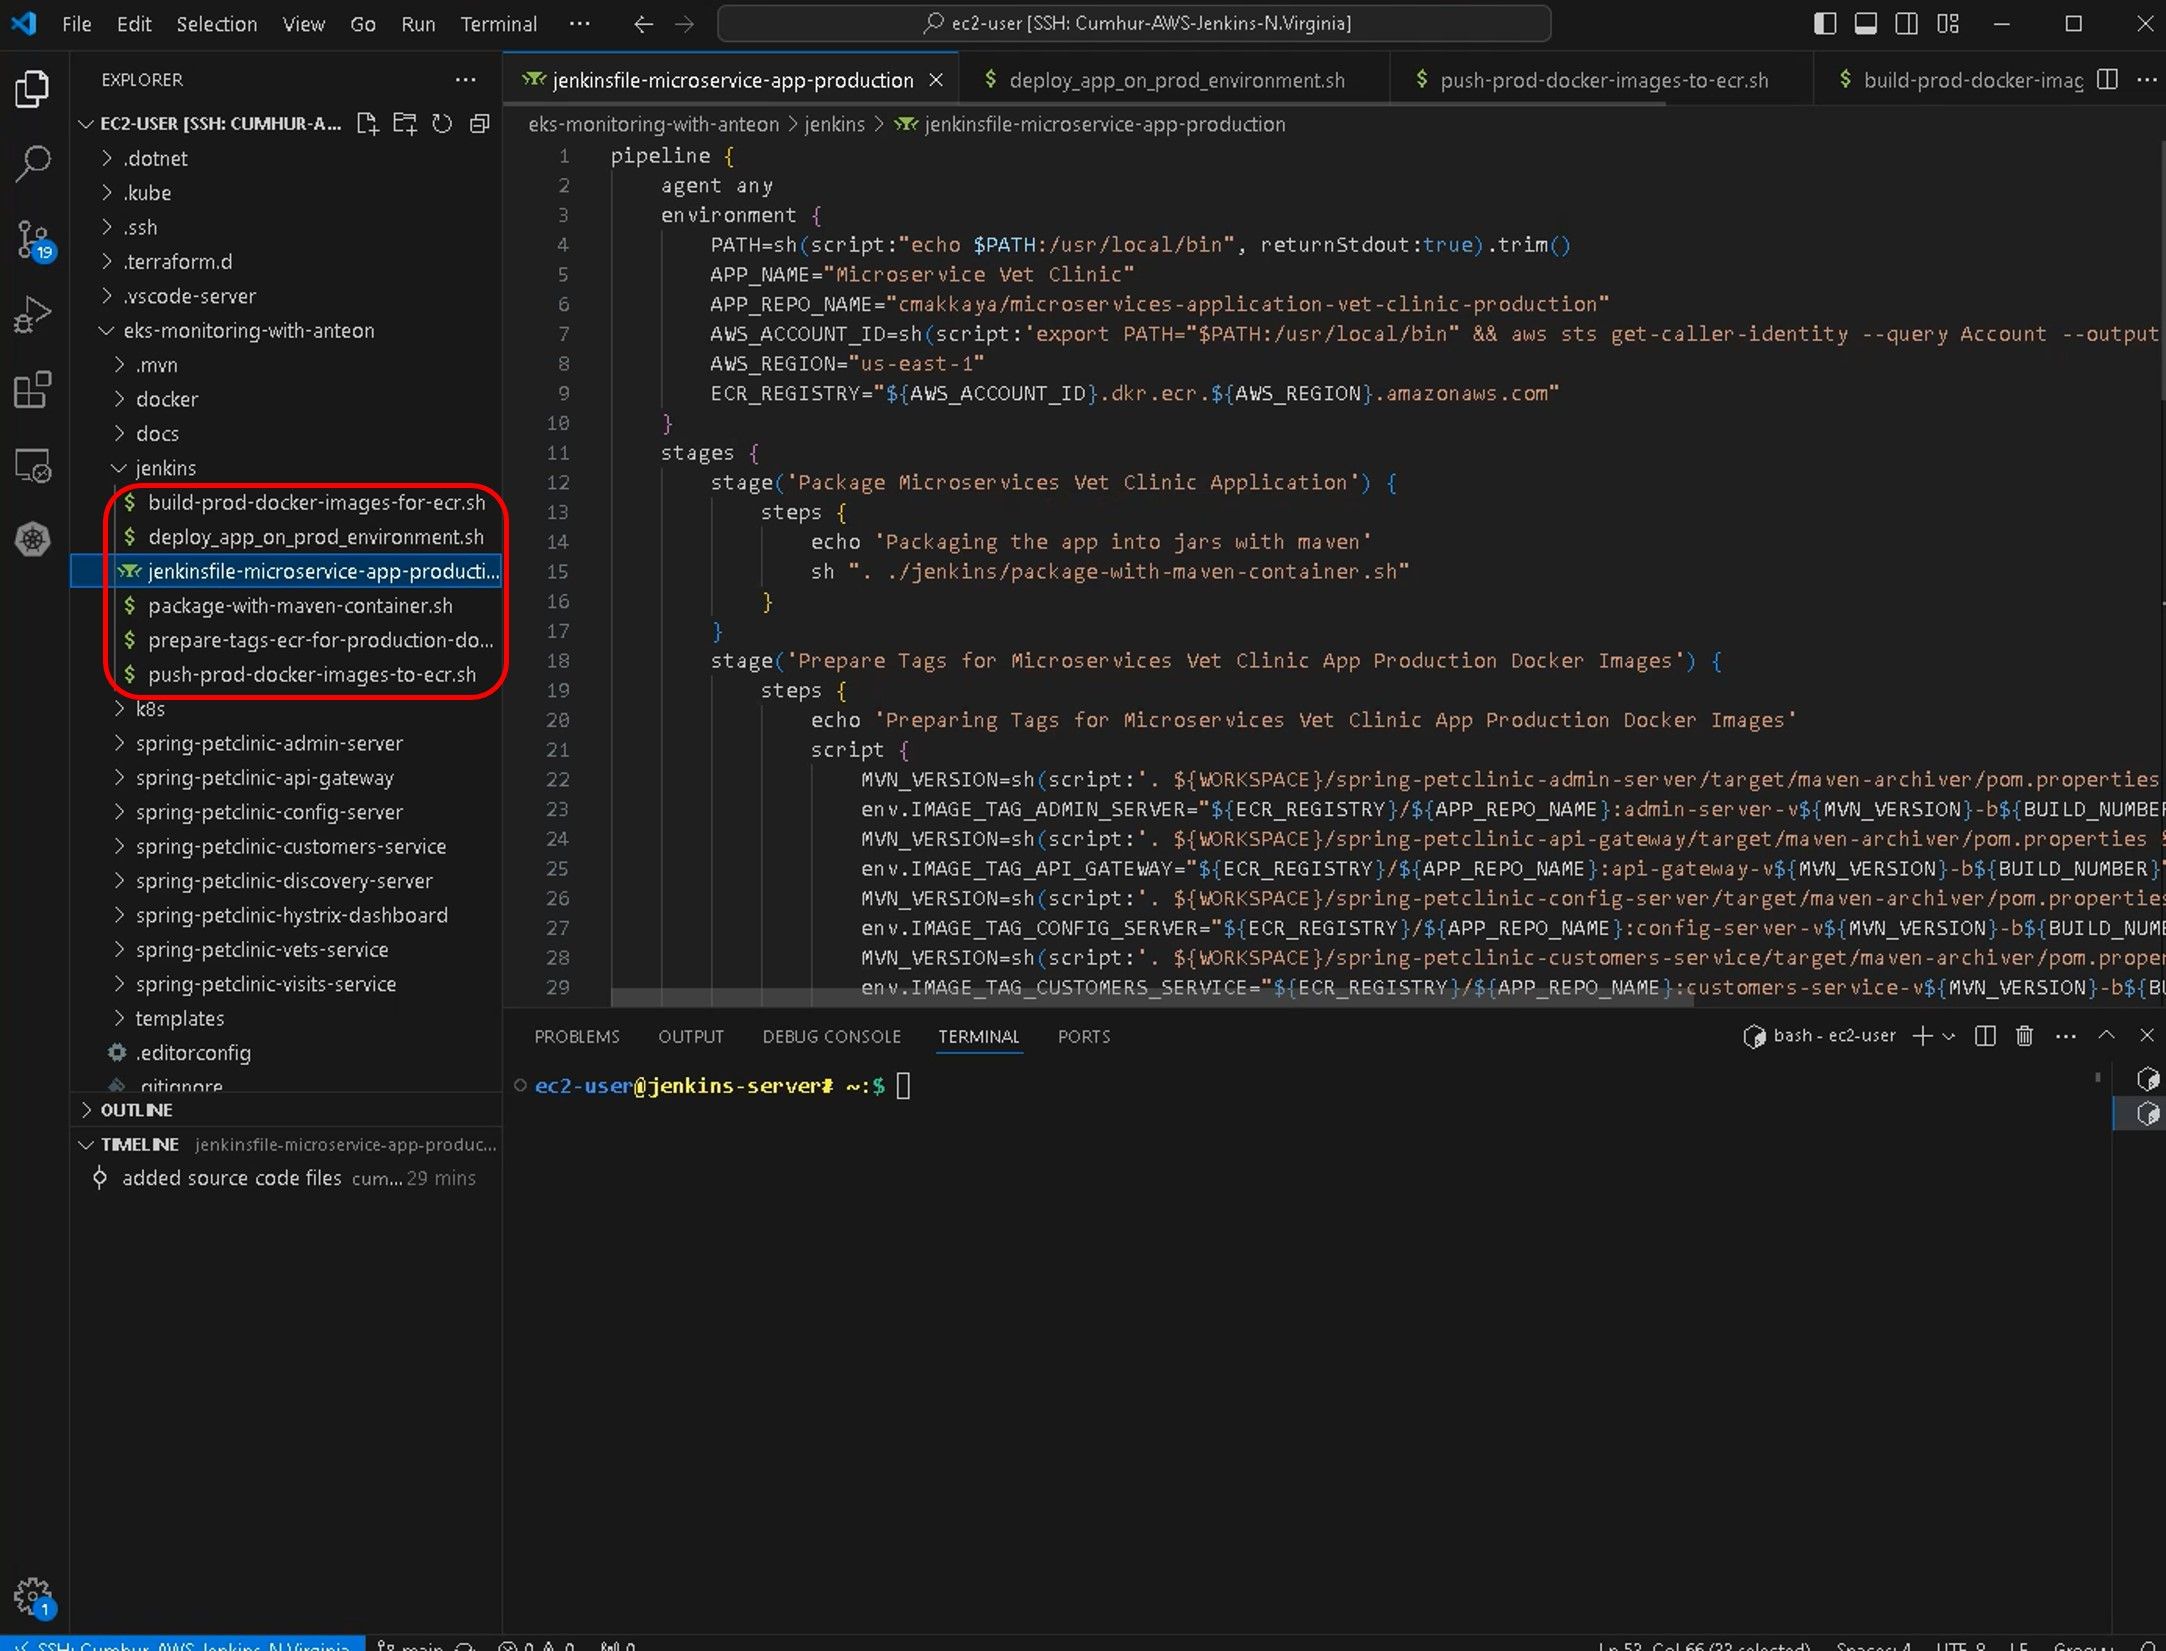
Scripts that will run in Jenkins Pipeline are located under the Jenkins folder, as shown in the figure below. All installations in Jenkins Pipeline will be made via these scripts.
The package-with-maven-container.sh script packages the microservice app with Maven, and creates .jar files from the Java source codes.
The prepare-tags-ecr-for-prod-docker-images.sh script creates ECR tags for the docker images.
The build-prod-docker-images-for-ecr.sh script builds the docker images using Docker files in the spring-petclinic… folders for the ECR registry and names them.
The push-prod-docker-images-to-ecr.sh script pushes the docker images to the ECR private repository.
The deploy_app_on_prod_environment.sh script deploys the microservice app into the Amazon EKS cluster using Helm.
Note: Don’t forget to replace the Amazon ECR Repository and Amazon S3 Bucket names in the scripts with your own creations.
Important Note: Before running Jenkins Pipeline, push again all changes we made to the GitHub repository with the following commands.
git add .
git commit -m 'added scripts, yaml files for Jenkins pipeline'
git push
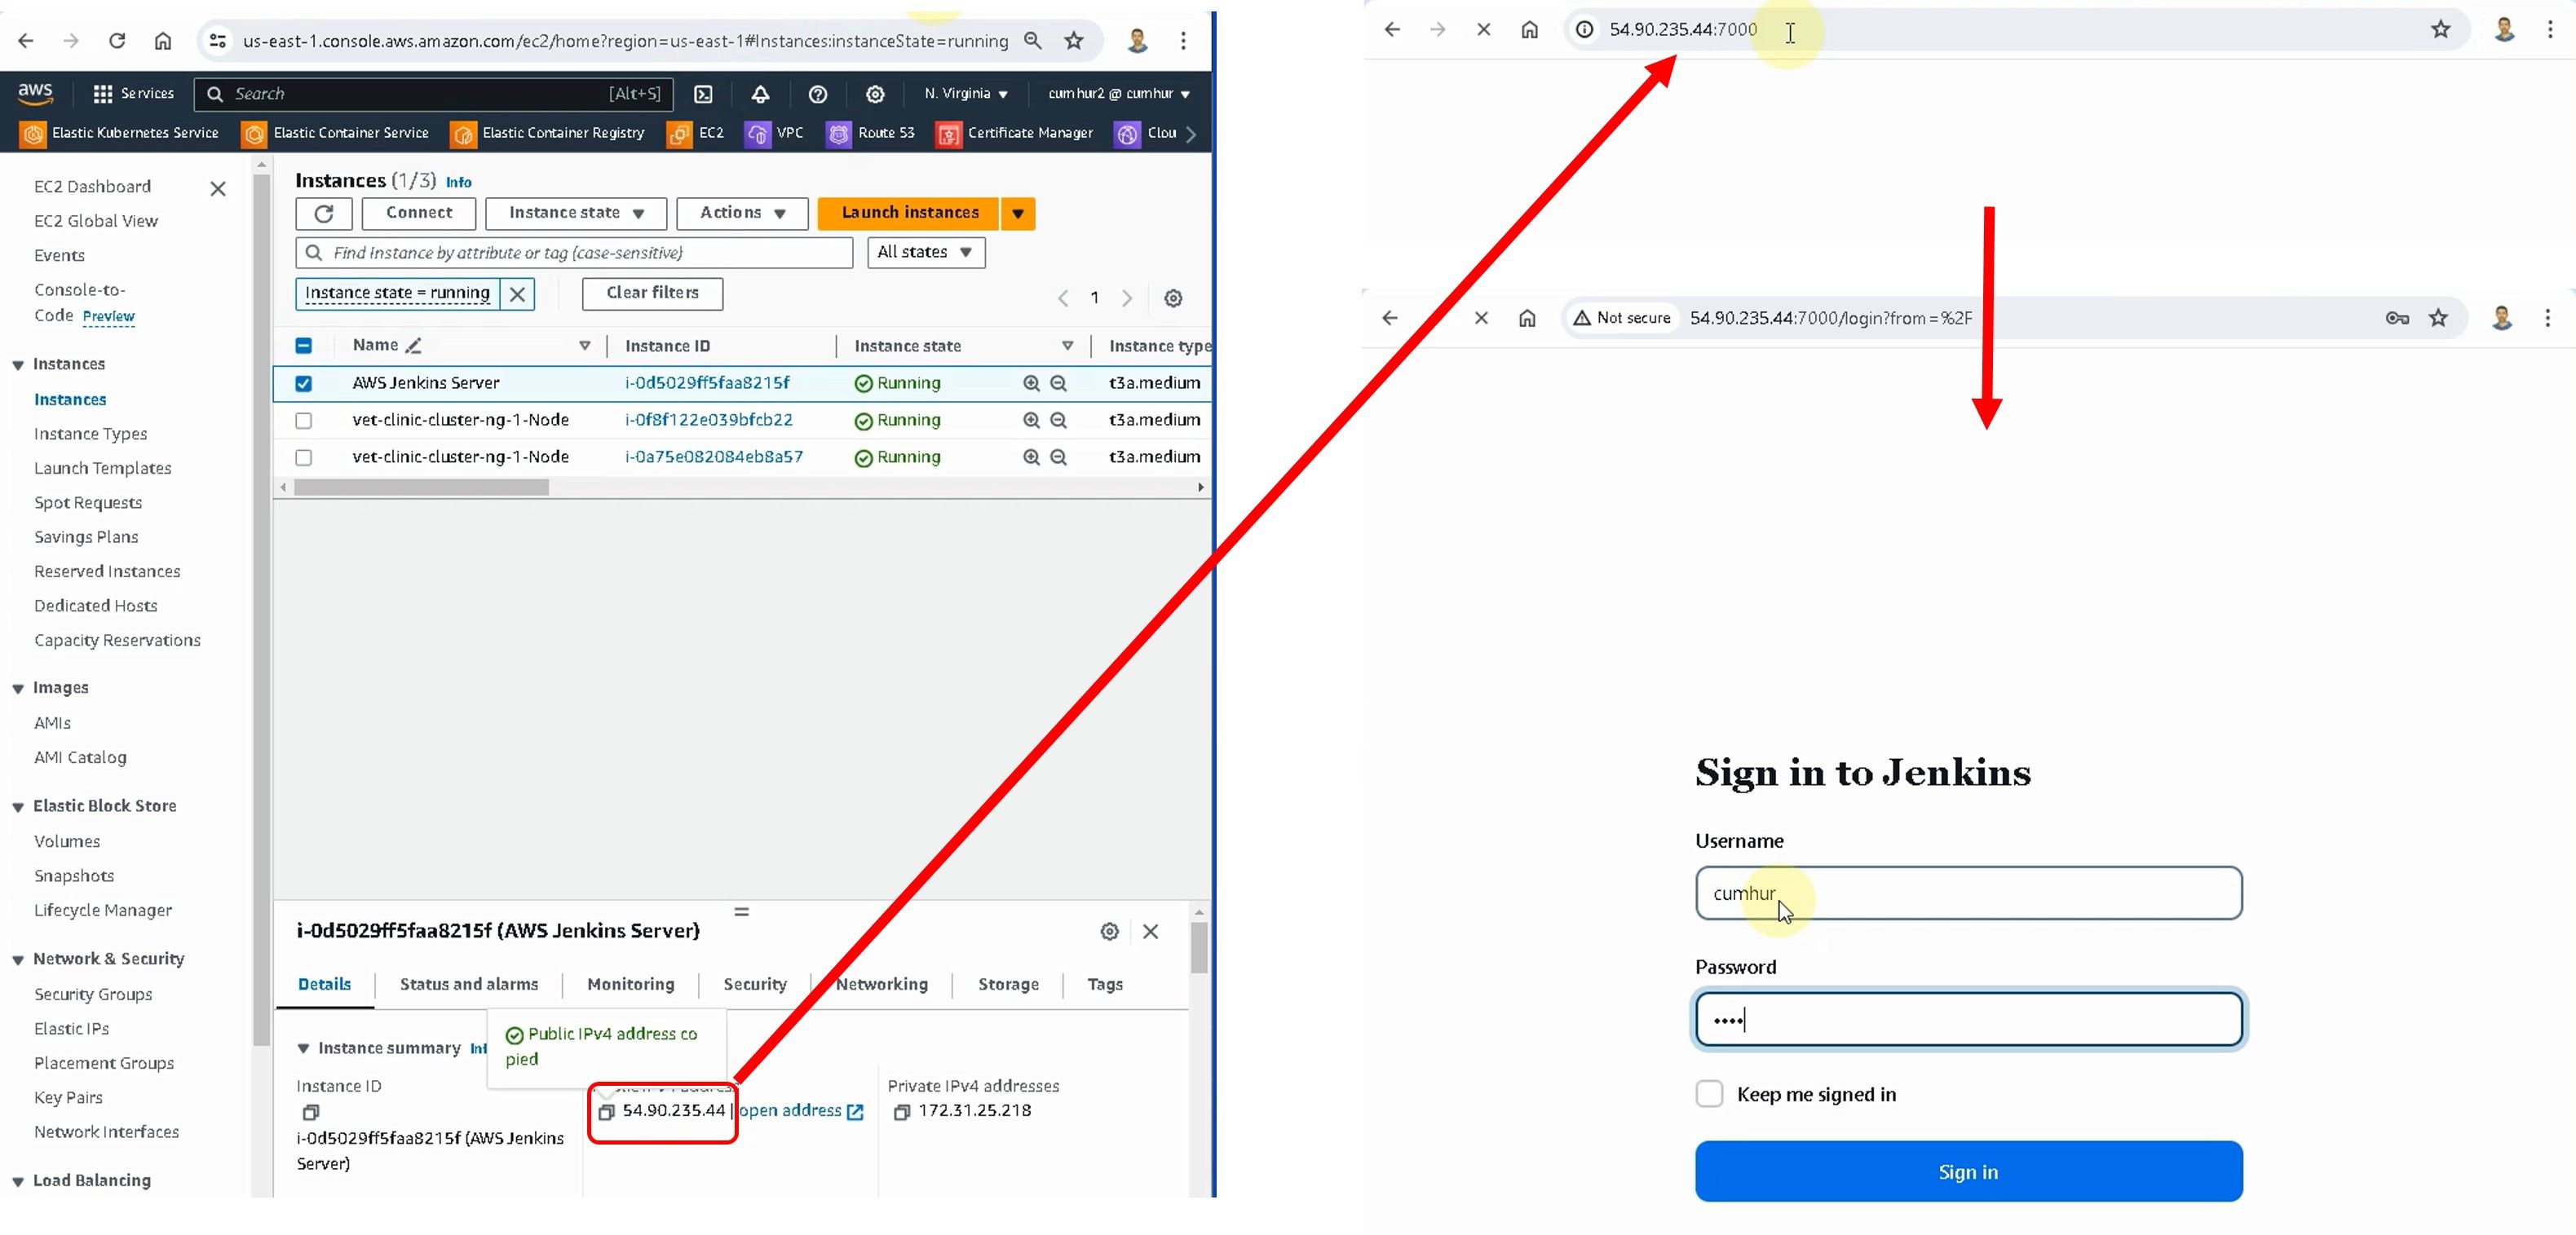
Preparing and running the Jenkins Pipeline, firstly, connect Jenkins, as shown in the figure below. Copy your Jenkins server’s public IP, and enter it into your browser: http://<your_server_public_ip>:8080, then enter your admin and password values, and click on the sign-in button, as shown in the figure below.
Note: I set the Jenkins port to 7000 for myself, you must enter the default value 8080.
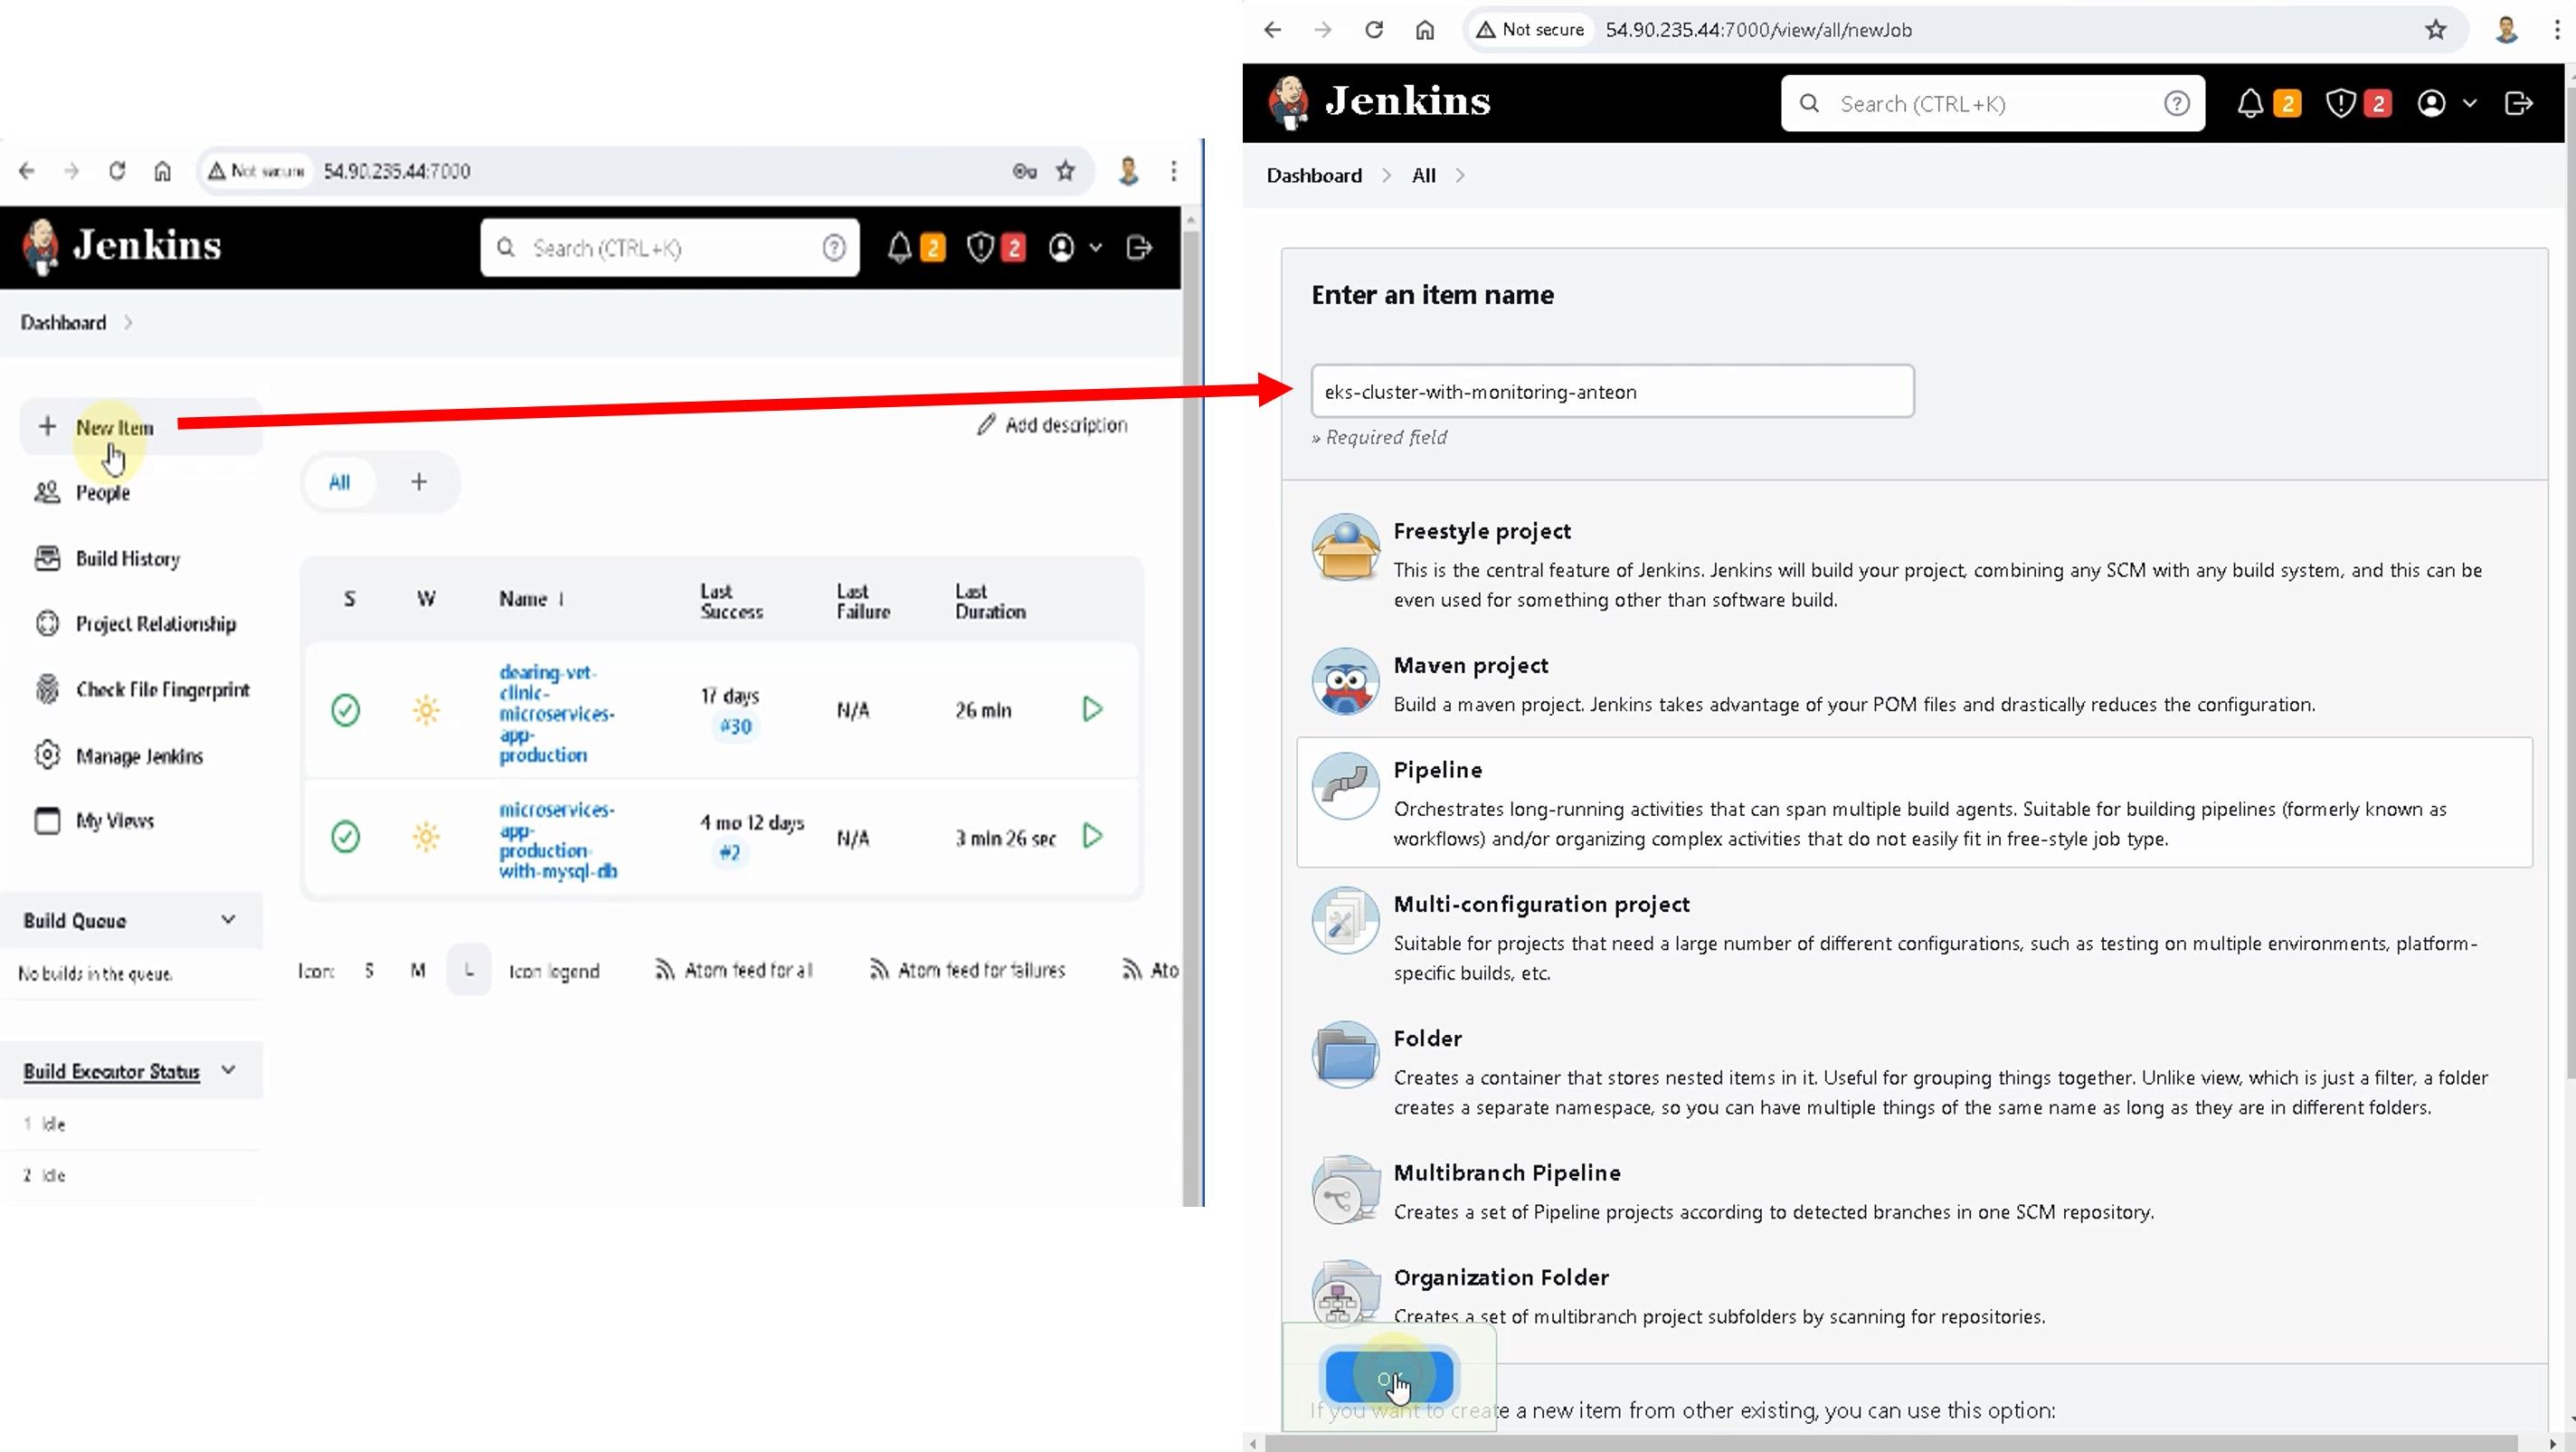
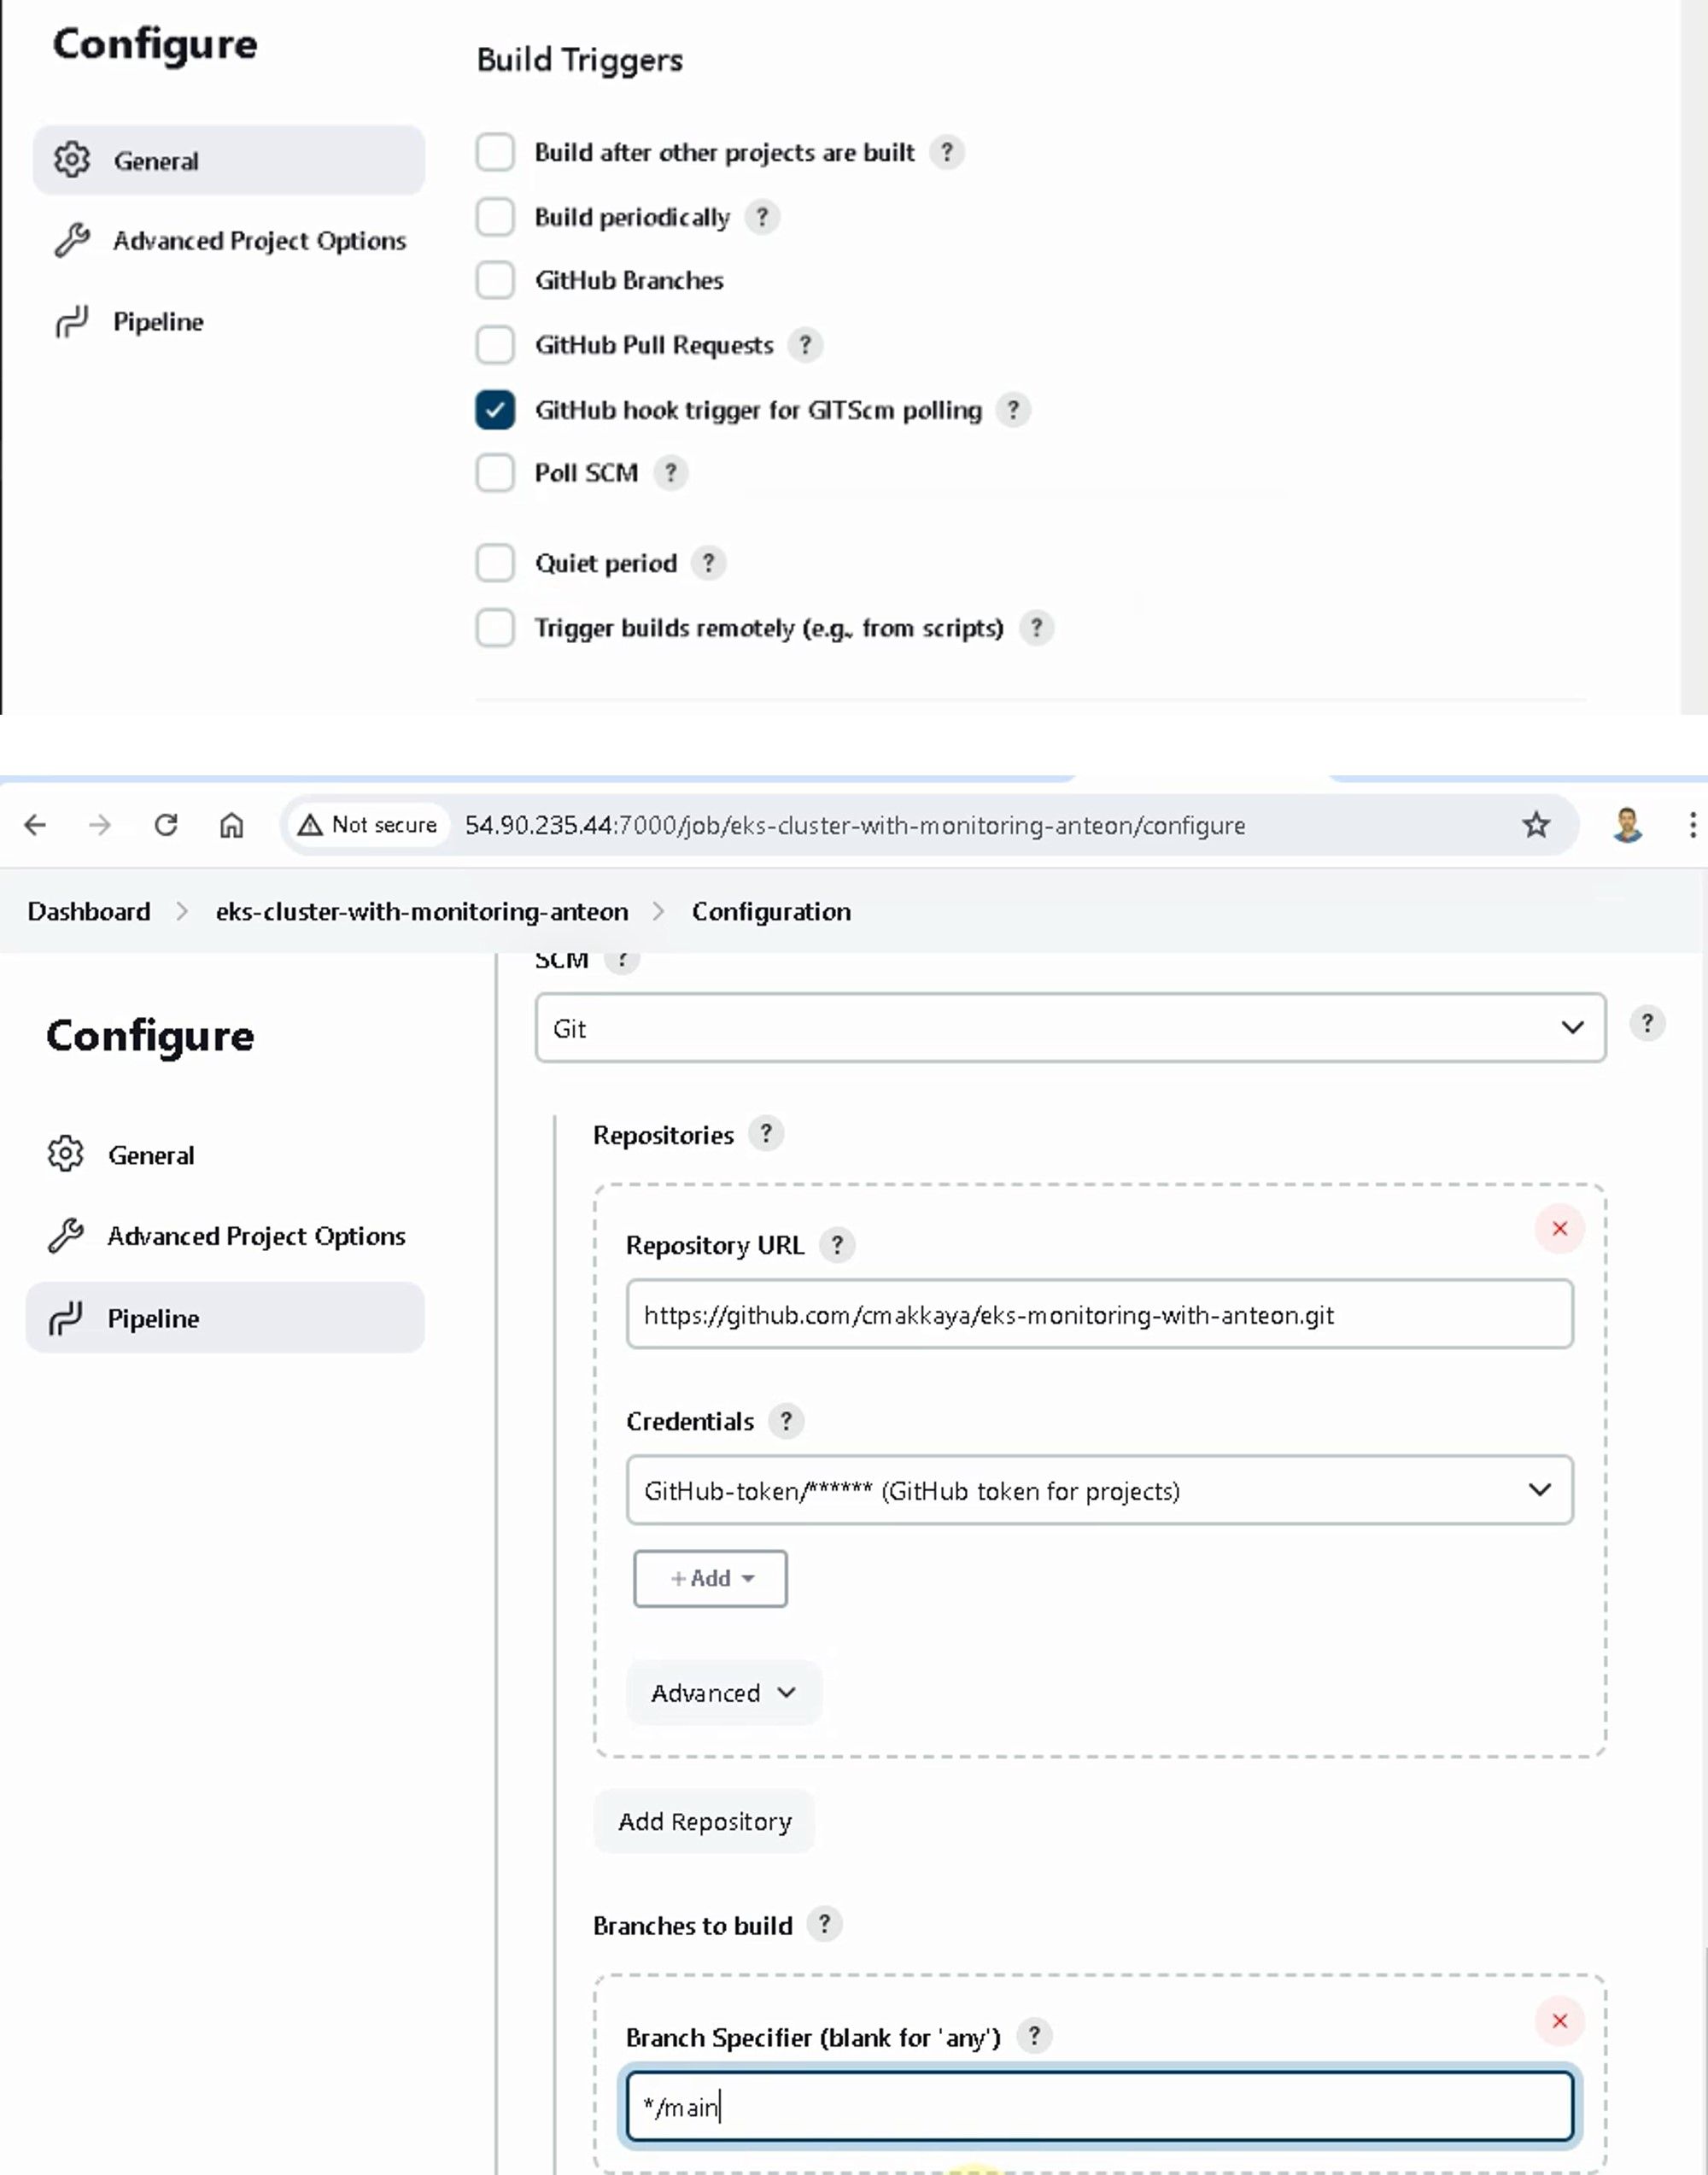
 To create a new pipeline, click on the + New Items button. Then, prepare the Jenkins pipeline by using the following values, as shown in the figures below. Leave other values as default.
- job name: eks-cluster-with-monitoring-anteon
- job type: pipeline
- Description: The production pipeline deploys the Dearing Veterinairan Clinic Java-based web application consisting of 11 microservices to the Amazon EKS cluster with Helm. We'll monitor Amazon EKS cluster with Anteon.
In the this stage, Whenever the developers push their codes to the GitHub repository, the Jenkins pipeline will run automatically thanks to the GitHub webhook and automatically update our Java-based application running on the web.
- Discard old builds: Days to keep builds=2, Max of builds to keep=2.
- GitHub project: Project url=https://github.com/cmakkaya/eks-monitoring-with-anteon
- Build Triggers:
      Build periodically:
- Source Code Management: Git
      Repository URL: https://github.com/cmakkaya/eks-monitoring-with-anteon.git
- Branches to build:
      Branch Specifier: */main
- Pipeline:
      Script Path: jenkins/jenkinsfile-microservice-app-production

In the left navigation pane, click on the Build now button to start the Jenkins pipeline, as shown in the figure below.
Note: Later we’ll create a webhook. When the developer changes her/his code in the GitHub repo, the Jenkins pipeline will run automatically (Via the webhook we’ll create), and the changed code will deploy to the AWS EKS cluster, thus it will allow us to see the final version of the application from the web browser.
The Jenkins pipeline ran and was completed successfully (Green tick and in the Console Output page), as shown in the figures below.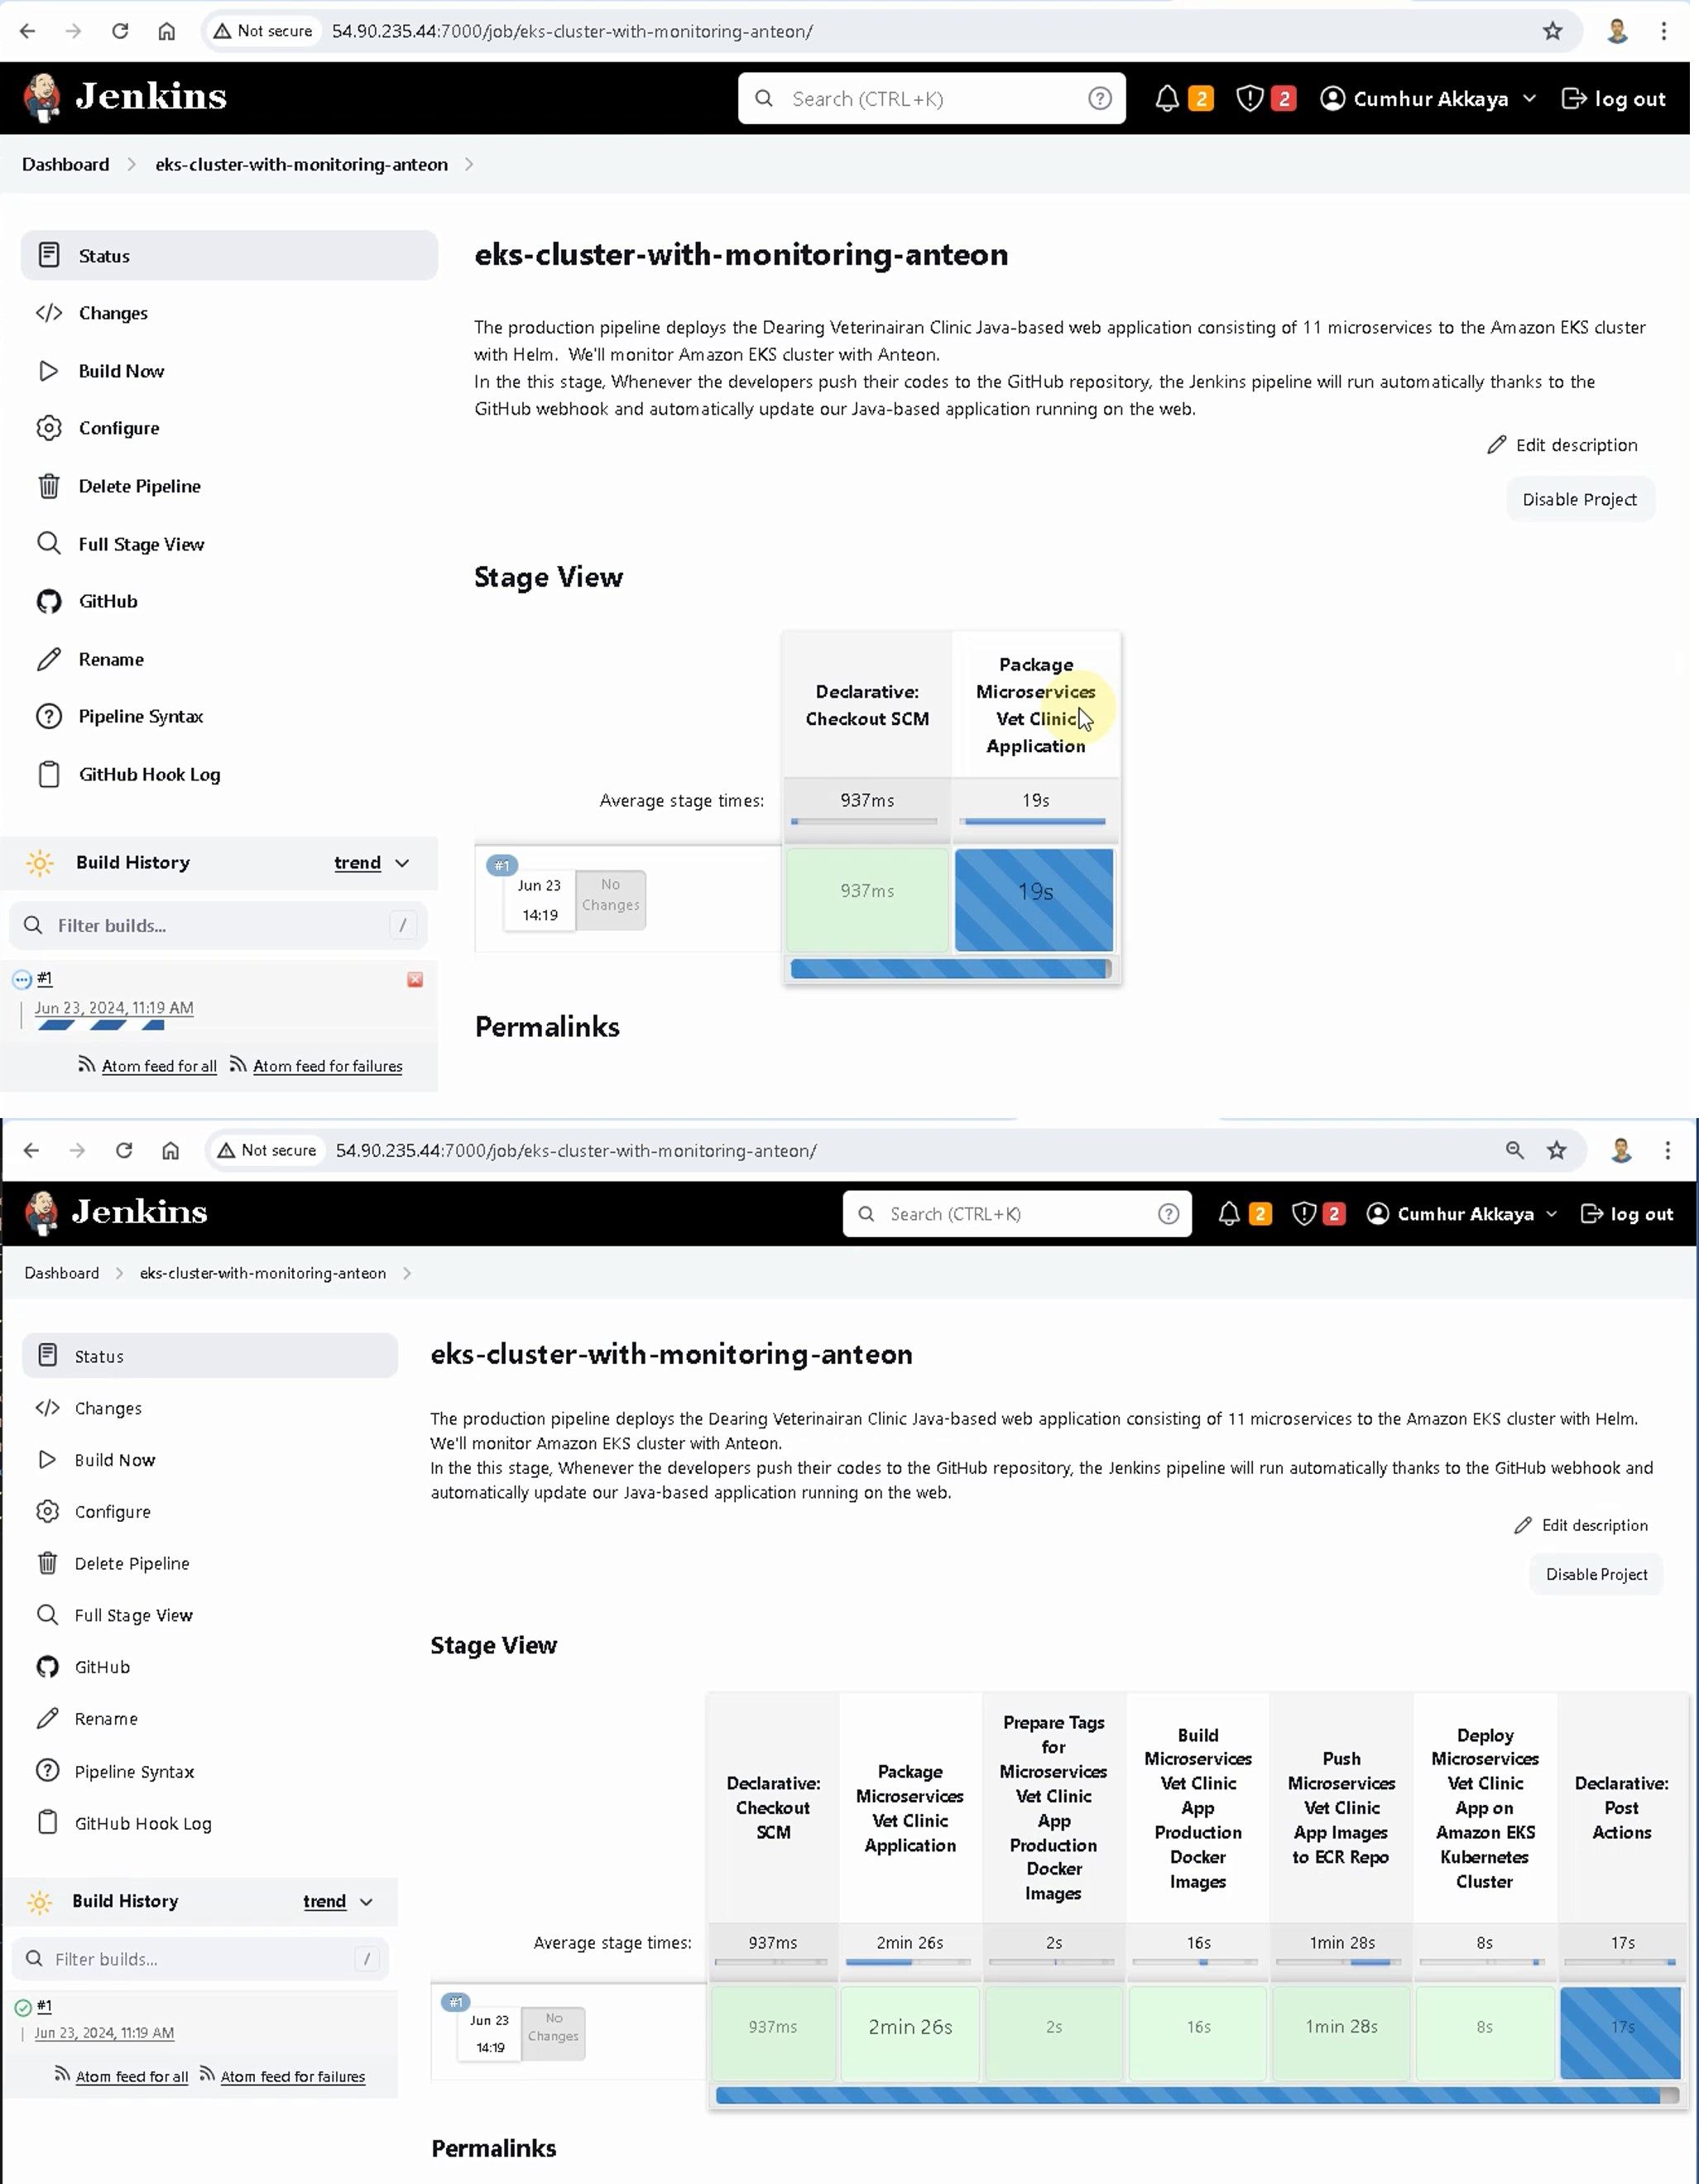
9. Setting Domain Name and TLS/SSL Certificate for Microservices App Using Amazon Route 53 and Let’s Encrypt-Cert Manager.
9.1. Creating an A record
We will start creating the A record by clicking on the create record button, as shown in the figures below.
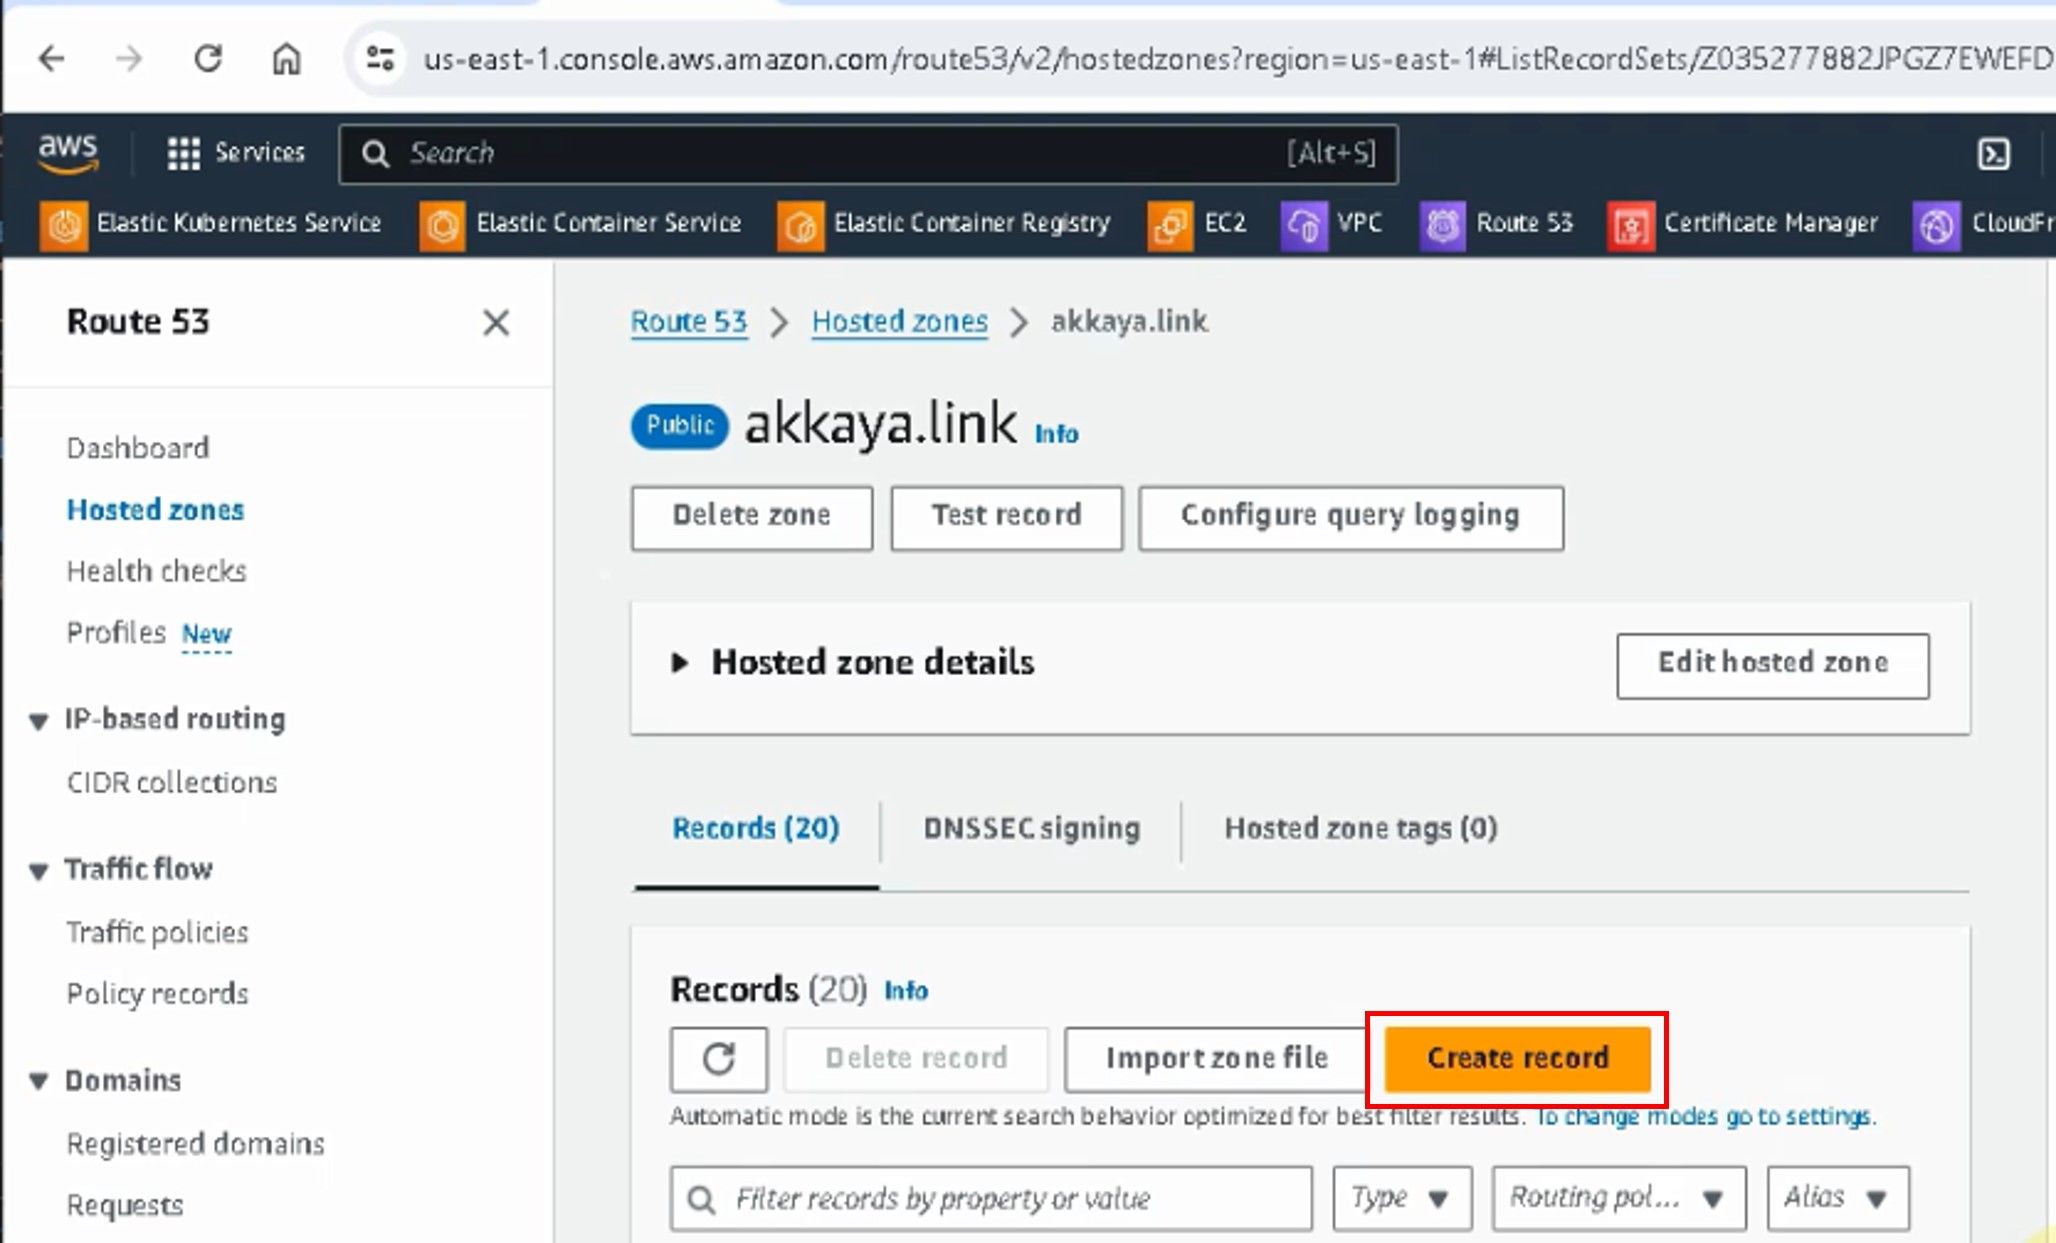
Create the A record by entering the following values.
Record name : micoservices-app
Record type: A Routes
Alias: Open
Route traffic to: Alias to Aplication and Classic Load Balancer
Choose region: us-east-1
Choose load balancer: dualstack.a5c7431acf1c54cc884cbc6f3a0ced44–691005446.us-east-1.elb.amazonaws.com # Enter your LB
Routing policy: Simple
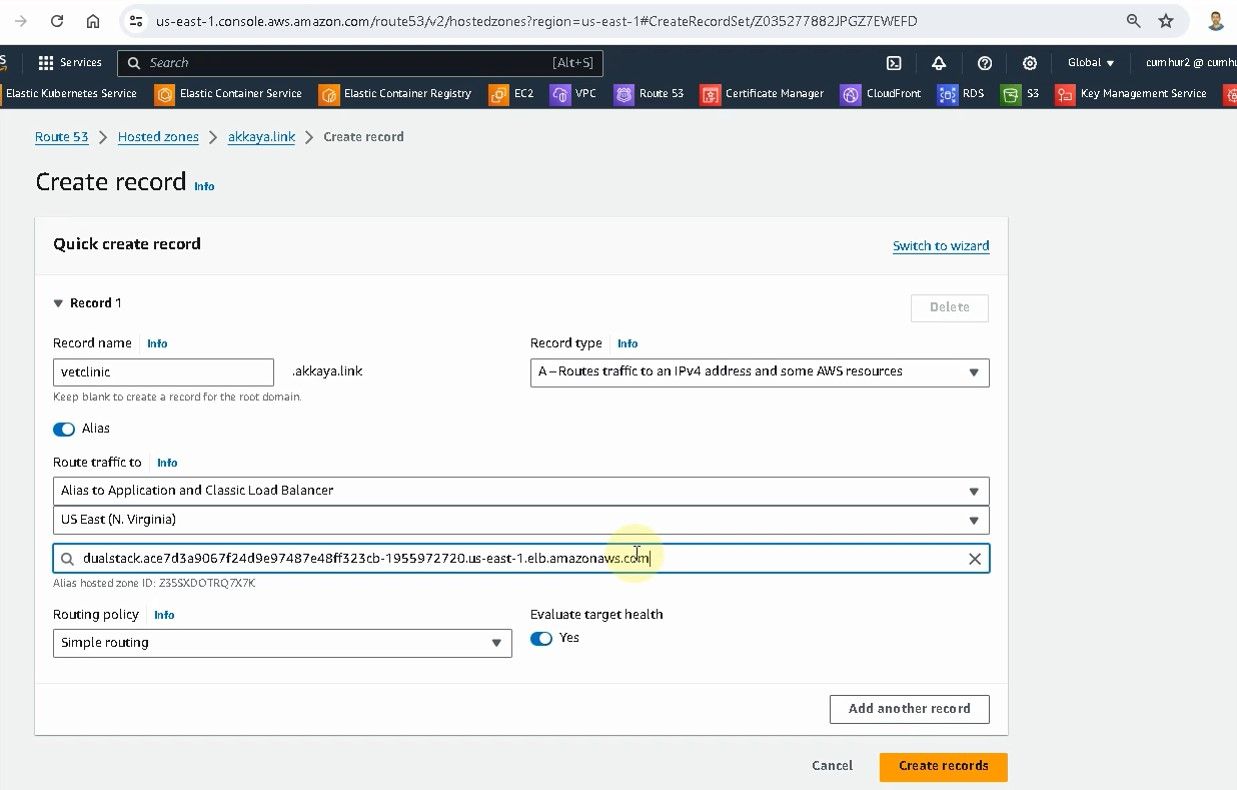
A record was created.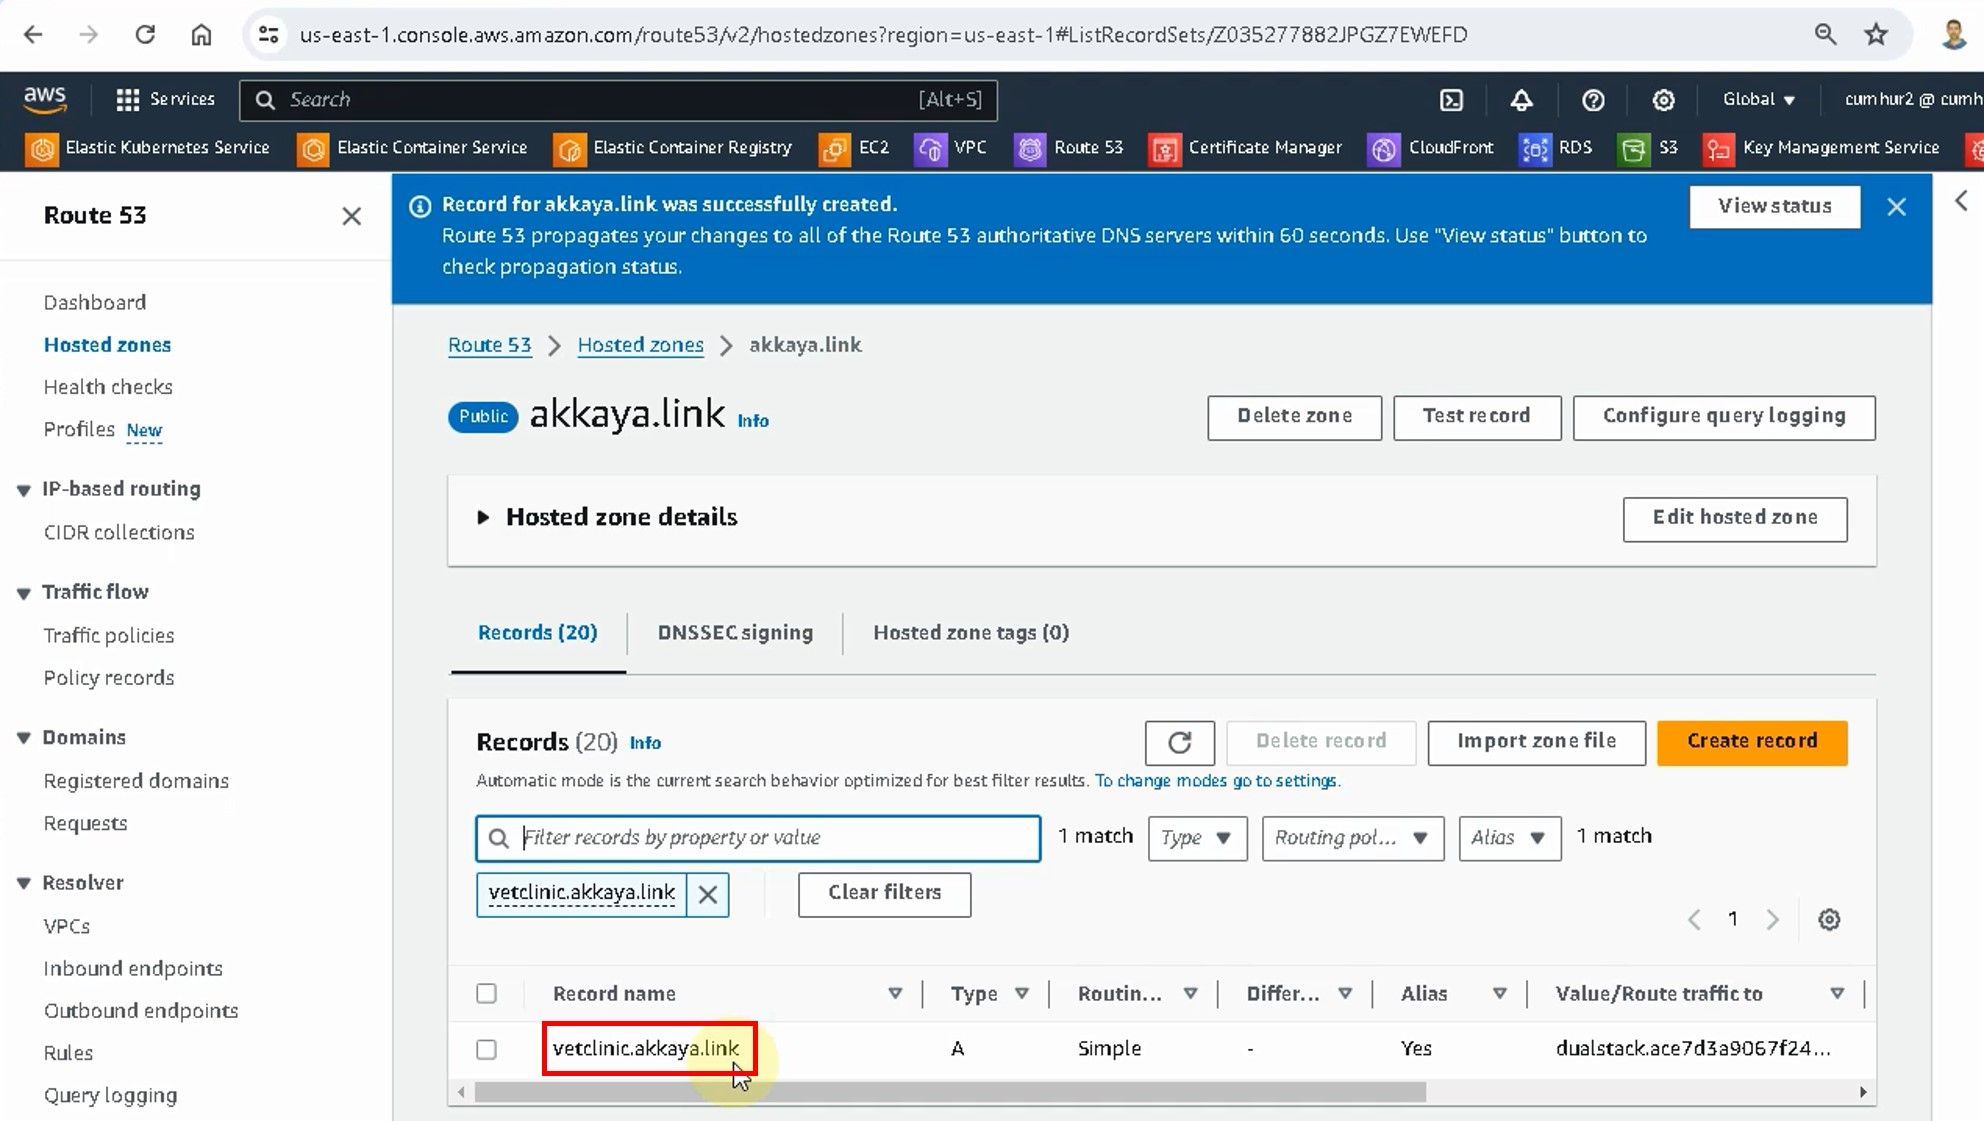
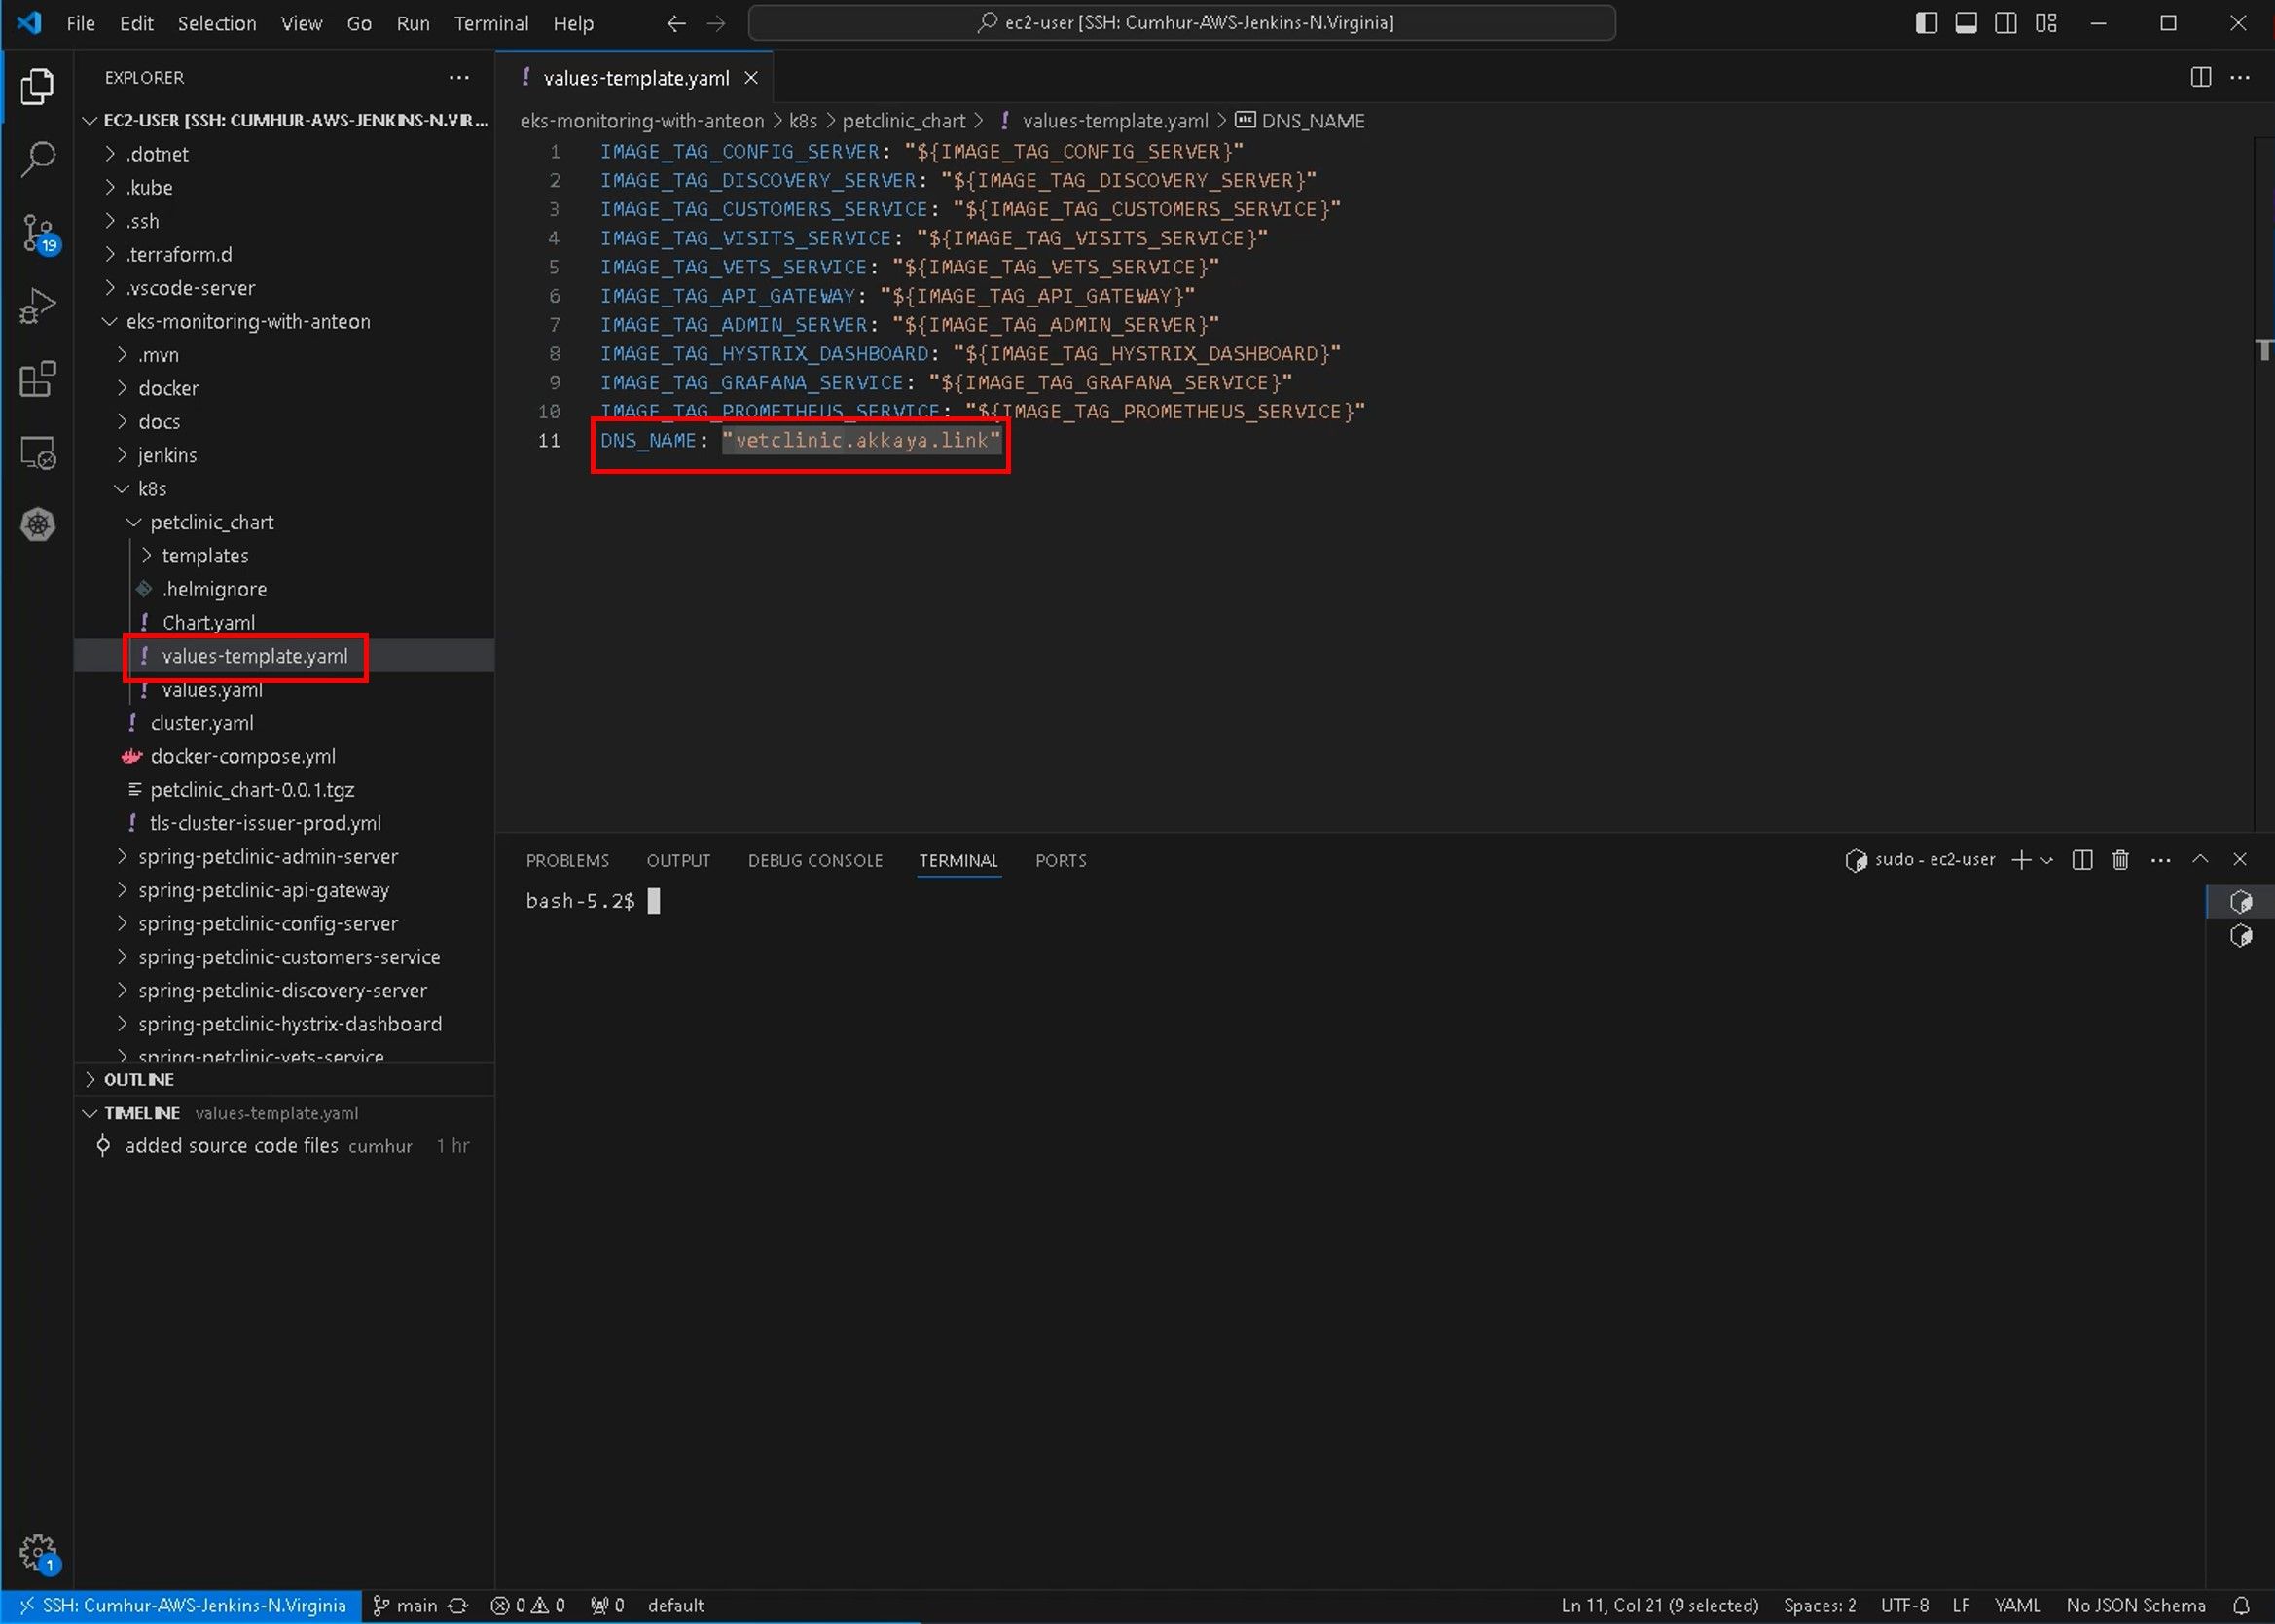
Note: Don’t forget to enter this DNS A record into DNS_NAME: “vetclinic.akkaya.link” in the values-template.yaml file, as shown in the figure below.
9.2. Creating Cert-Manager
To create Cert-Manager, enter the following commands in Jenkins User, under var/lib/Jenkins folder, as shown in the figures below.
kubectl create namespace cert-manager             # in Jenkins user
helm repo add jetstack https://charts.jetstack.io
helm repo update
kubectl apply -f https://github.com/cert-manager/cert-manager/releases/download/v1.11.0/cert-manager.crds.yaml
helm install cert-manager jetstack/cert-manager --namespace cert-manager --version v1.11.0
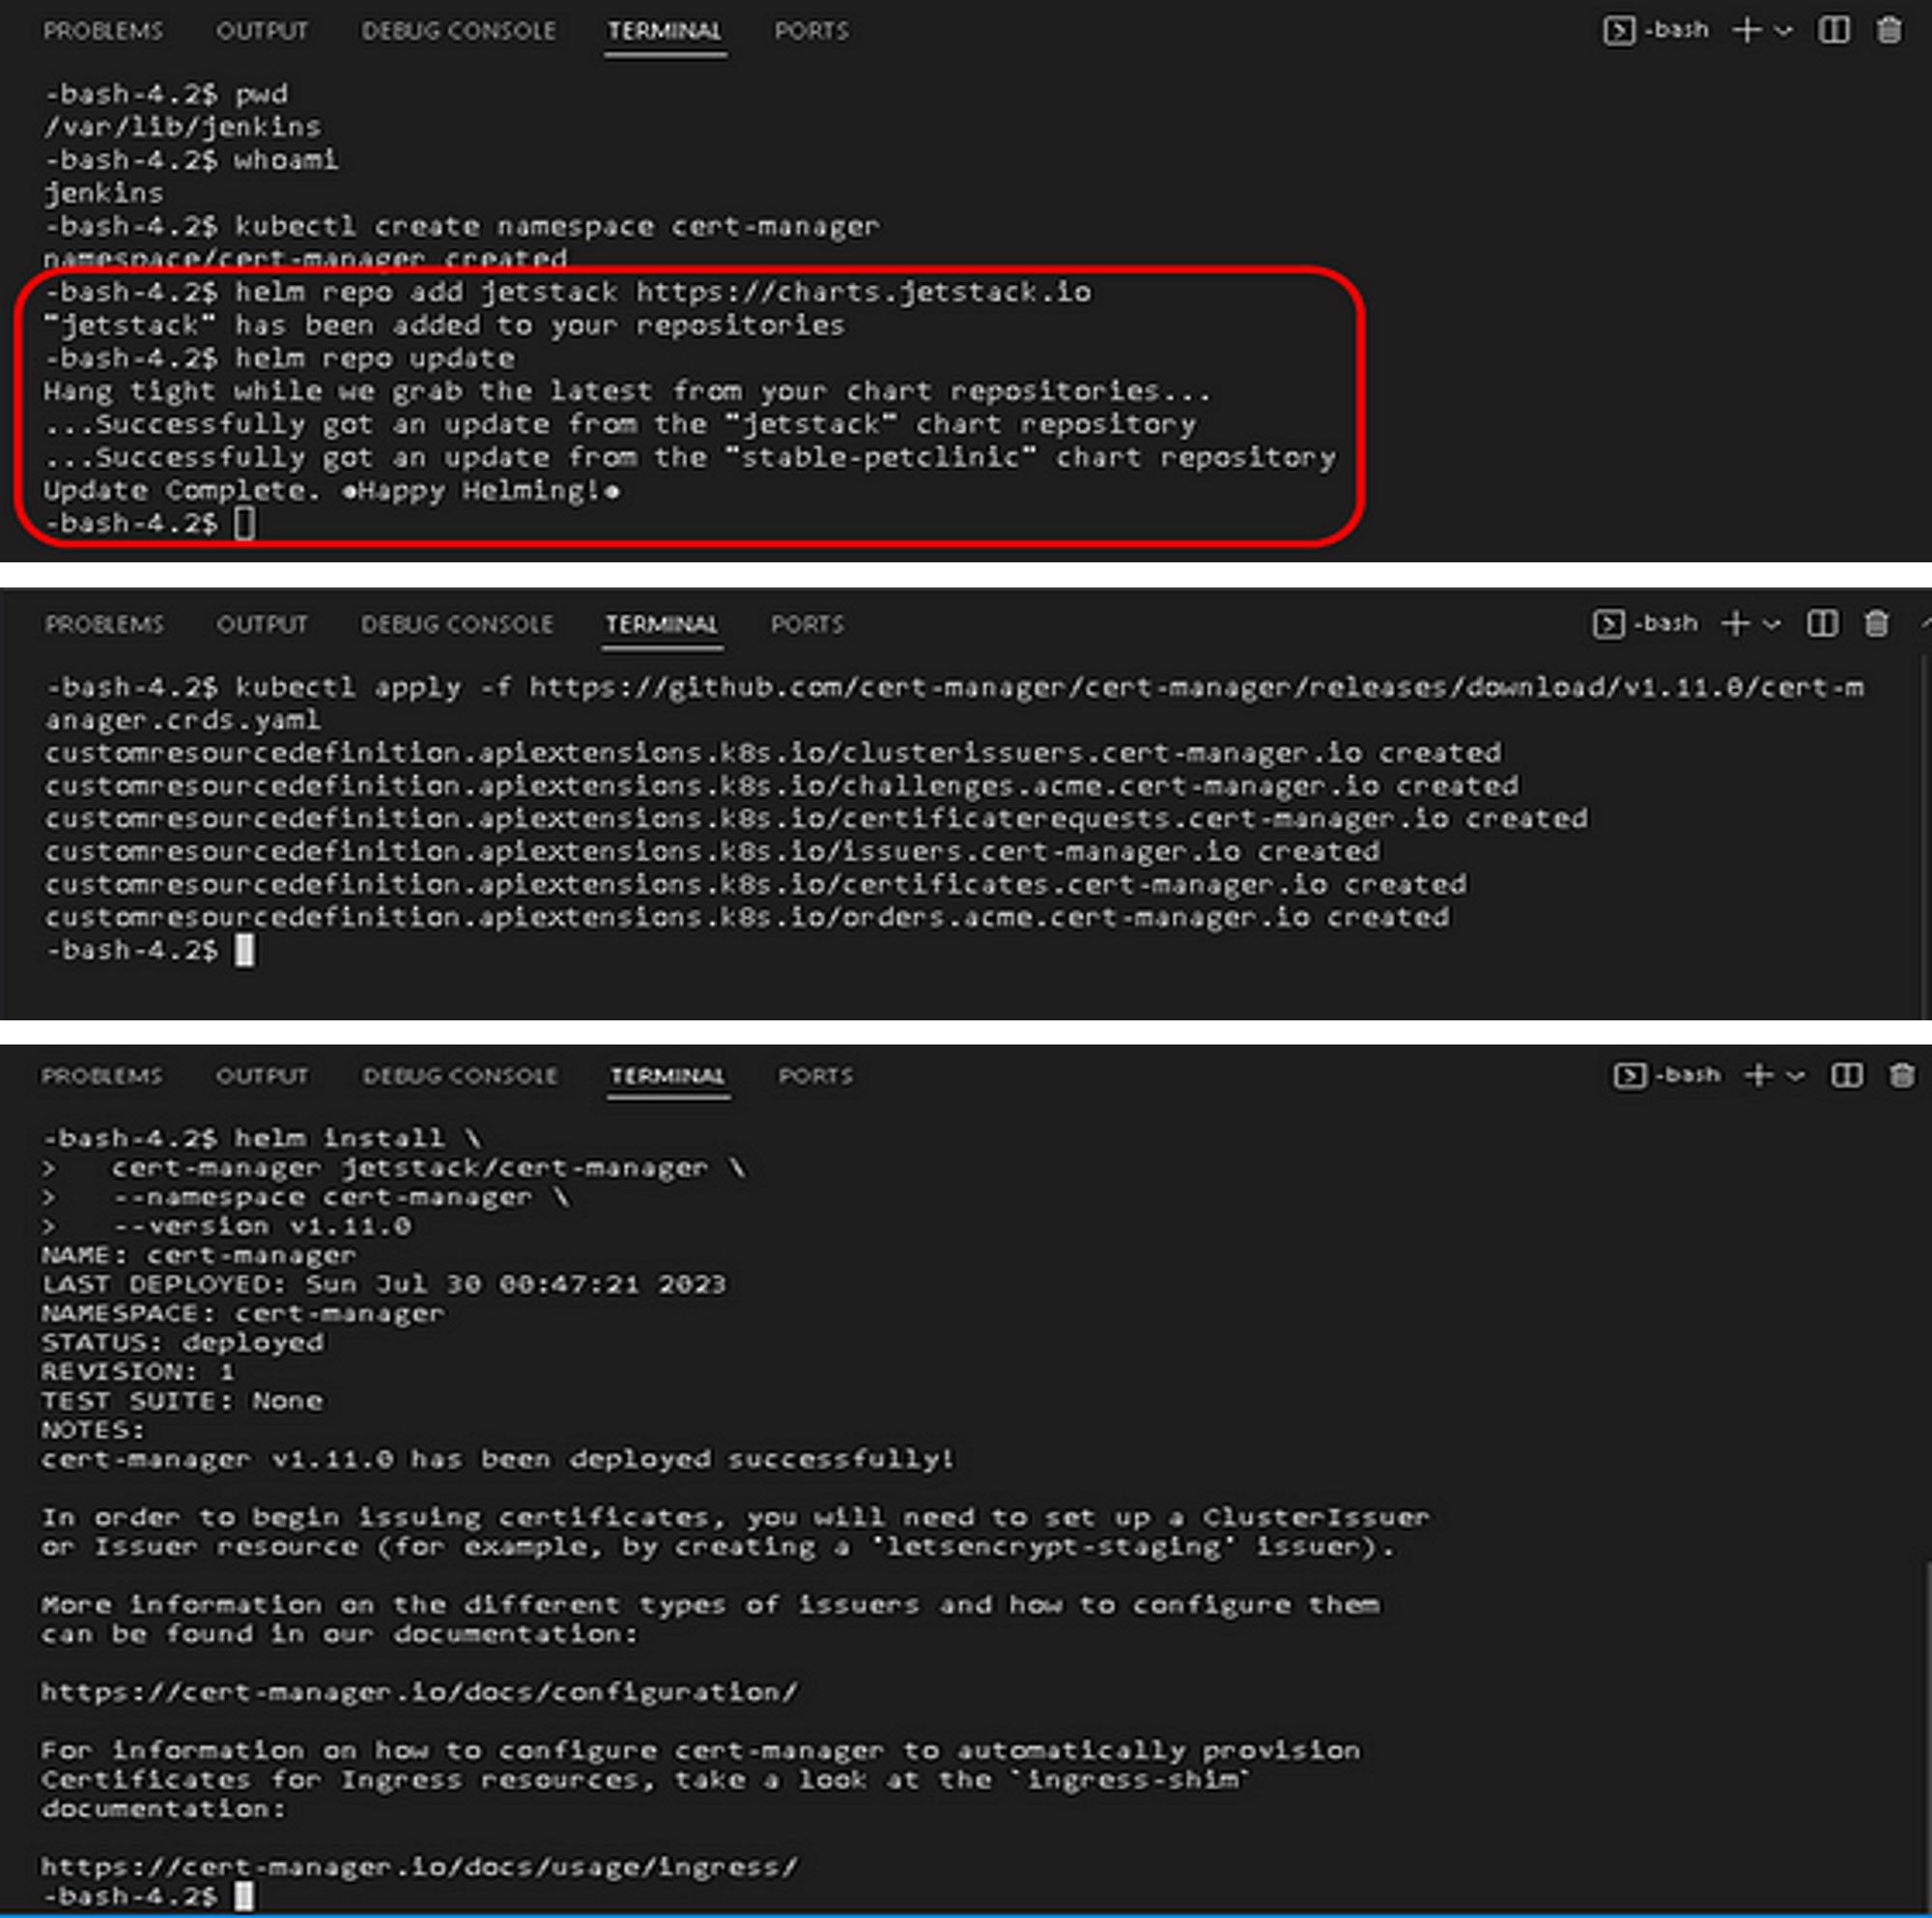
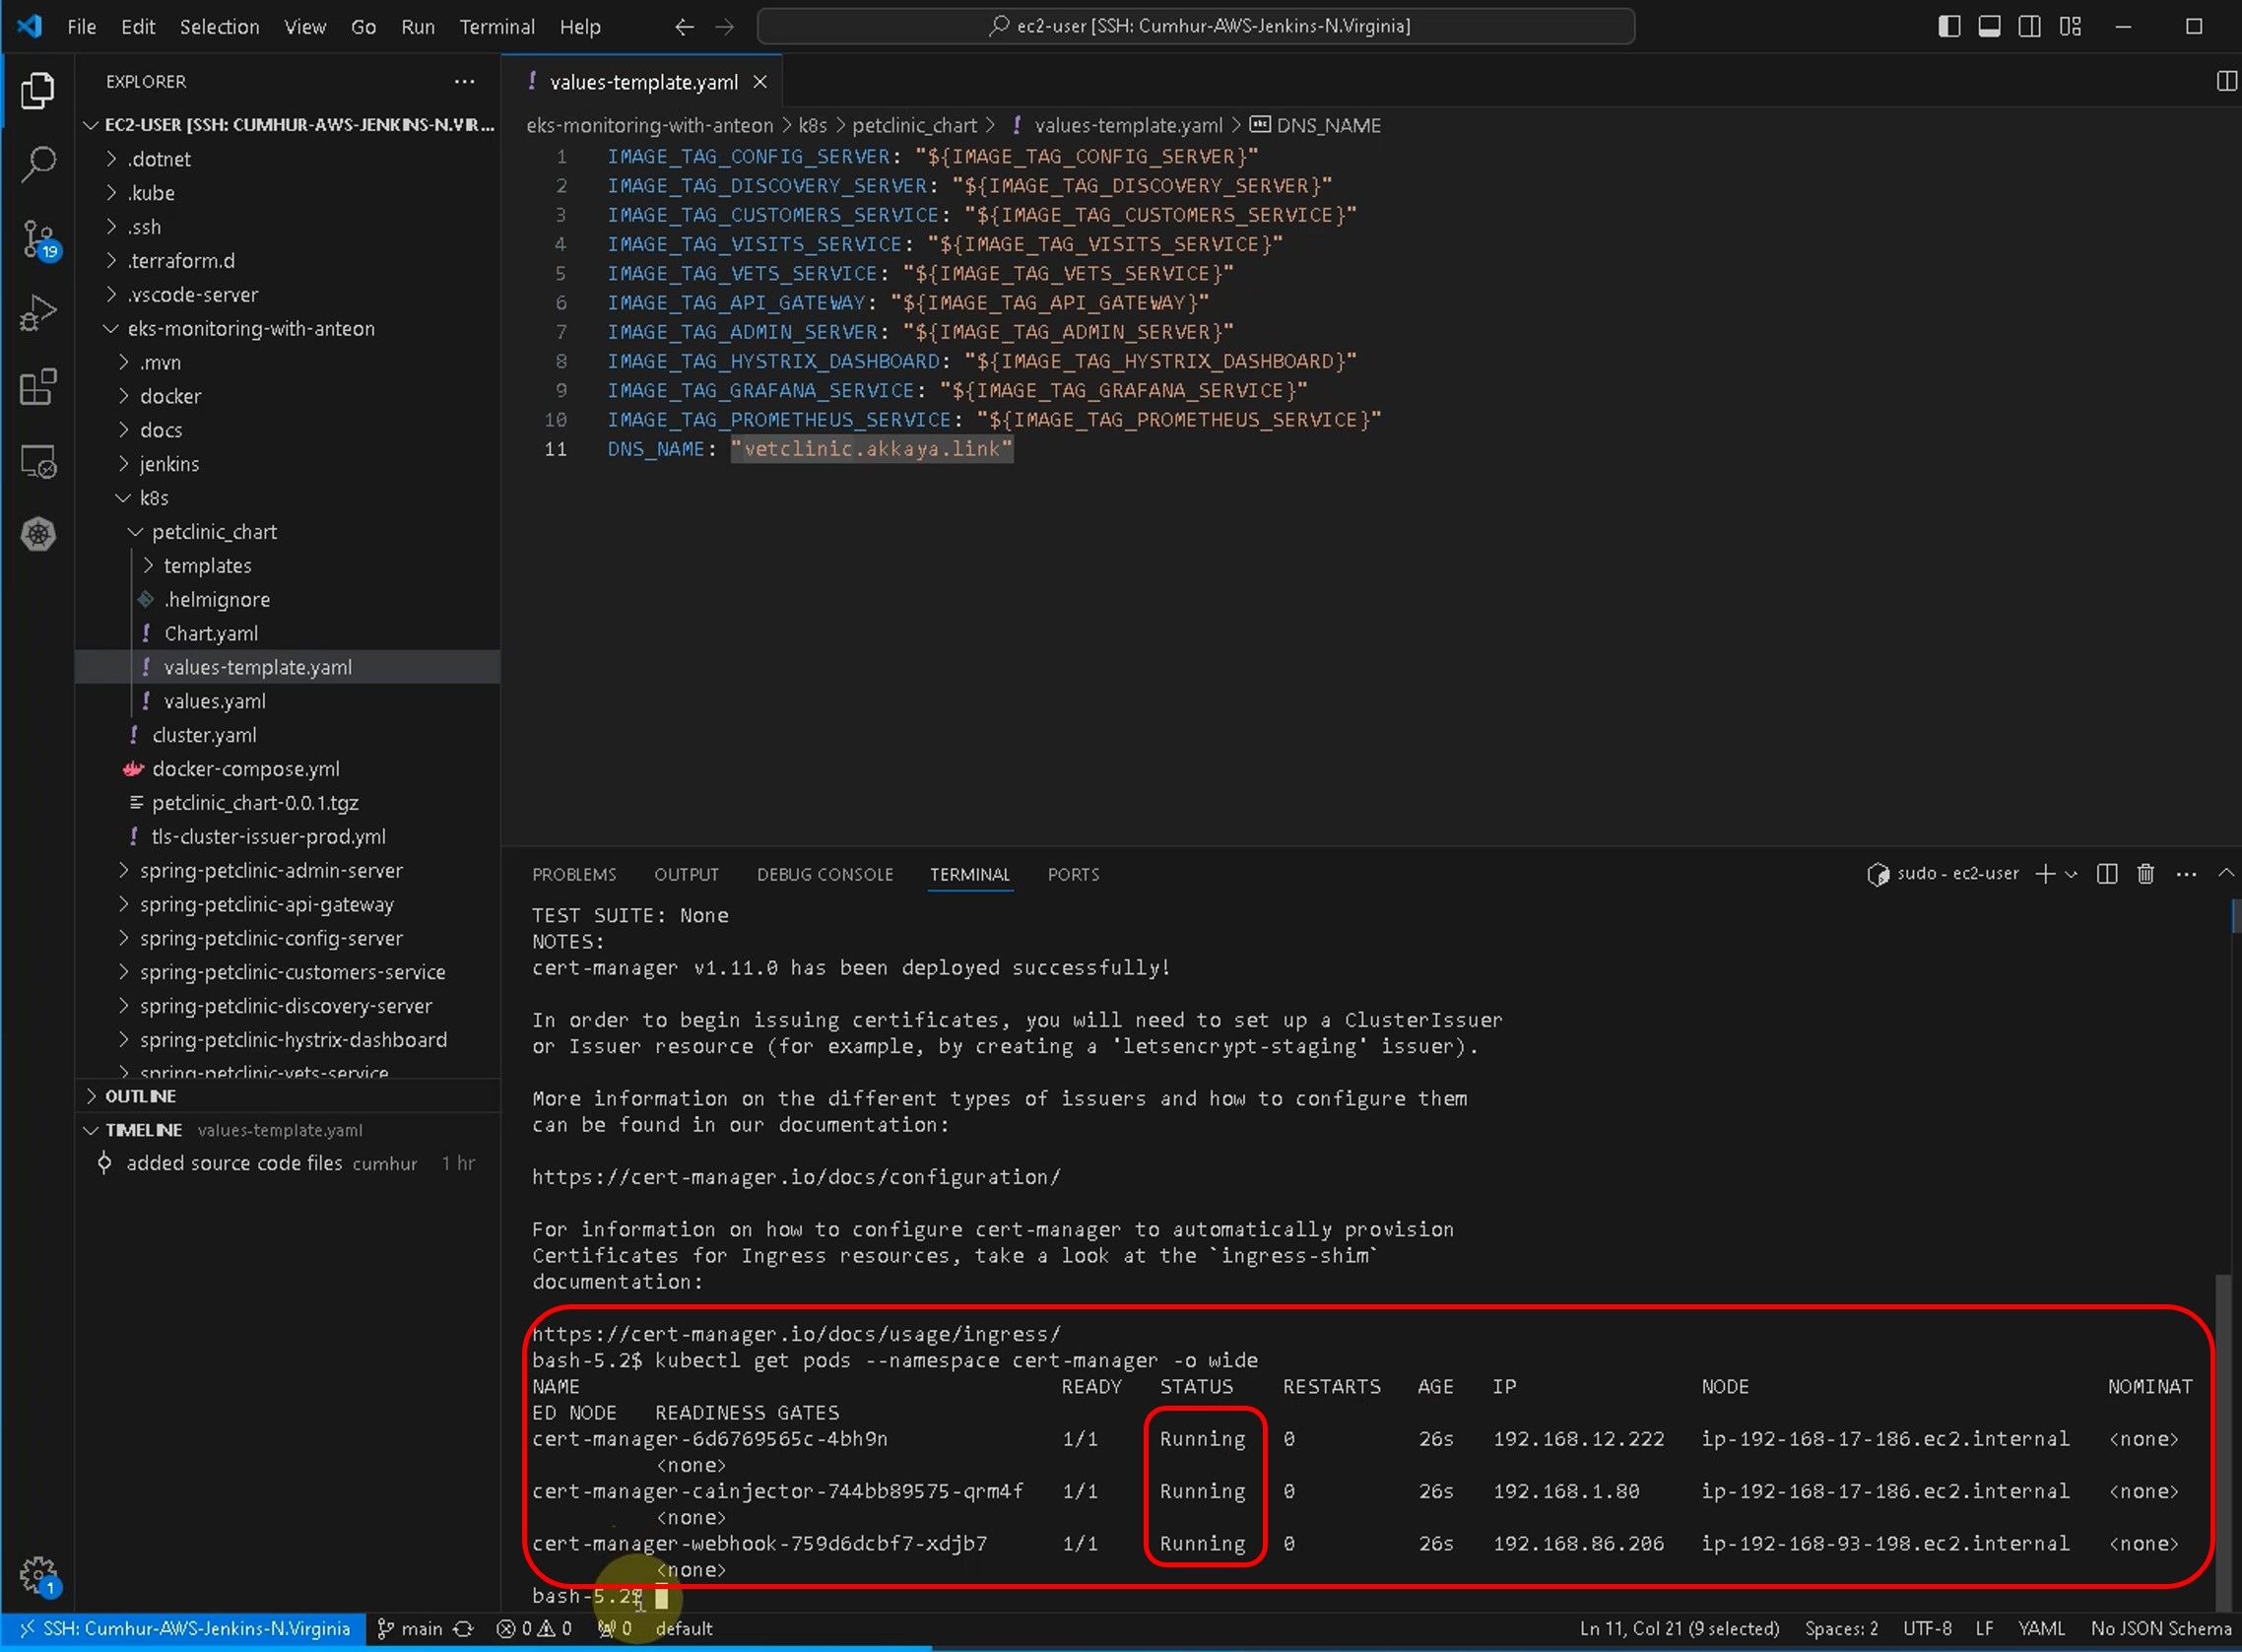
Verify that the cert-manager is deployed correctly with the following command, as shown in the figures below.
kubectl get pods --namespace cert-manager -o wide
9.3. Creating Let’s Encrypt
First of all, we will create and use a ClusterIssuer file by using Nano so that Let’s Encrypt is valid in all clusters.
apiVersion: cert-manager.io/v1
kind: ClusterIssuer
metadata:
  name: letsencrypt-prod
  namespace: cert-manager
spec:
  acme:
    # The ACME server URL
    server: https://acme-v02.api.letsencrypt.org/directory
    # Email address used for ACME registration
    email: [email protected]
    # Name of a secret used to store the ACME account private key
    privateKeySecretRef:
      name: letsencrypt-prod
    # Enable the HTTP-01 challenge provider
    solvers:
    - http01:
        ingress:
          class: nginx
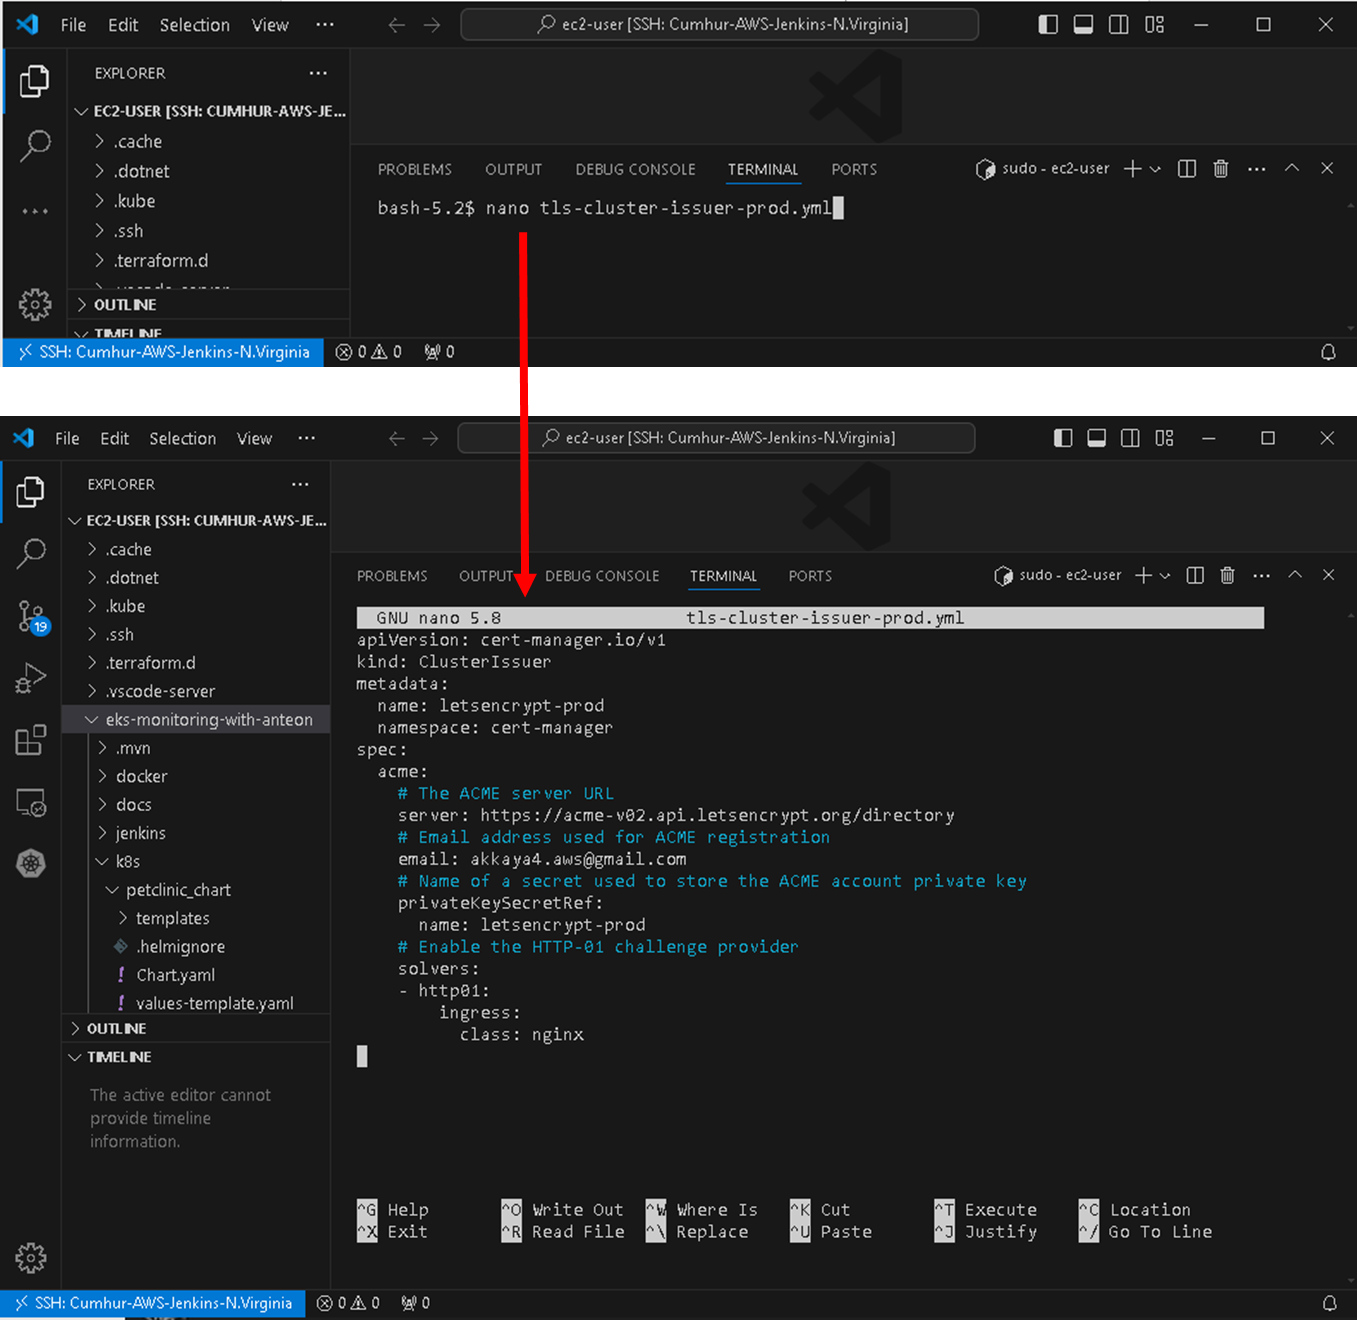
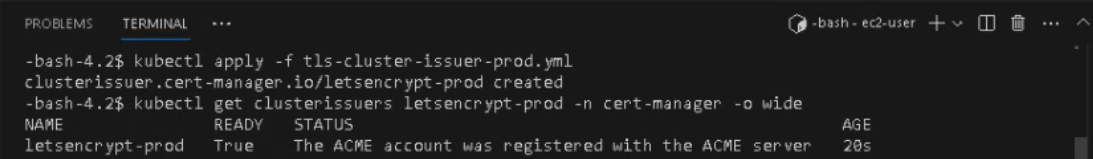
Install the ClusterIssuer with the following command, as shown in the figures below. You have to give the command in the folder where the tls-cluster-issuer-prod.yml file was created.
kubectl apply -f tls-cluster-issuer-prod.yml
Check whether the ClusterIssuer resource is created with the following command, as shown in the figures below.
kubectl get clusterissuers letsencrypt-prod -n cert-manager -o wide
9.4. Modifying ingress.yaml file
We will change the following values in api-gateway Ingress file, as shown in the figures below.
kubectl edit ing api-gateway -n petclinic-prod-ns
metadata:
  name: api-gateway
  annotations:
       ...
       ...
    cert-manager.io/cluster-issuer: "letsencrypt-prod"

# AND

spec:
  tls:
  - hosts:
    - micoservices-app.cmakkay-awsdevops.link
    secretName: petclinic-tls

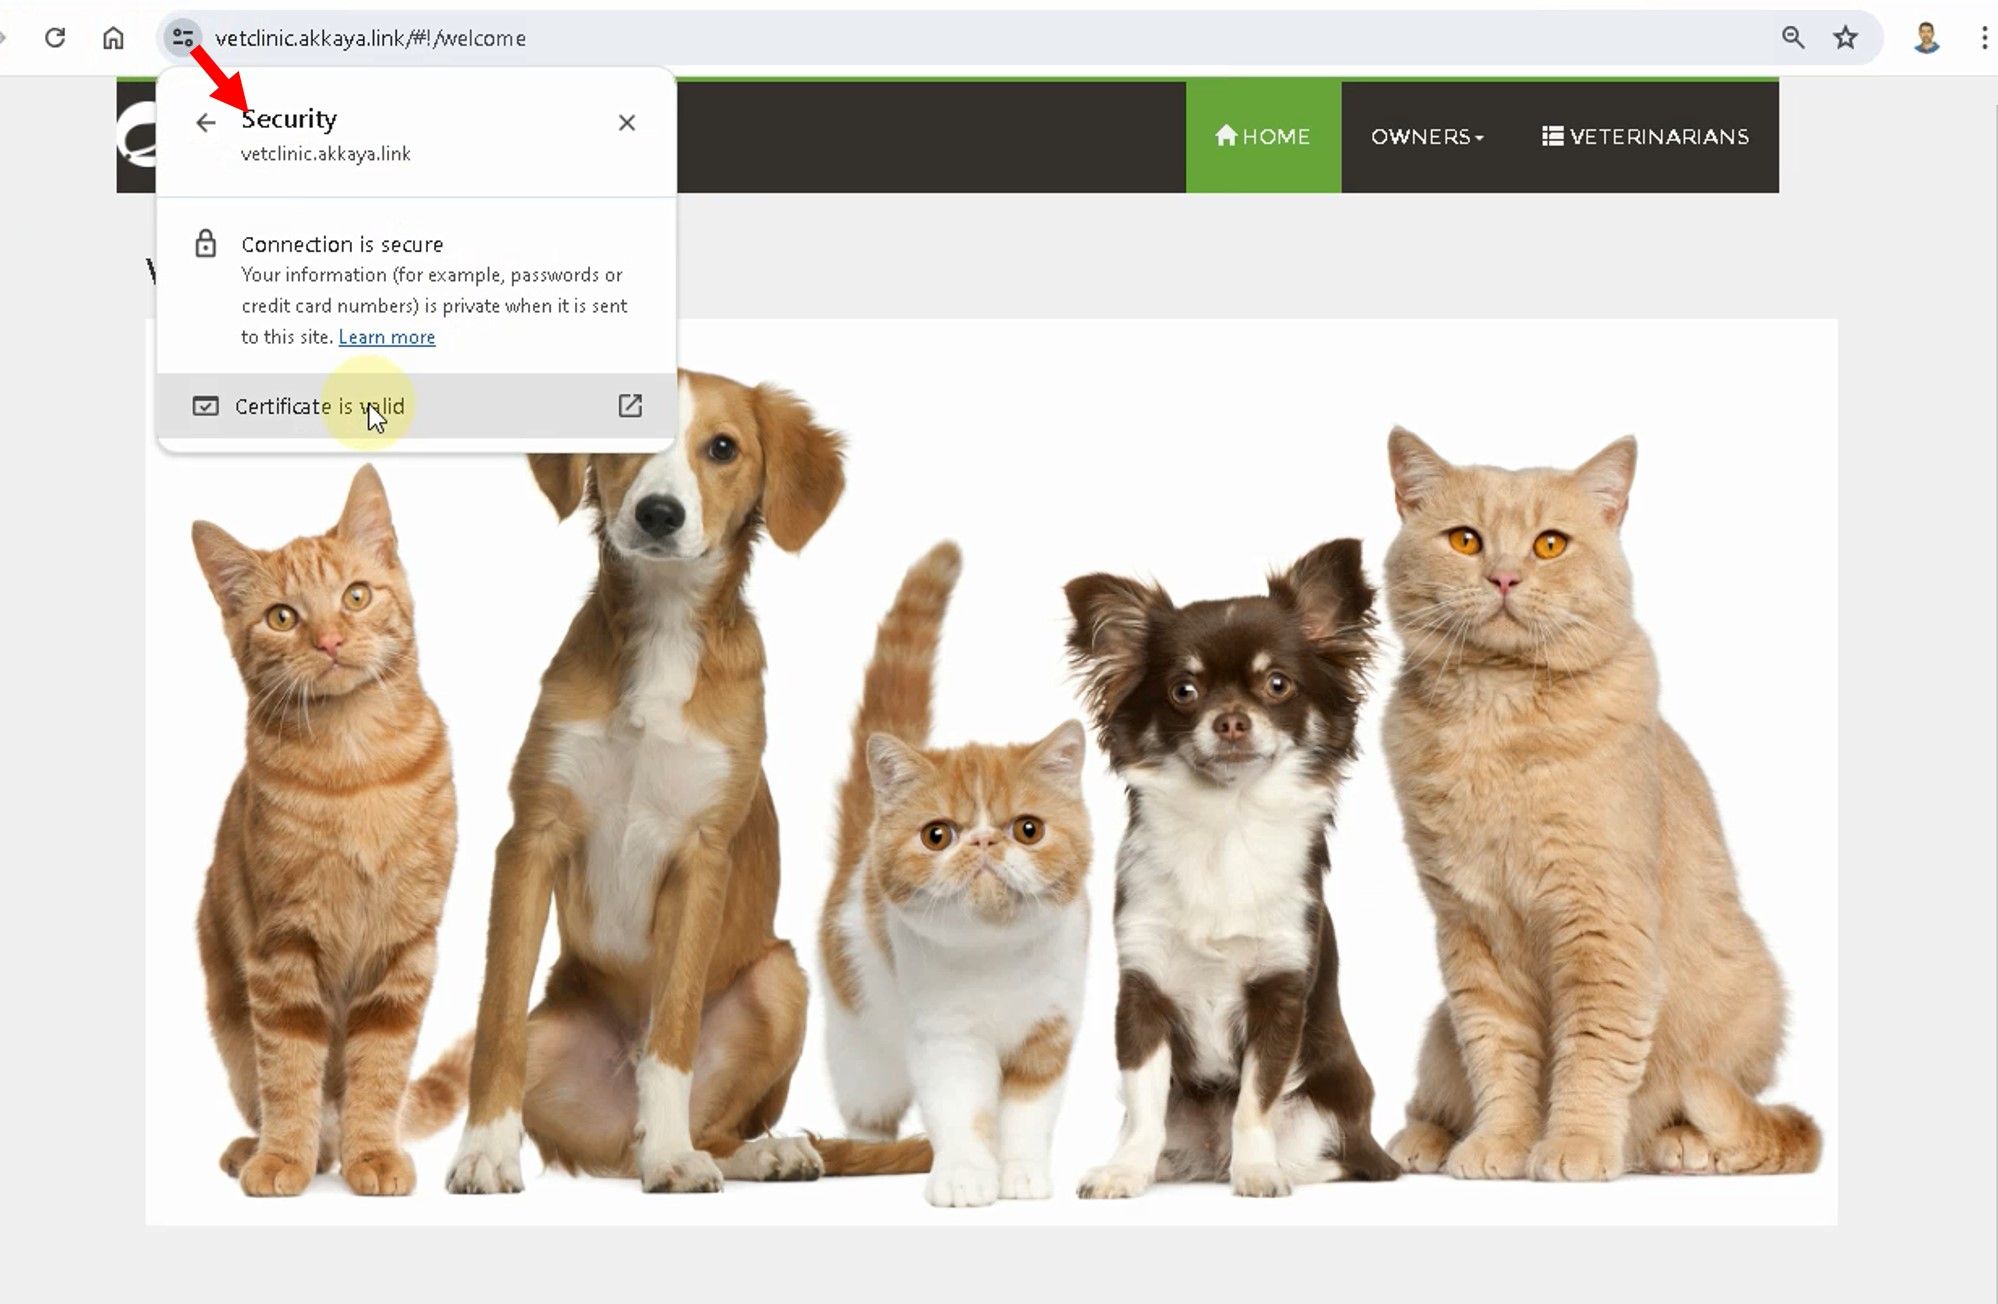
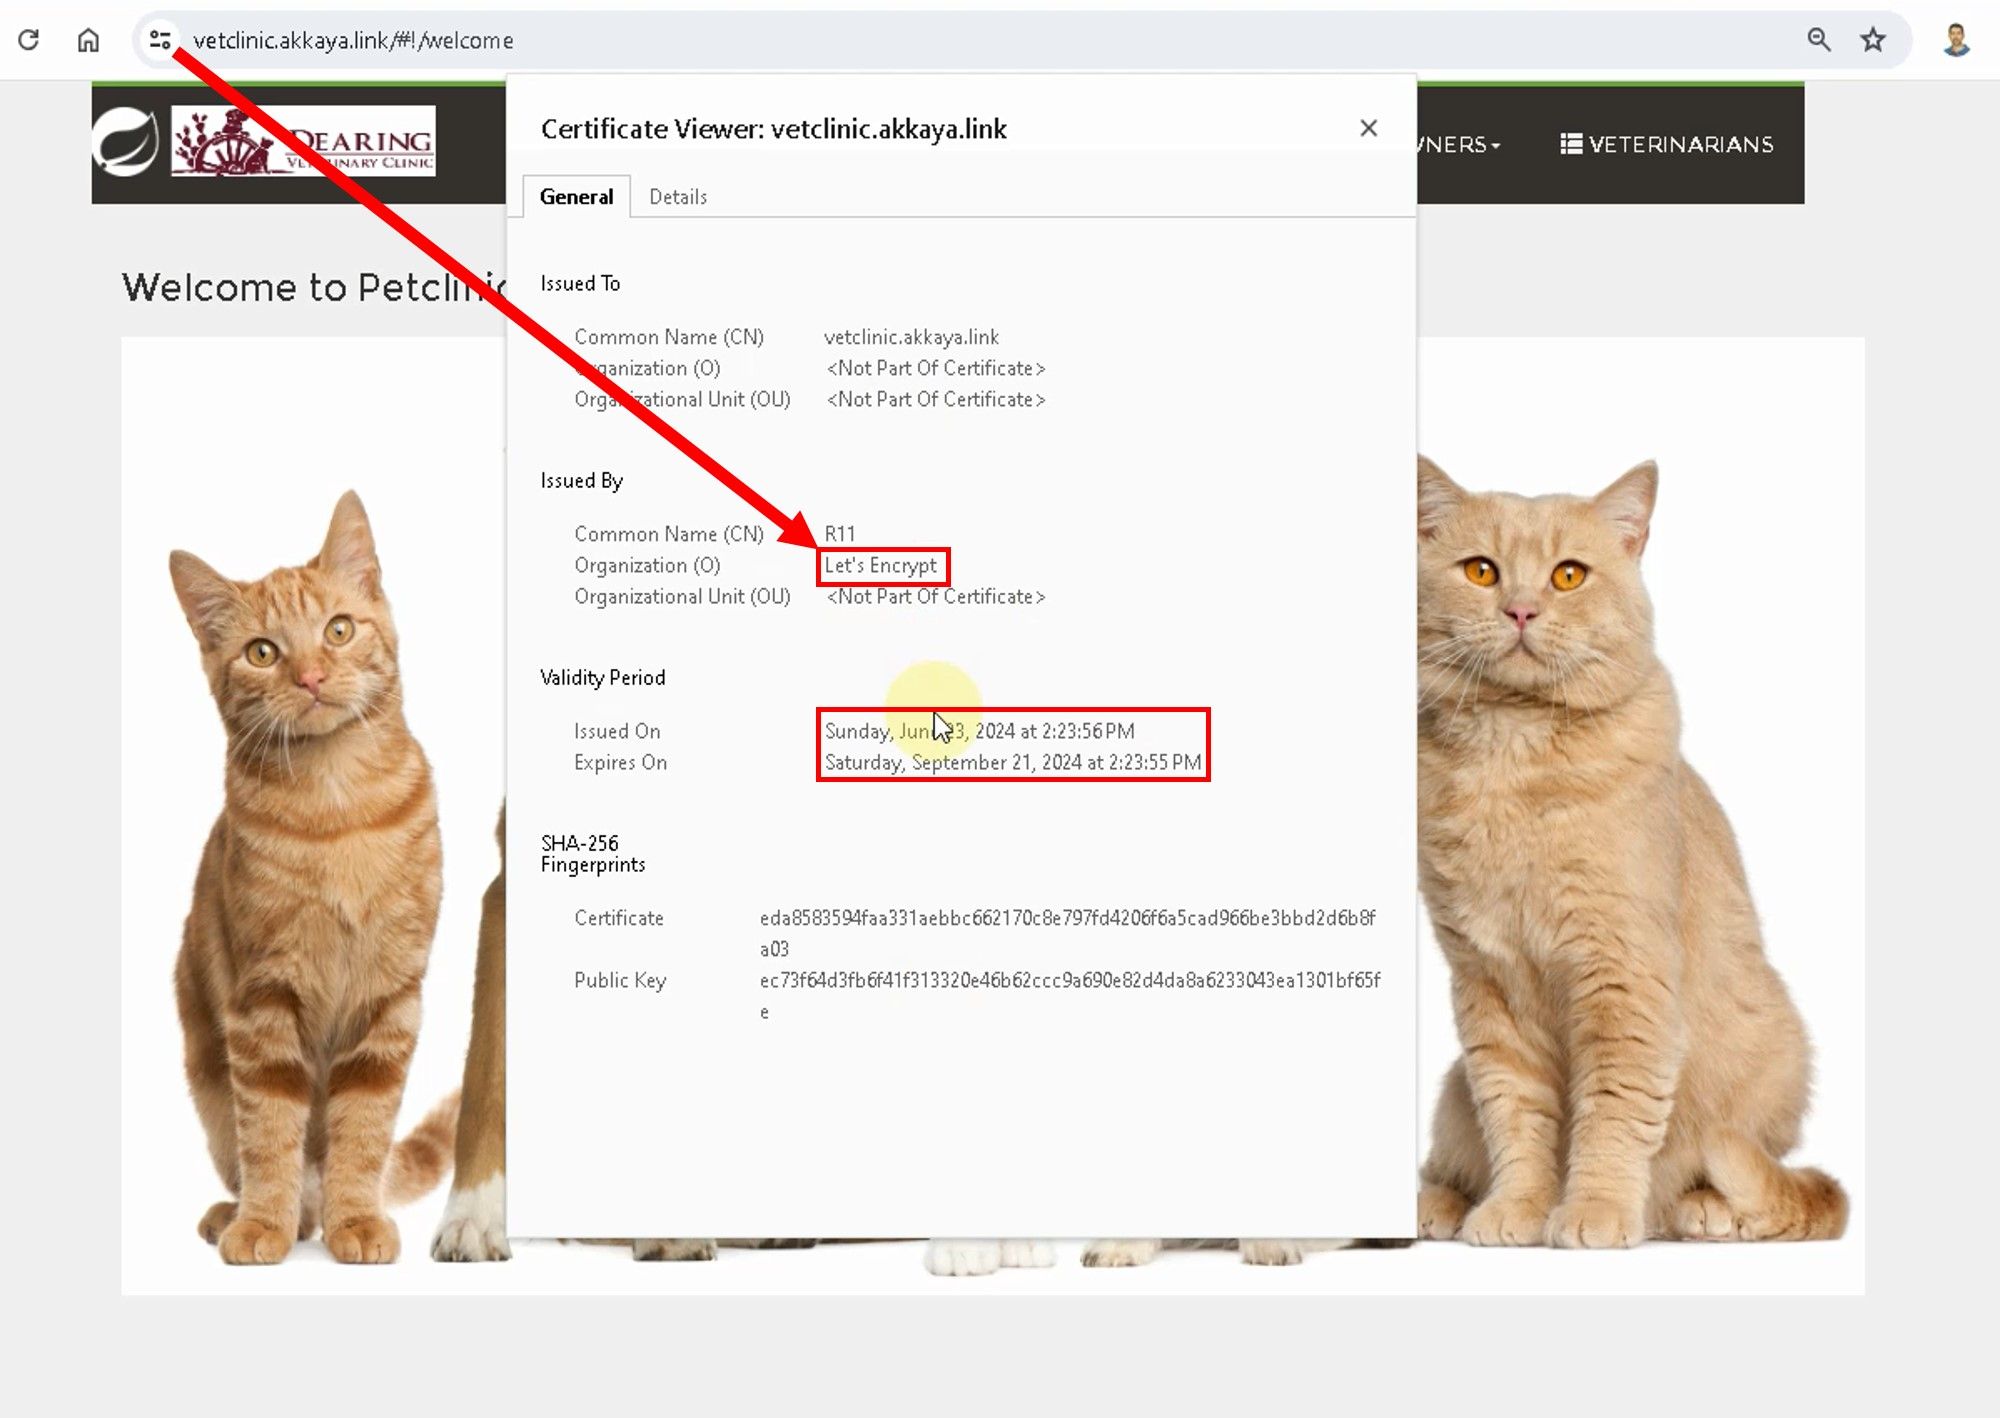
10. Checking the output of the CI/CD Pipeline on the browser.
We can check that we have received our 3-month valid certificate from Let’s Encrypt, as shown in the figures below.
 Amazon RDS MySql Database for customer records is running,
Helm Charts come into the S3 bucket,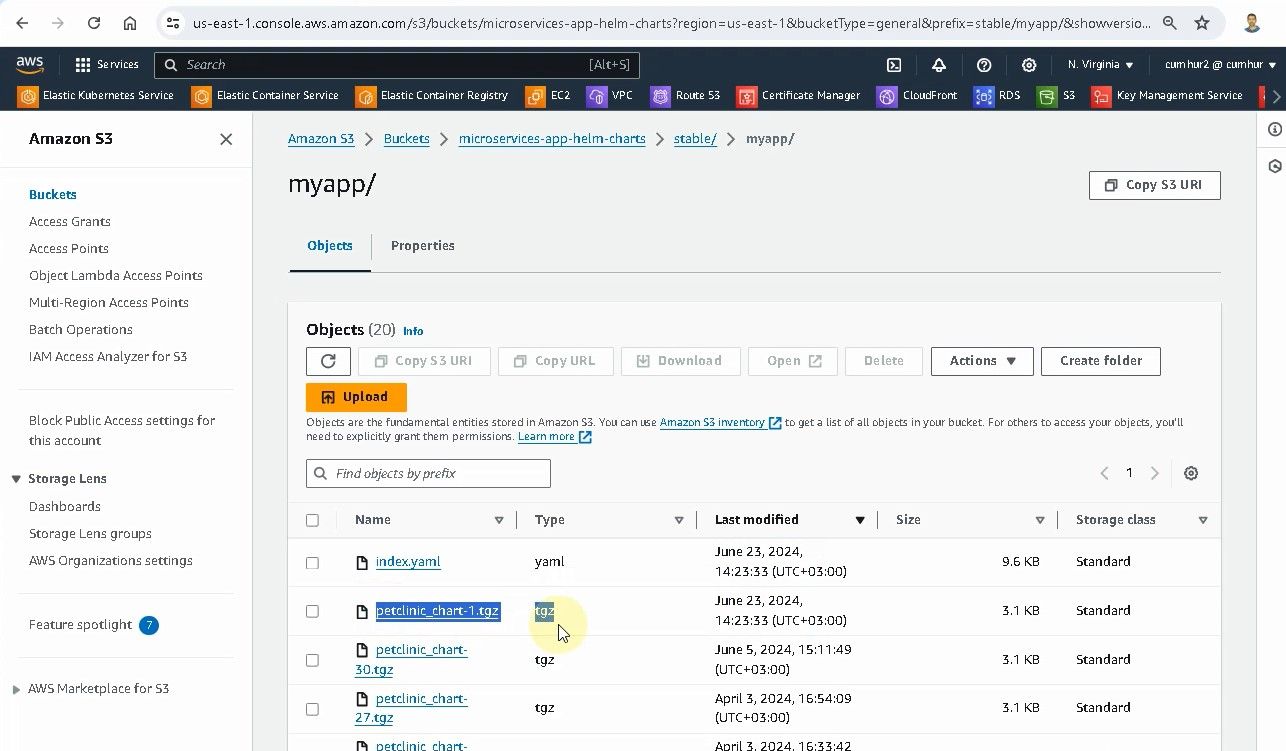
Load Balancer and Auto Scaling Group were created automatically,
 Docker container images come into the Amazon ECR Repository,
11. Monitoring Kubernetes Clusters on Amazon EKS with Anteon
There are various deployment options(3), we’ll use Anteon Cloud as a complete SaaS solution for Kubernetes Cluster Monitoring in this article. In my later articles, we will see other installation and usage methods of Anteon in practice with hands-on. Now, we’ll add the K8s cluster into the Anteon Cloud to start observability with nearly zero manual effort. If you do not want to manage the services, Anteon Cloud is the right choice for you.
11.1. Creating an Anteon Account
Go to https://app.getanteon.com/login and select Sign in with Google, as shown in the figures below (If you want, you can select Create an account to create an Anteon account, but I used the fastest method.).
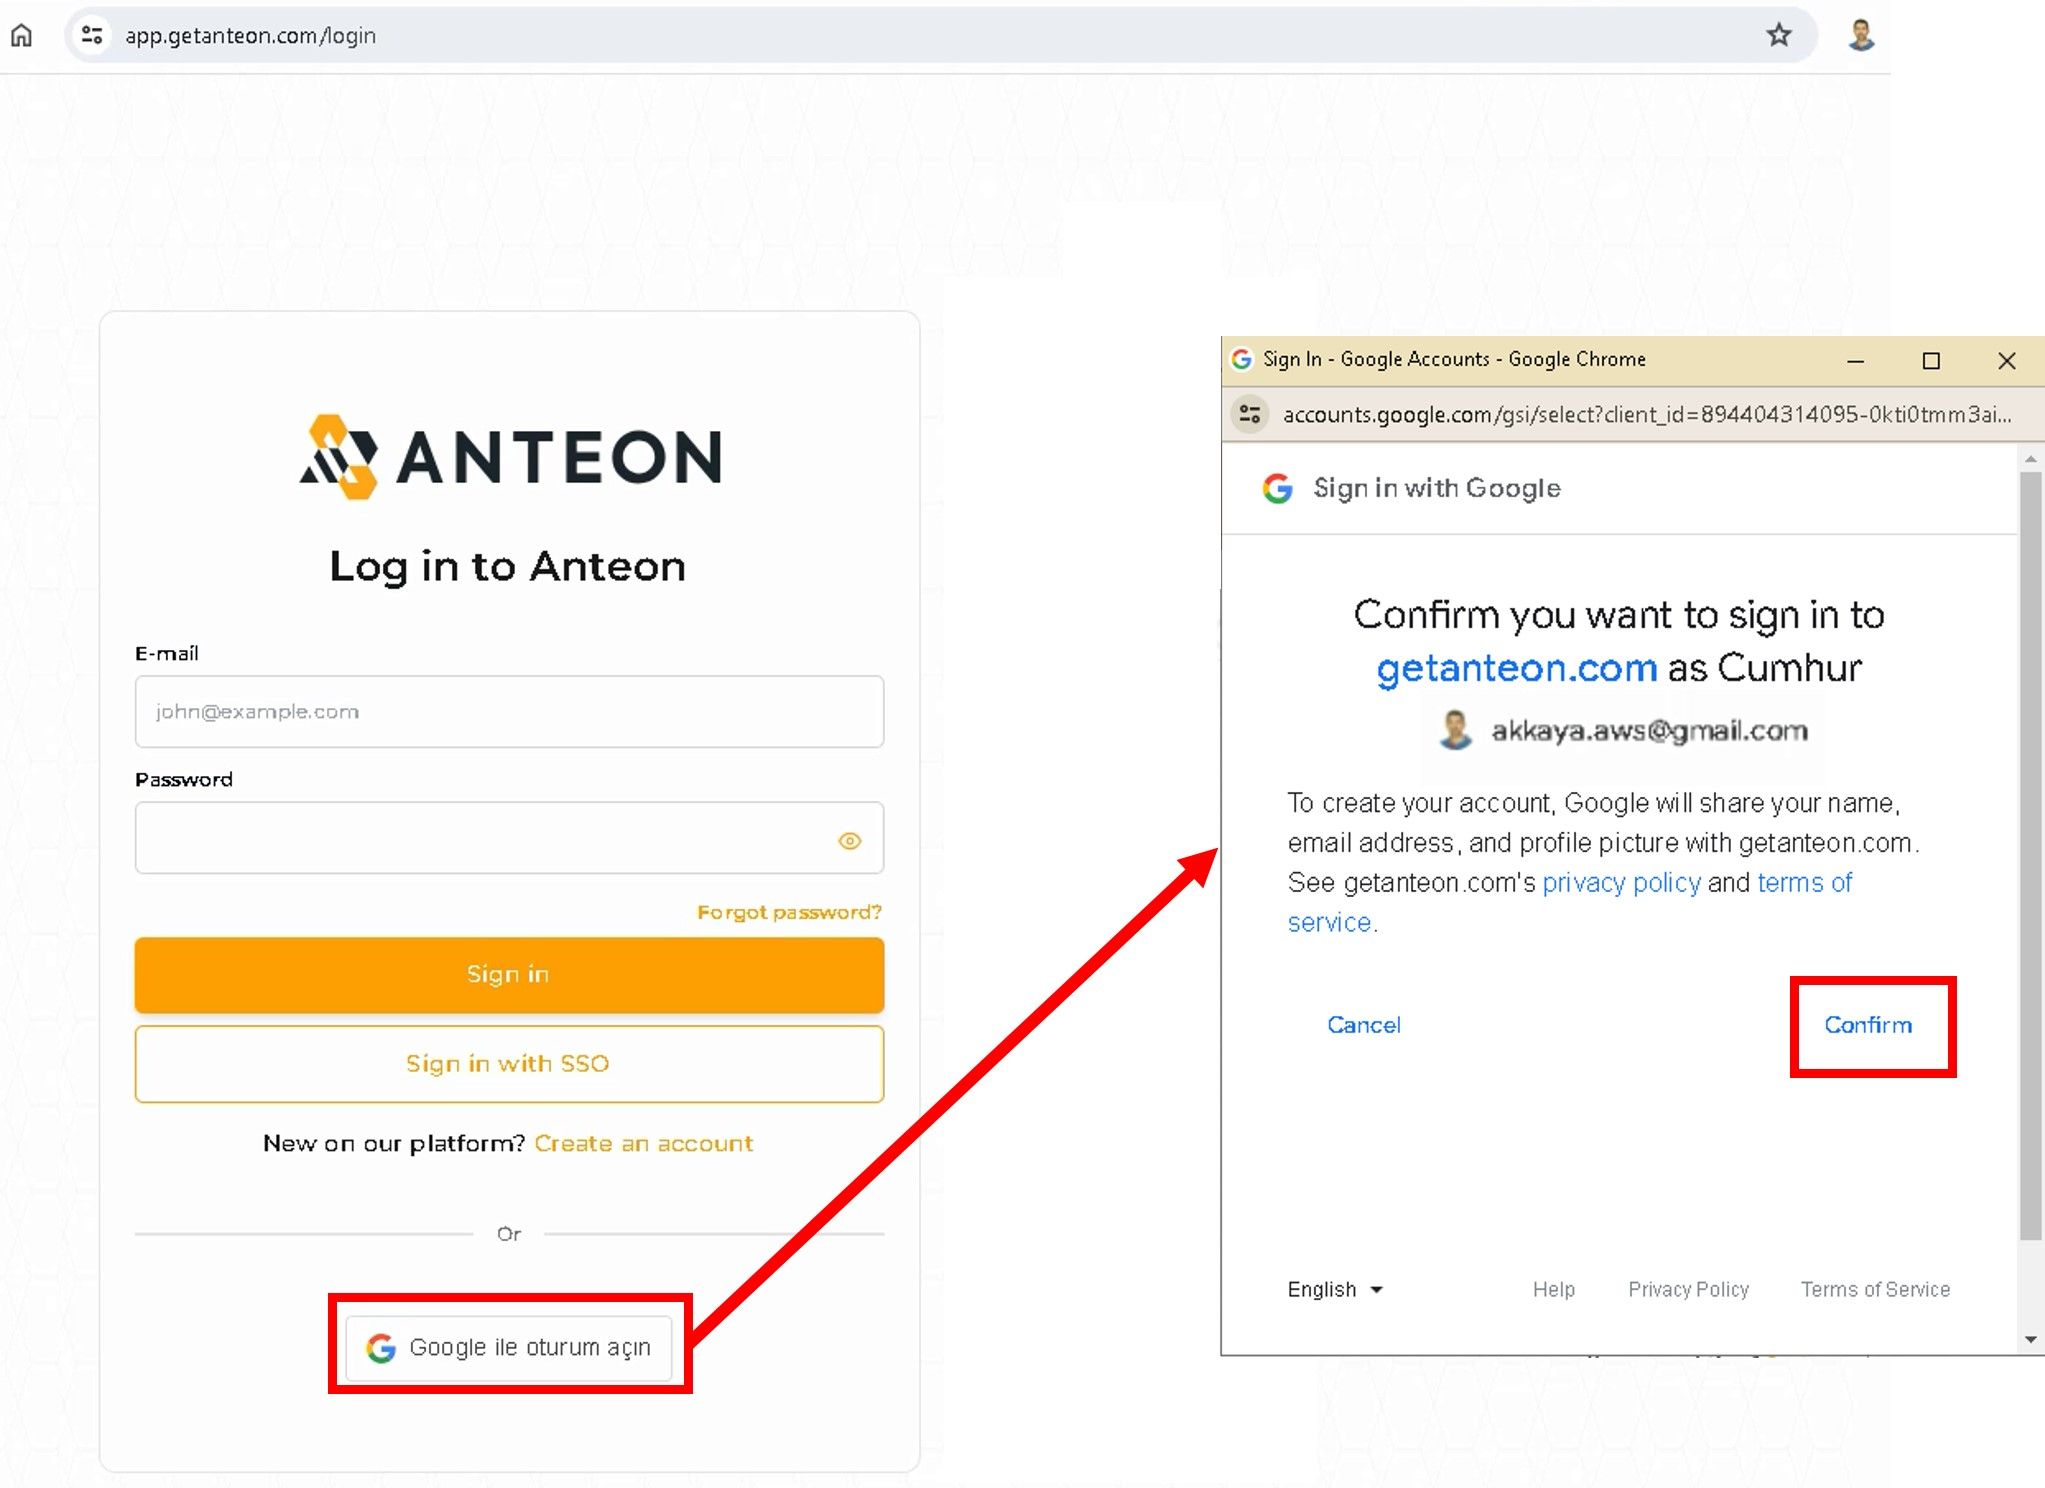
My registration to Anteon is completed and my 14-day free use of Anteon has started (The free trial lasts for 14 days or until your total usage exceeds $49, whichever comes first.), as shown in the figures below.
In Anteon Cloud; Pro at $99 per month. On the other hand, in the Self-Hosted; Community Edition is free but has some limitations(9). 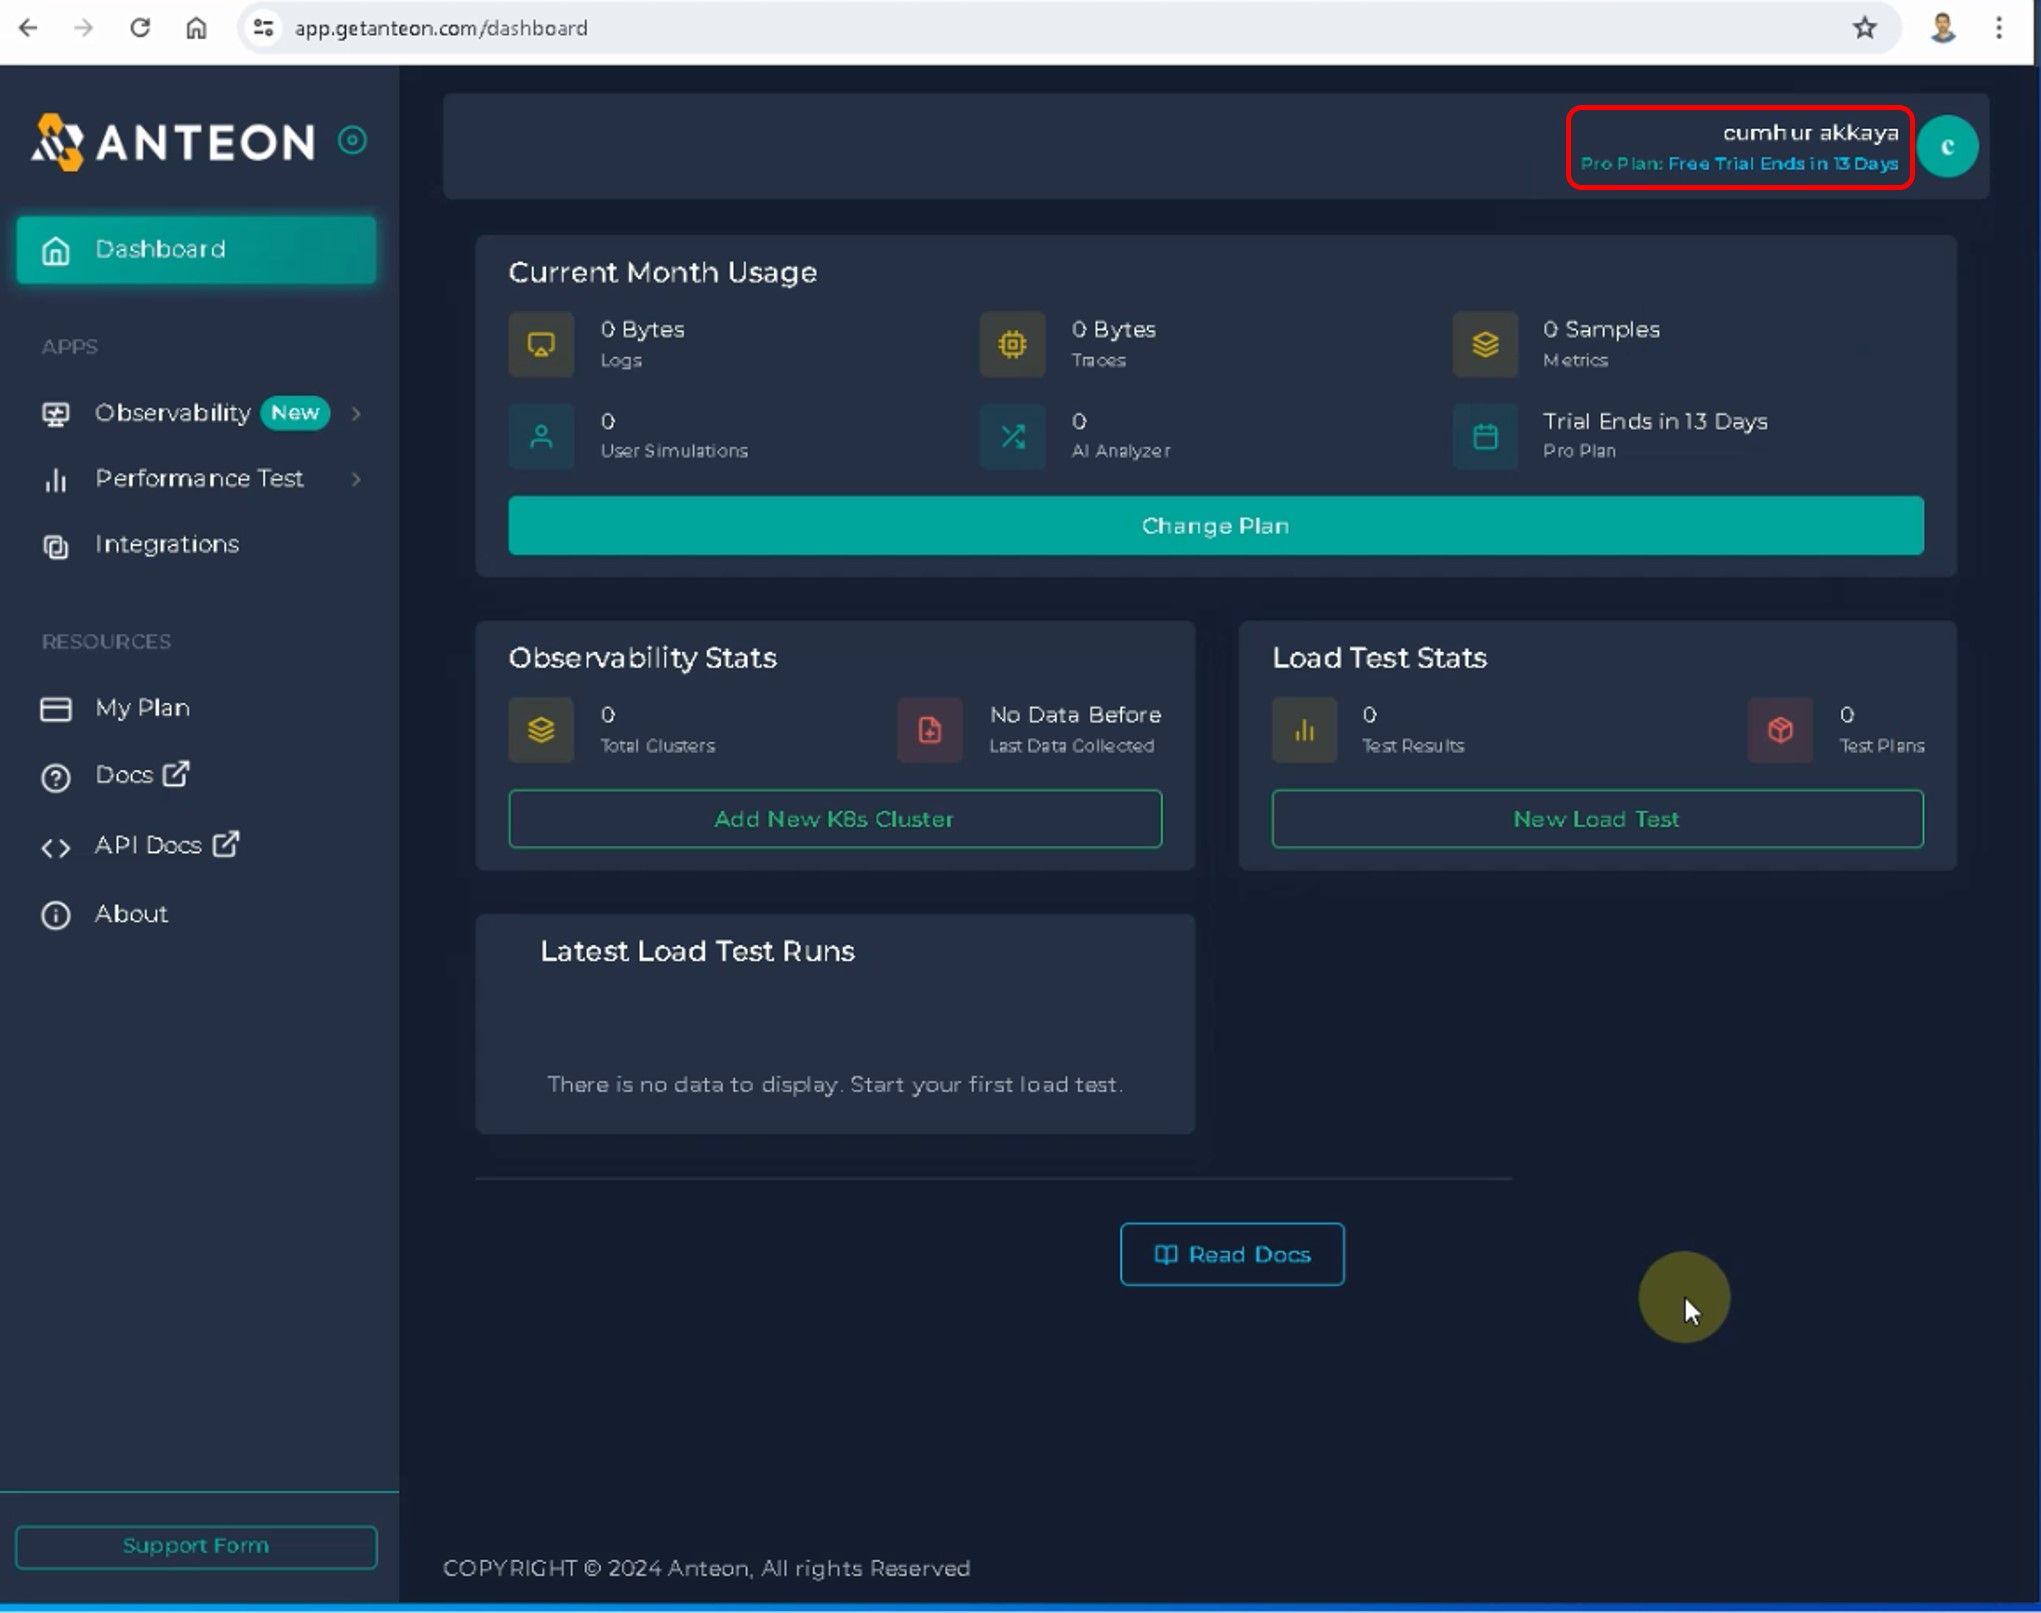
11.2. Using Anteon Cloud as a Complete SaaS Solution for Kubernetes Monitoring
We only need to run an agent (Alaz) as a DaemonSet on our Kubernetes cluster. Anteon will handle the rest of the work.
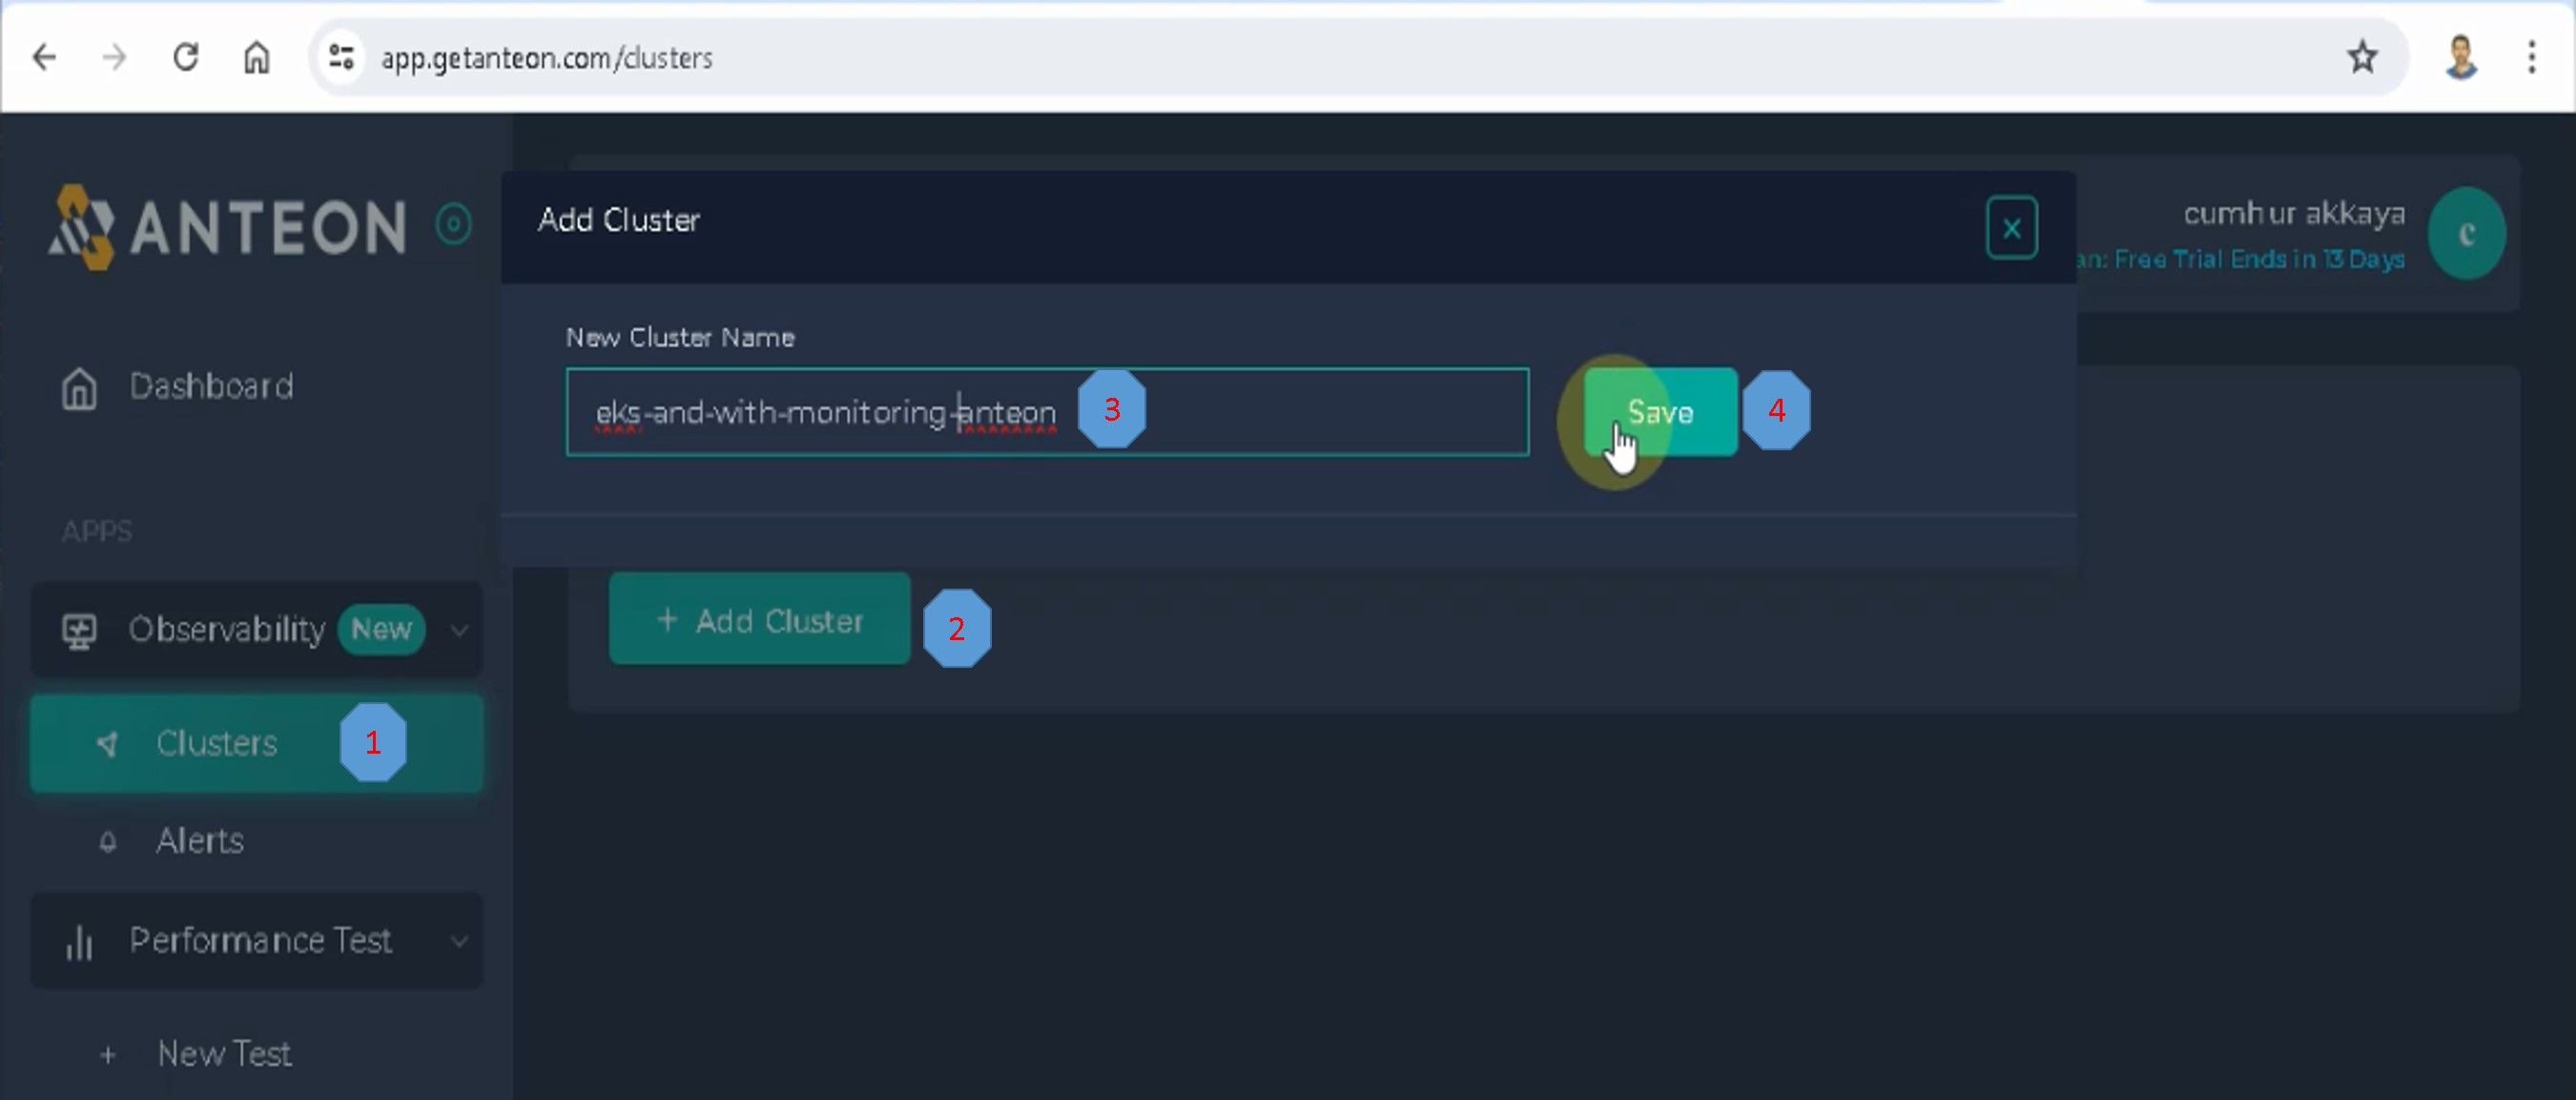
To start monitoring your Kubernetes Cluster, we need to create a new Cluster on the Anteon platform. To achieve this, navigate to the Clusters page and click the Add Cluster button. Enter a unique name for the Cluster, and then click on the Save button, as shown in the figures below.
Click on the Set Up Cluster button, as shown in the figures below.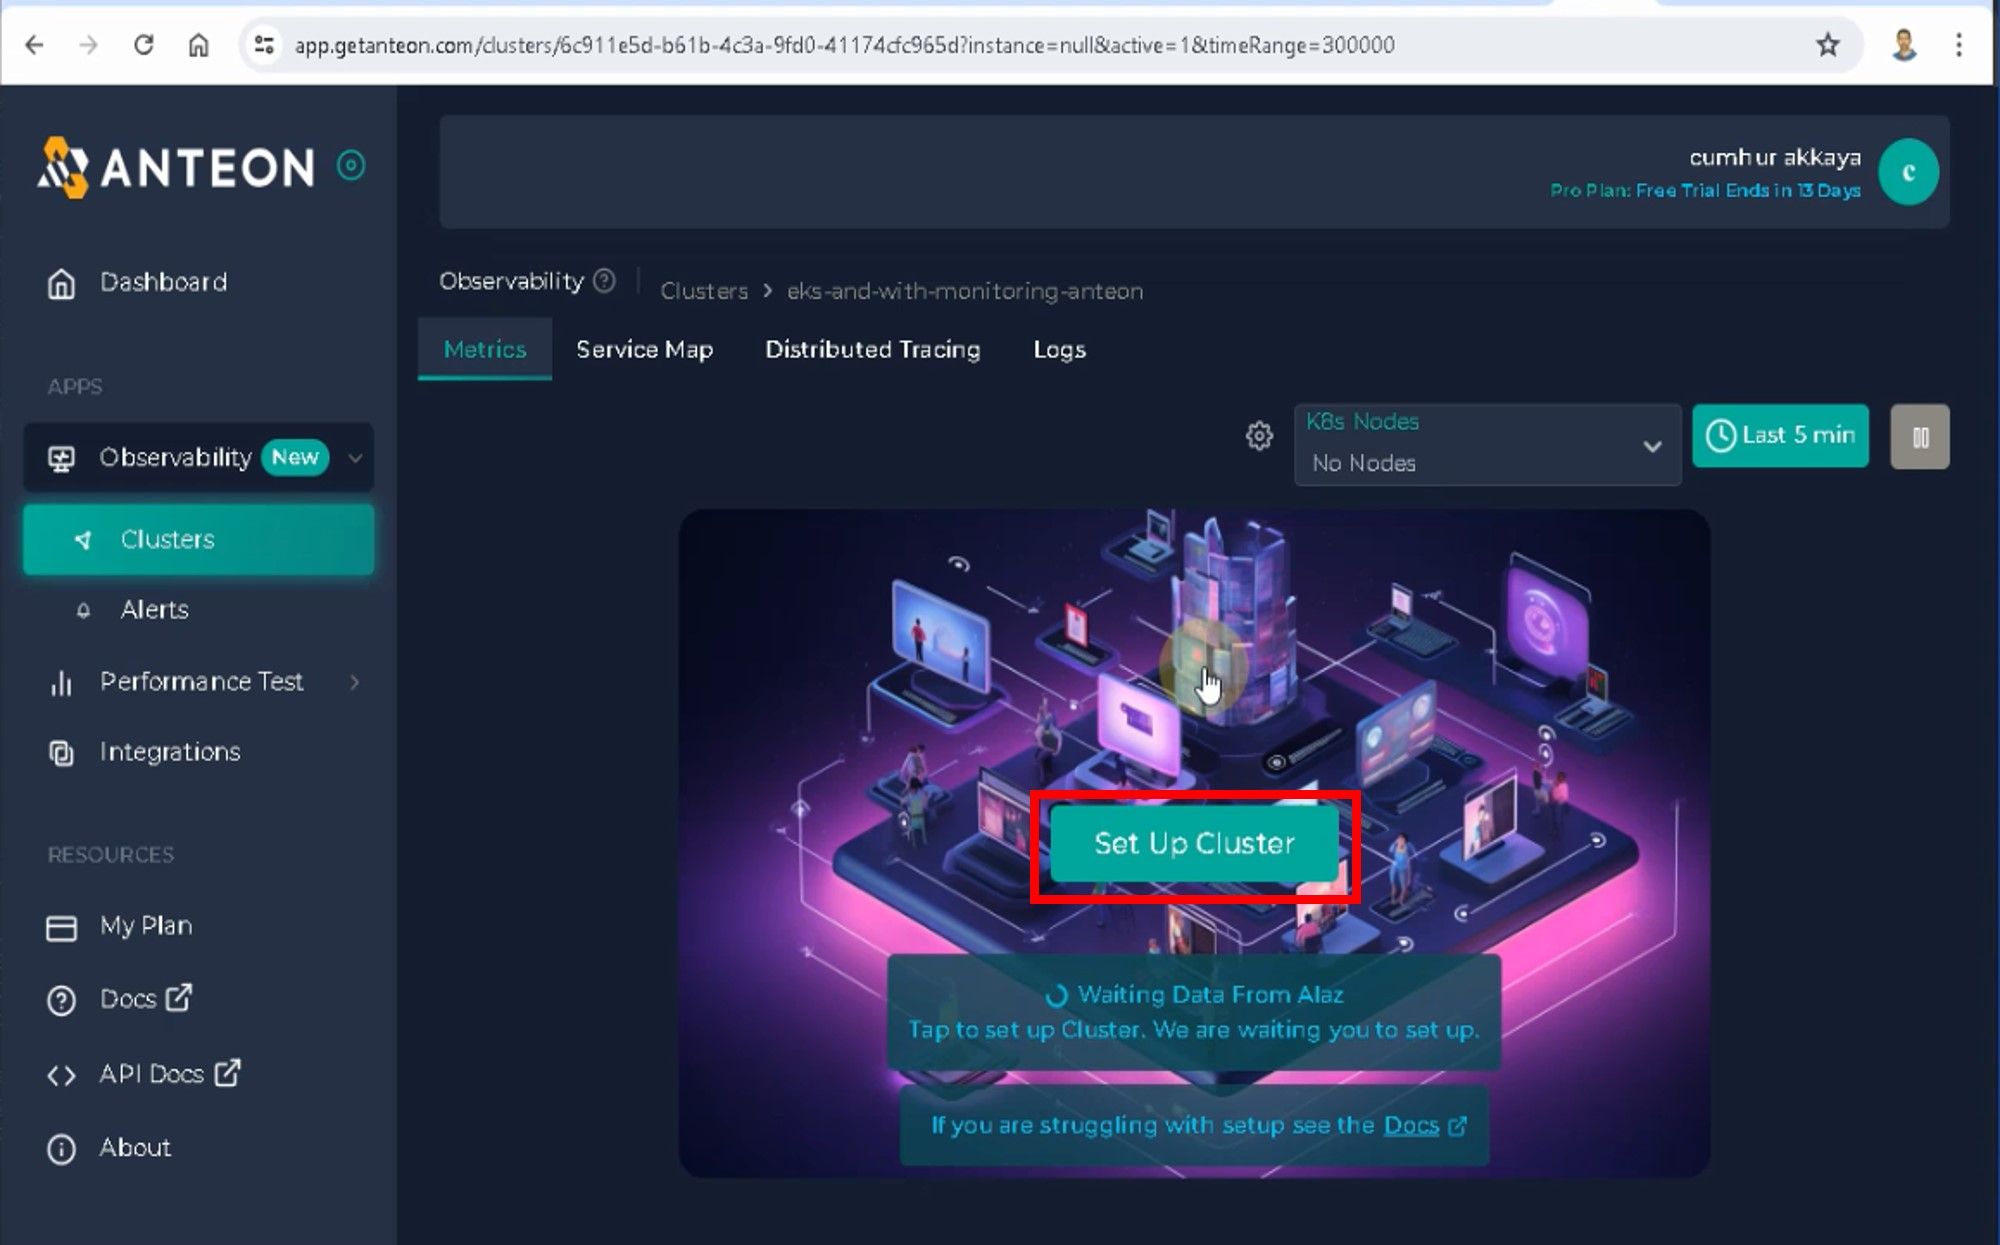
A pop-up will open and show you how to install Alaz via Kubectl or Helm, I chose Kubectl and then clicked on the Copy button, as shown in the figures below.
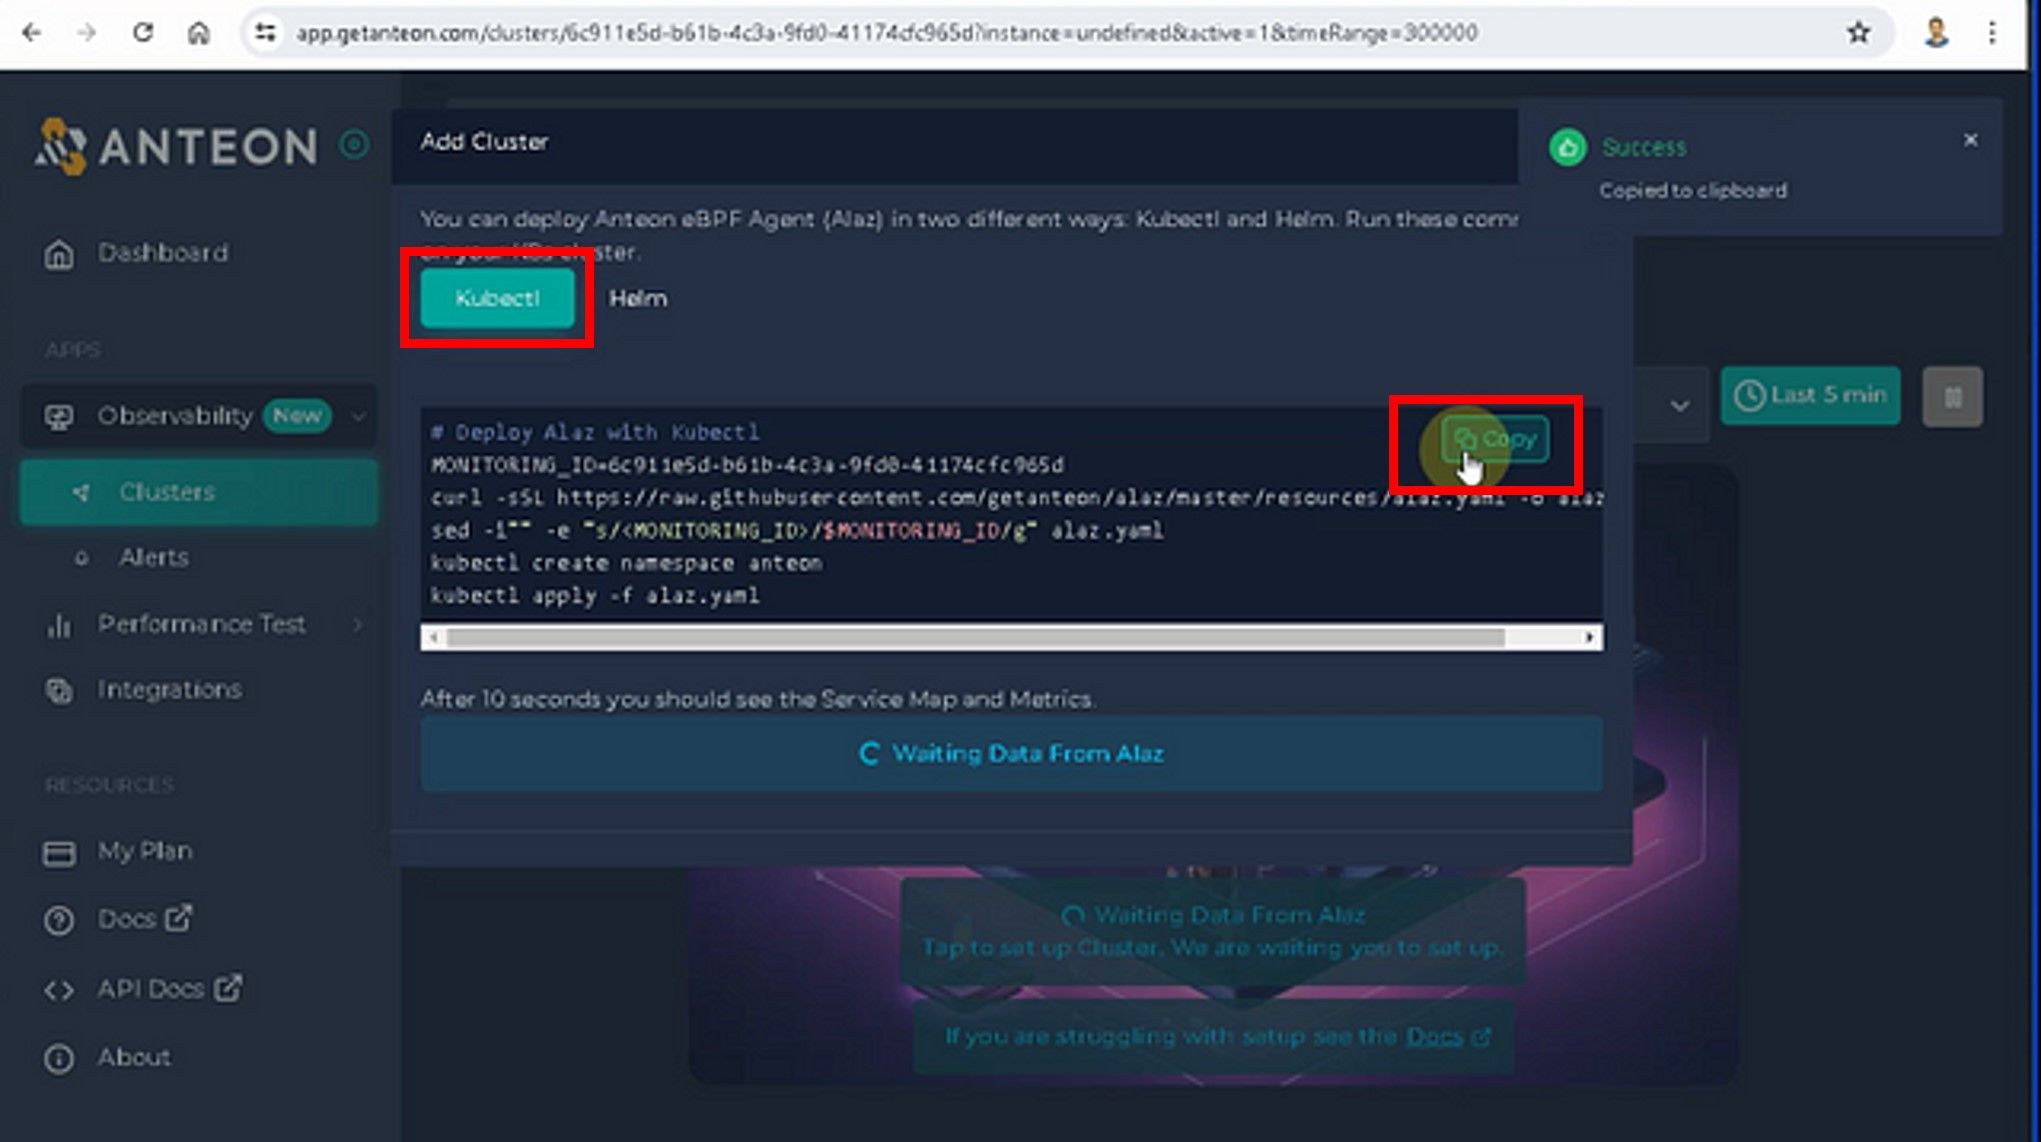
I pasted this code into my cluster, thus it installed Alaz as a DaemonSet in my cluster.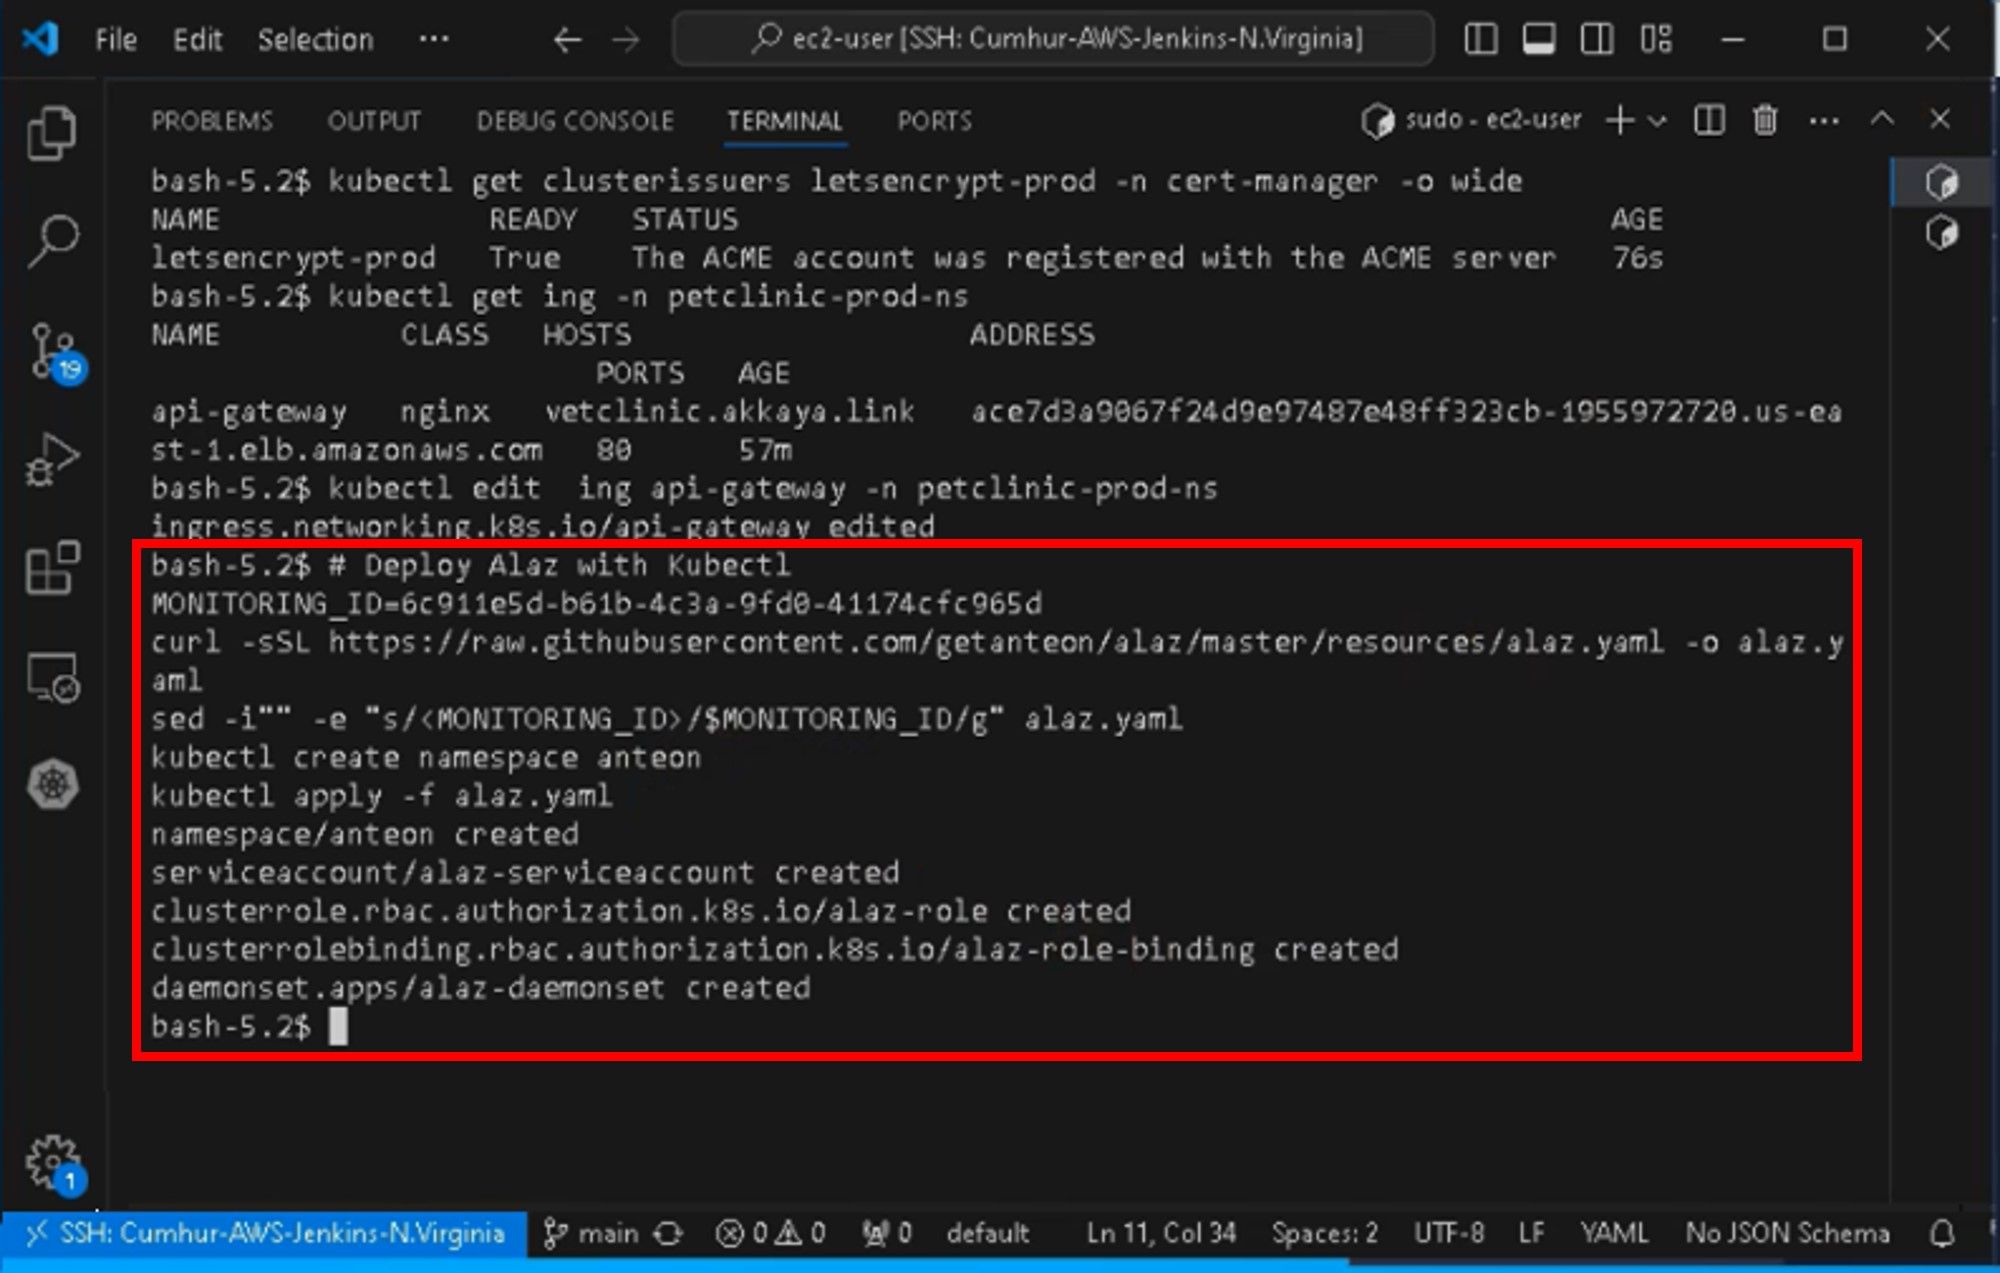
After a few seconds, the Service Map and Metrics Dashboard will be ready on Anteon. The entire installation was completed in less than a minute.
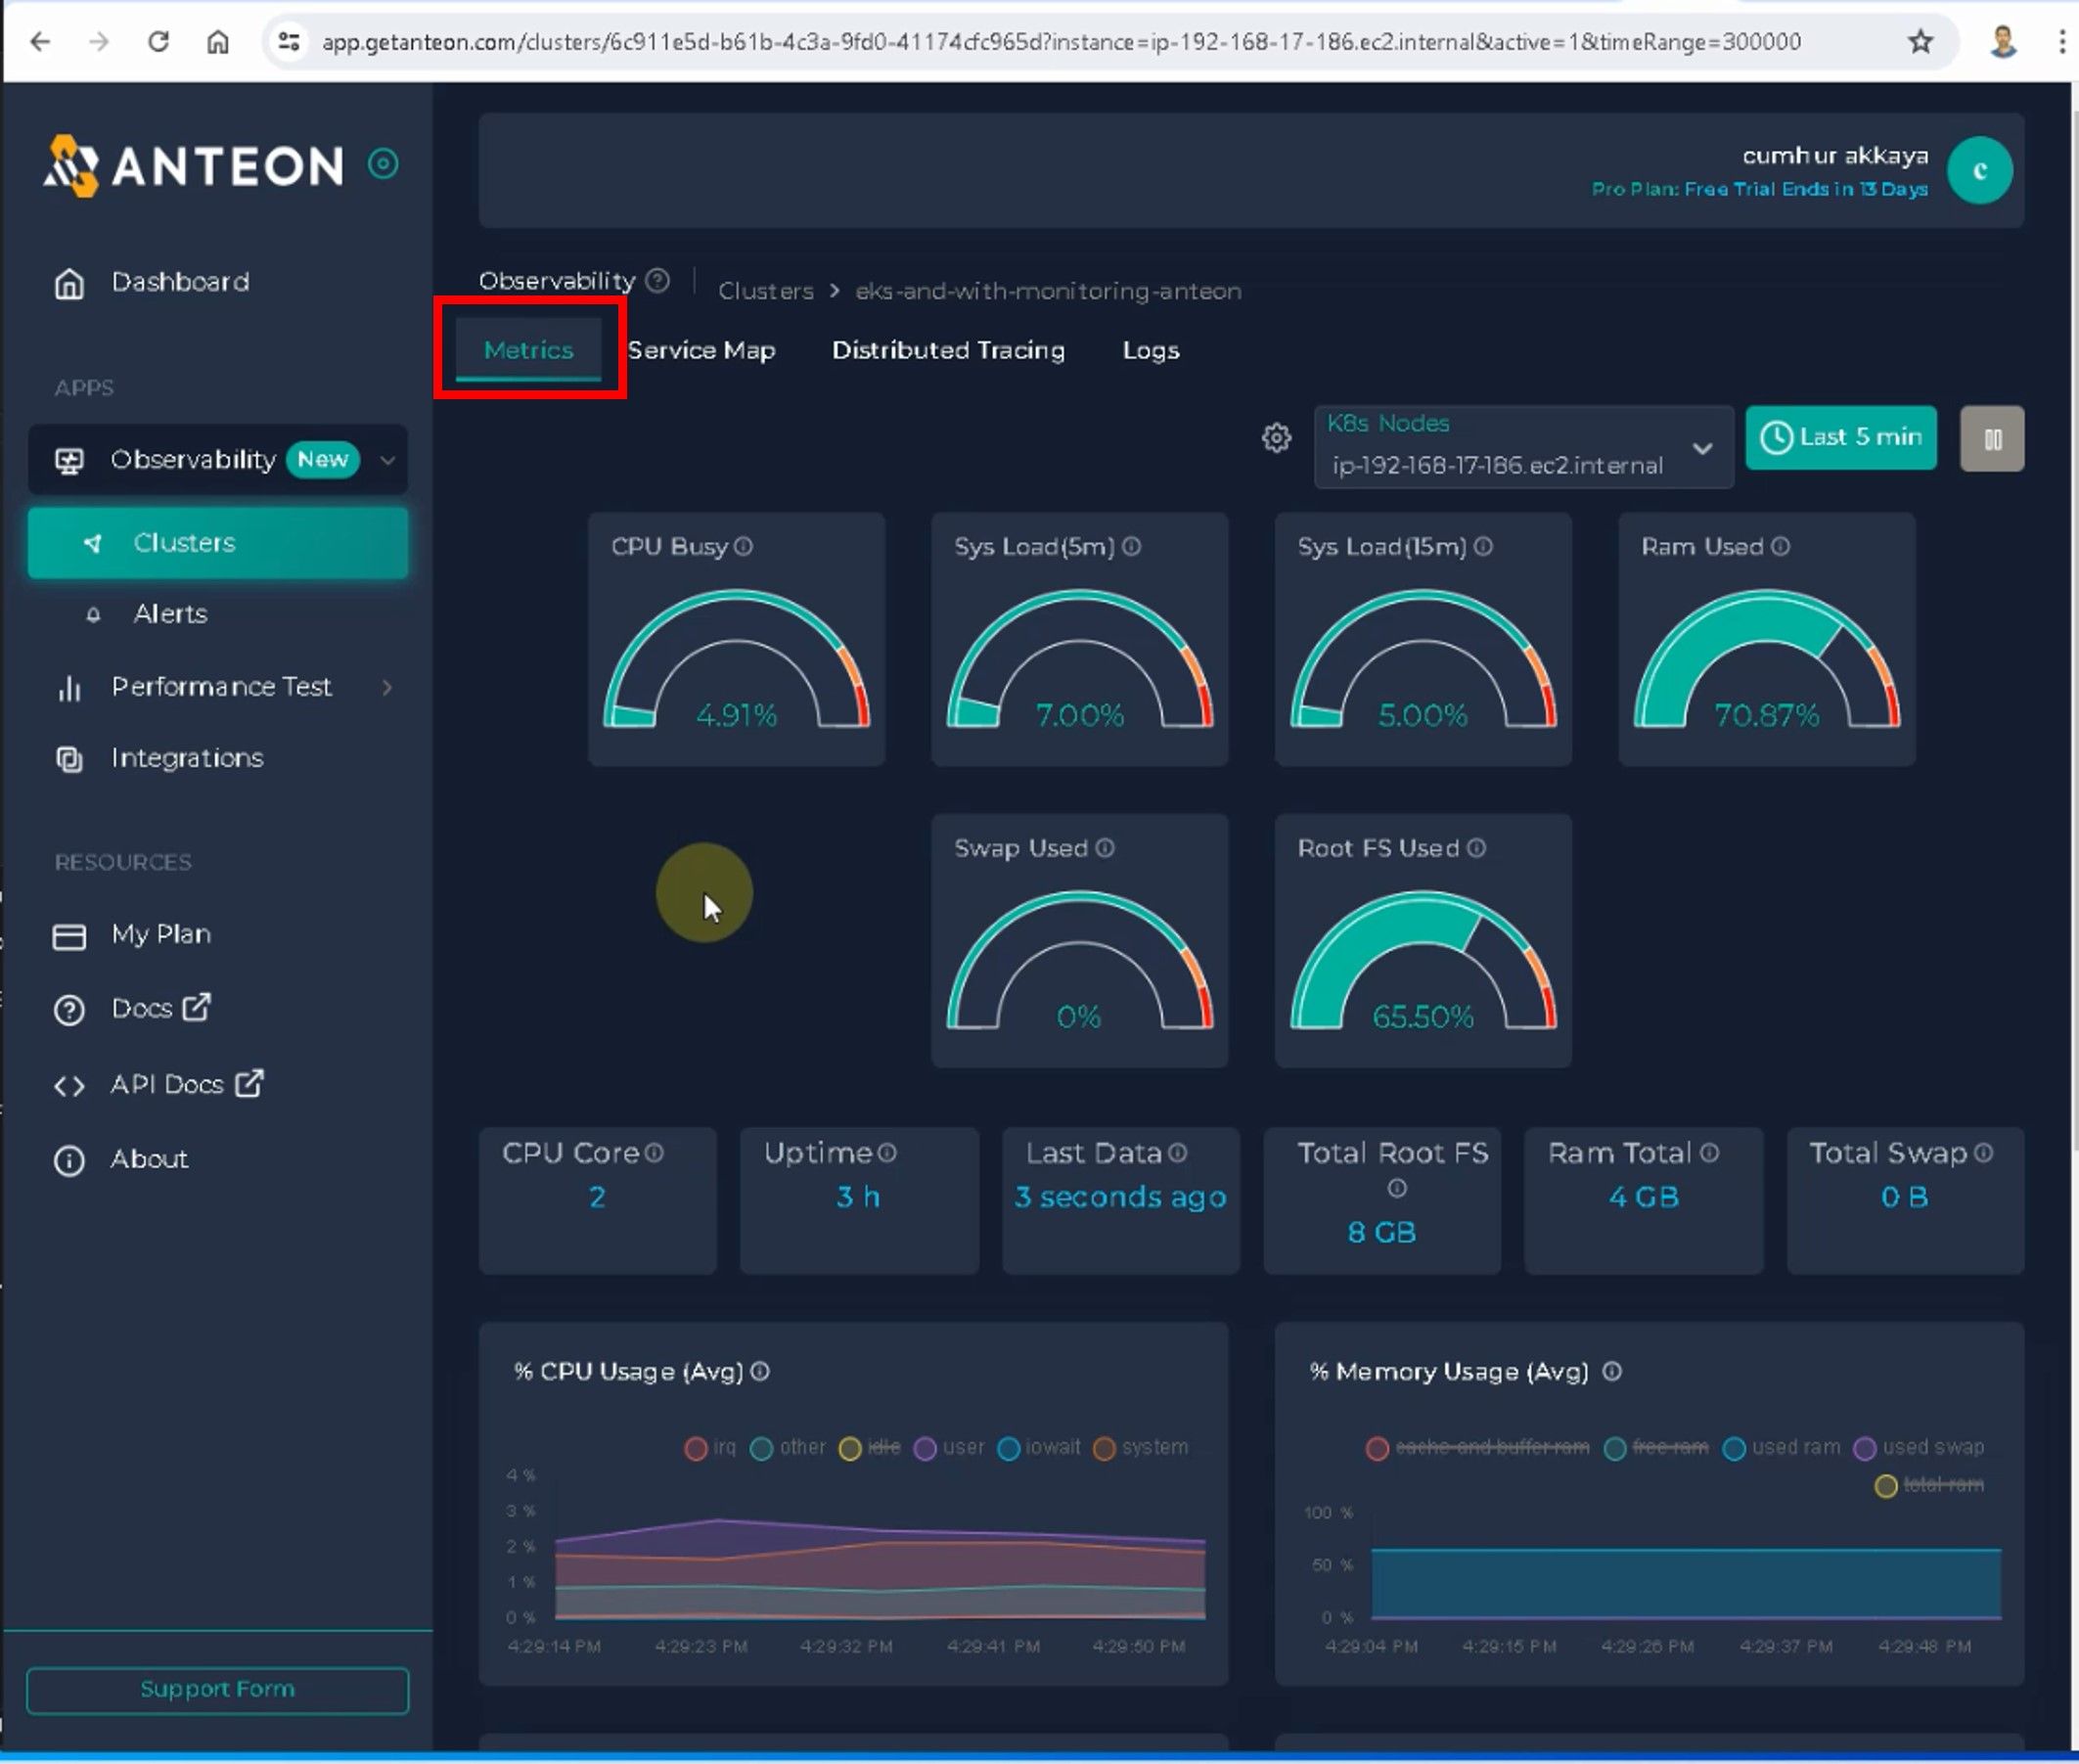
11.3. Viewing Statistics About The Kubernetes Instances Using Kubernetes Metrics
We can analyze cluster metrics with live data on our CPU, memory, disk, and network usage of our cluster instances in the Metrics section, as shown in the figure below.
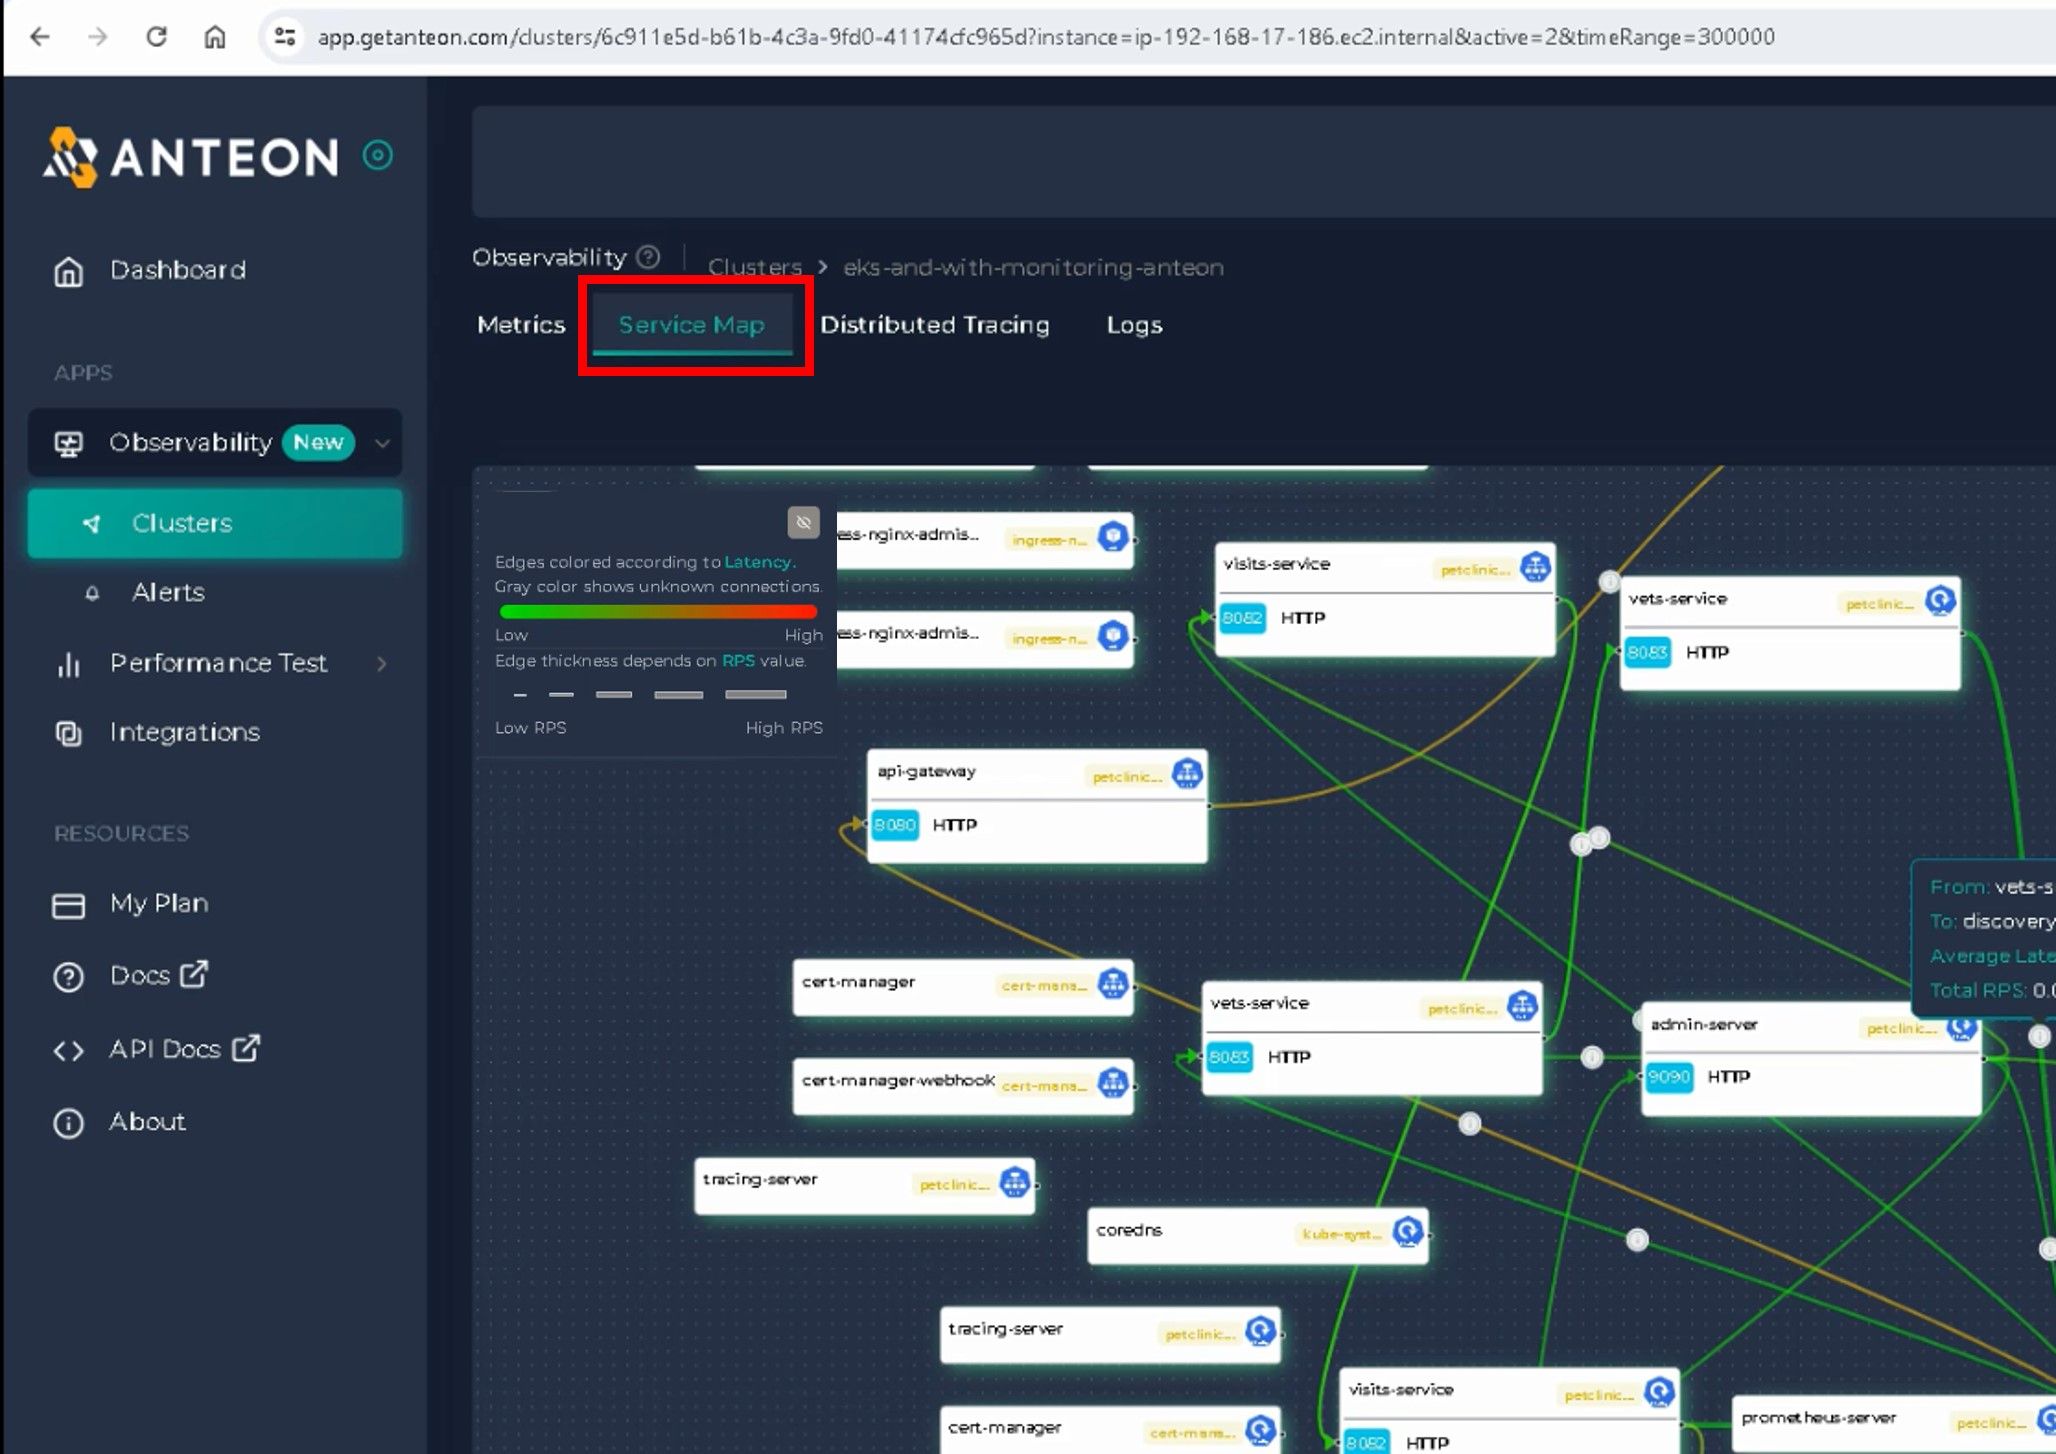
11.4. Viewing The Interactions Between The Resources in The K8s Cluster Using Anteon Service Map
We can view the interactions between the resources in the K8s Cluster with the Service Map section, as shown in the figures below. In this section, we can easily find answers to the below questions(10):
- What is the average latency between service X and service Y?
- Which services have higher/lower latency than XX ms?
- Is there a Zombie Service on your cluster? etc.
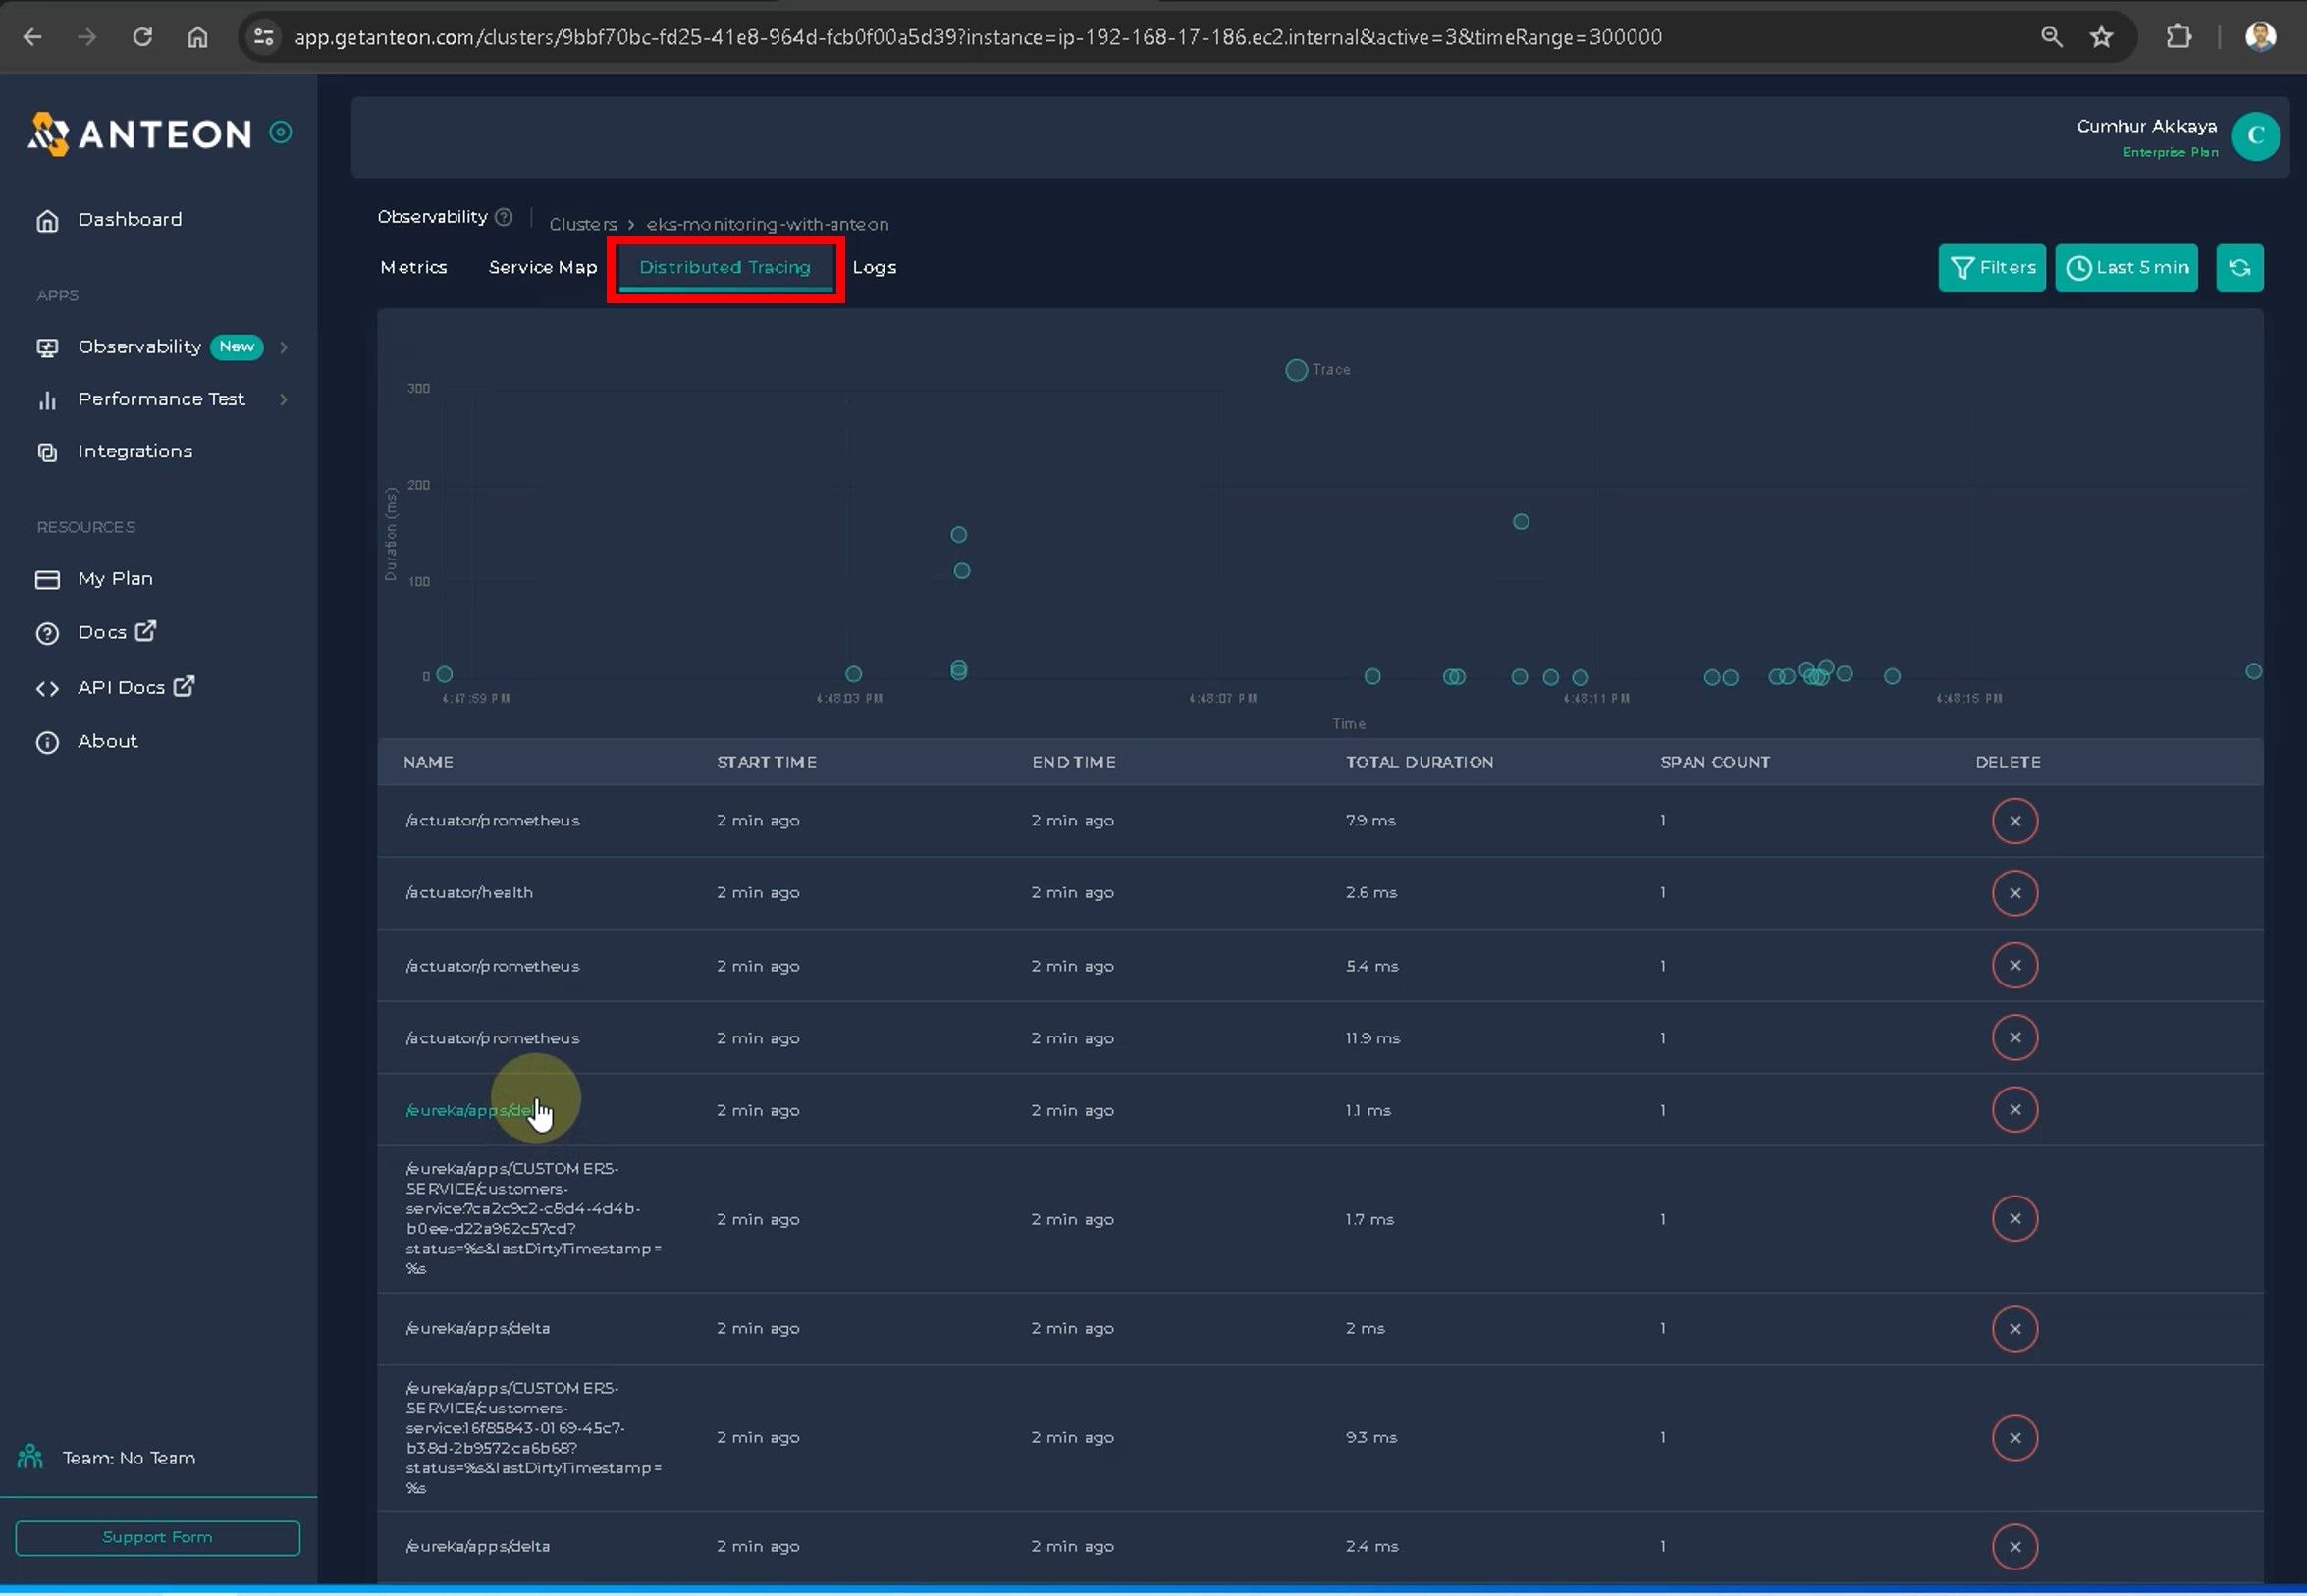
11.5. Viewing Distributed Tracing
Distributed Tracing enables tracking of requests as they pass through the microservices in a system, as shown in the figure below. We can filter and view traces in chart and list form.
11.6. Viewing Cluster’s Logs
We can also see the logs of our cluster in the log tab, as shown in the figures below.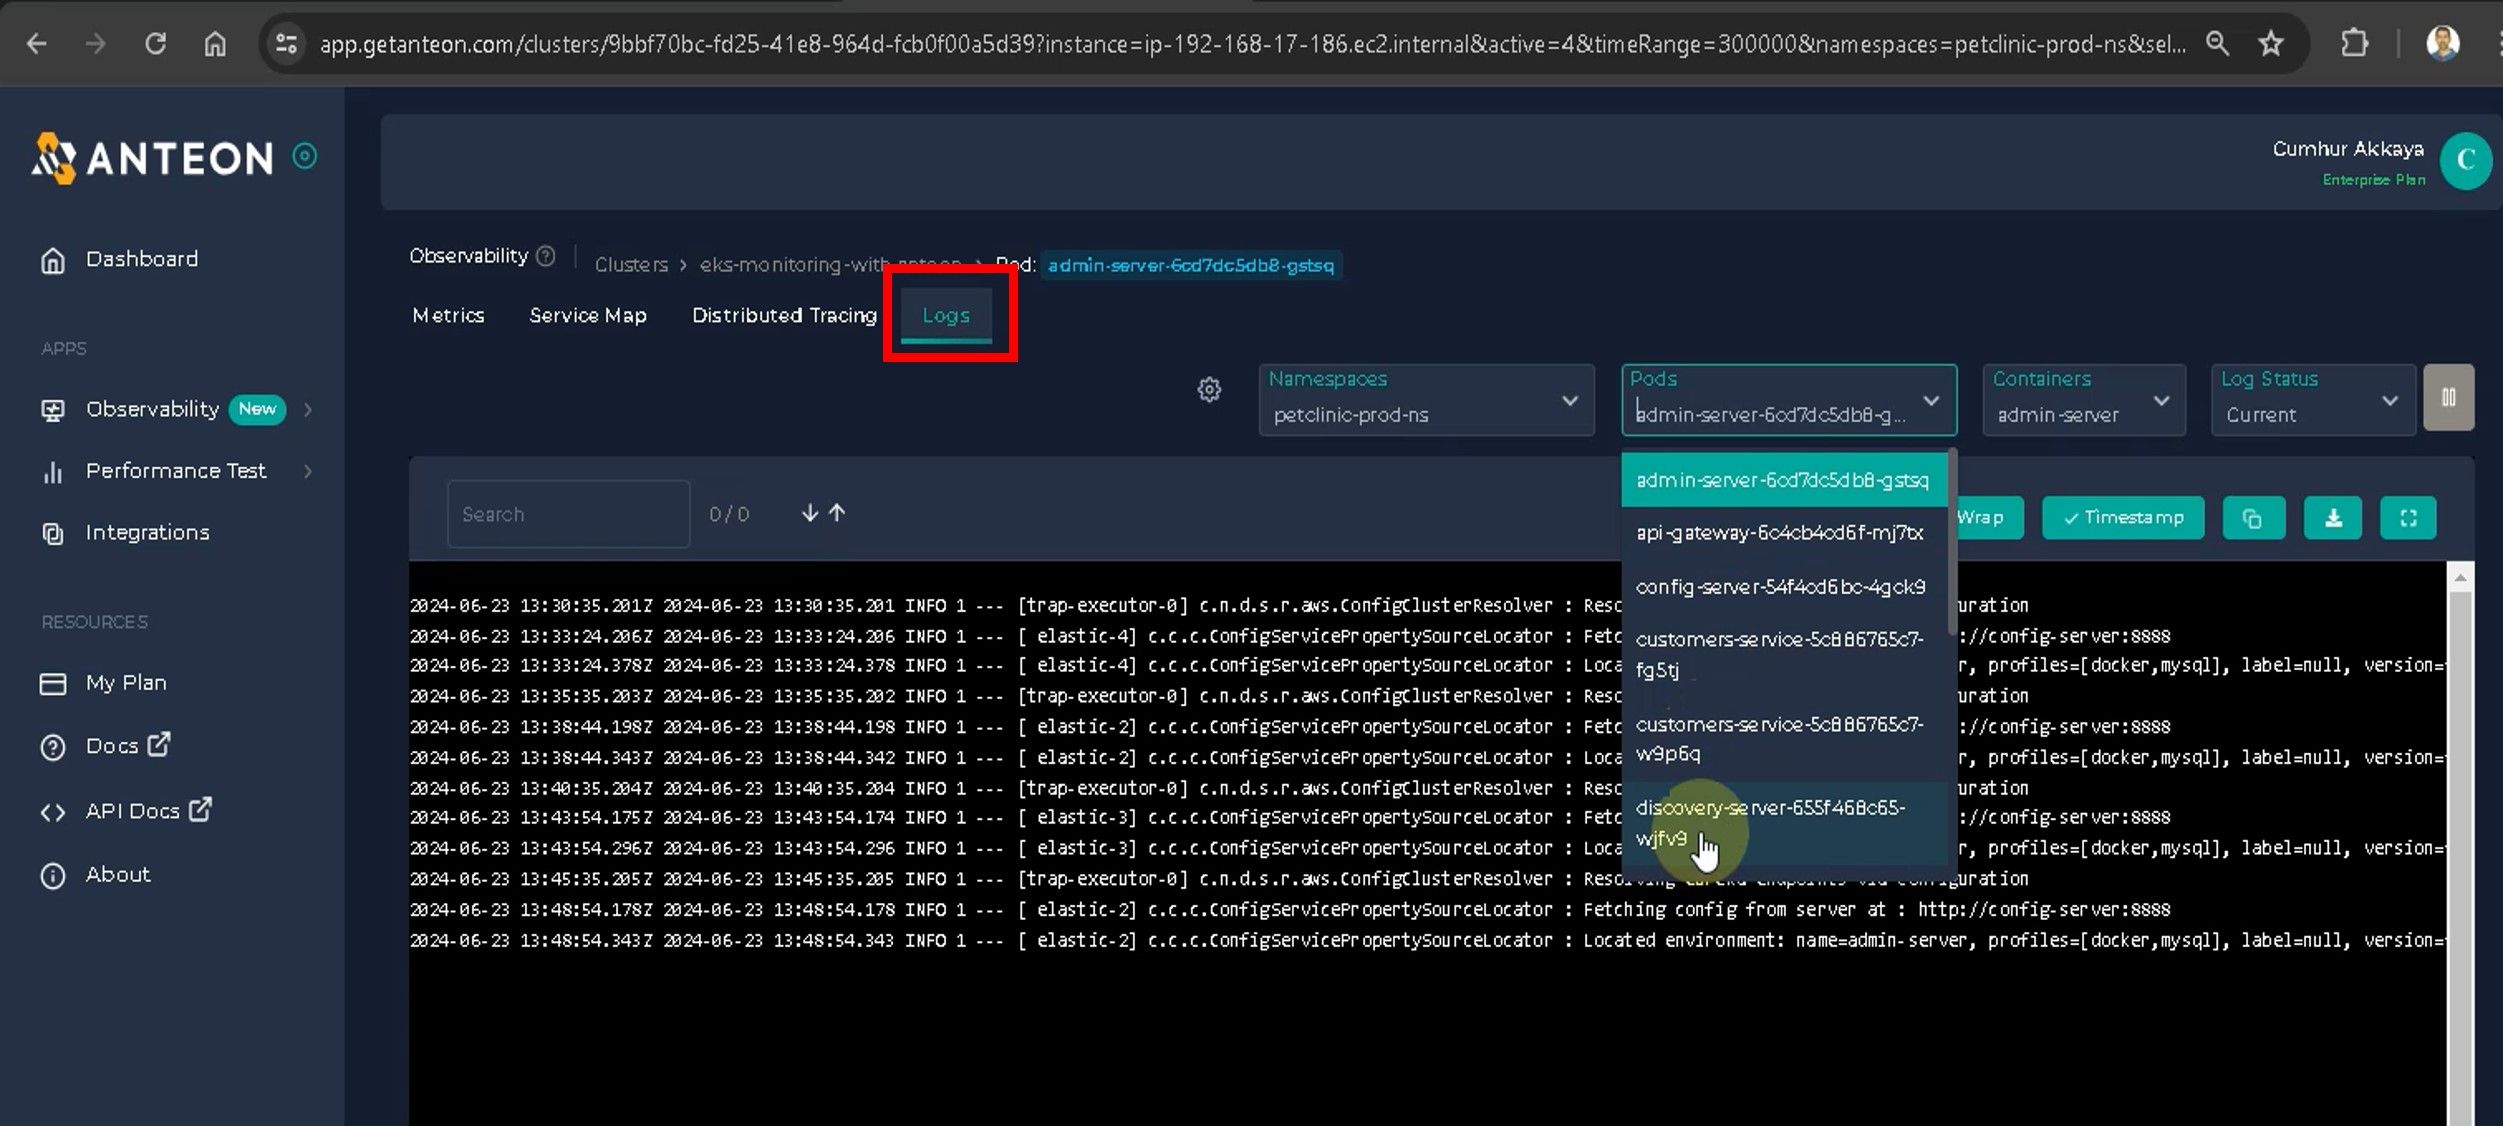
12. Setting an alarm for the K8s Cluster Using Anteon Alerts, and Getting an Alerting Message Via Mail When Running a Dummy Load
Anteon monitors CPU, memory, disk space, and network usage. Anteon sends alerts via Anteon Alerts when exceeding thresholds in the Kubernetes cluster.
12.1. Anteon Alerts’ key features and benefits
- Comprehensive Monitoring: Continuously tracks the health of your system’s vital signs like CPU, Memory, Disk, and Network.
- Customizable Alerts: Set up alerts based on specific conditions that matter to you.
- Scalable: The system scales with your needs, whether you’re monitoring a single node or a thousand nodes.
- Integrative: Seamlessly integrates with popular platforms like Slack, Email, Opsgenie, and Webhooks for streamlined notifications(11).
Now, we will set an alarm regarding CPU usage to receive the alert via e-mail.
12.2. Creating an Alert
Click on the + Add Alert button on the Alerts tab. Enter your Alert Name and select your Kubernetes Cluster.
Then, enter the values below and click on the Save alert button to save the alert, as shown in the figures below.
Metrics: CPU Busy Percent
Threshold: Creater Than
Threshold Value: 50
Priority: P2 High
Tags: eks-monitoring            # Optional
Window Duration:30
Email: cmakkaya.aws@gmail.com   # Change it with your email
- The Monitor All Current & Future Nodes checkbox is selected by default. This means all current and future nodes will be monitored, irrespective of the K8s autoscale. However, if you want to monitor only specific nodes, you can uncheck the Monitor All Current & Future Nodes checkbox and manually select the nodes you want to monitor.
- Priority, which will be used for urgency level. P1 represents the highest priority, while P5 is the lowest. This helps prioritize response to alerts and is used for escalation in integrated systems like Opsgenie and PagerDuty.
- Window Duration to specify the time window when the metric value should meet the threshold condition to trigger an alert. This helps prevent false positives and ensures consistent problematic behavior before alerting. All the data points in the window duration should be alerted to make an alert. For example, in this configuration, an alert will be triggered if the CPU Busy Percent exceeds 50 for at least 30 seconds.
- By default, your e-mail address is used for notifications. You can add additional e-mail addresses by clicking the Add New Recipient button.
Every 30 seconds, the condition will be checked, and if an alert is triggered (11).

On the Alerts page, we can see our alert as a list. Status columns can be OK if everything is fine and Alert if there is an alert condition.
12.3. Running The Dummy Load
Now, we will create a load for our cluster using Ddosify Engine. Ddosify Engine is a high-performance load-testing tool, written in Golang. We will use the Ddosify Engine docker image to generate a load to our cluster.
docker run -it --rm ddosify/ddosify ddosify -n 10000 -t 100 -m GET -t https://vetclinic.akkaya.link
This command will generate 10000 requests over 100 seconds to the target endpoint. You can change the number of requests and the test duration by changing the `-n` and `-t` parameters. You can also change the HTTP method by changing the `-m` parameter.
We observe the CPU Busy value of the system from Anteon Metrics. The CPU Busy value is normal for now.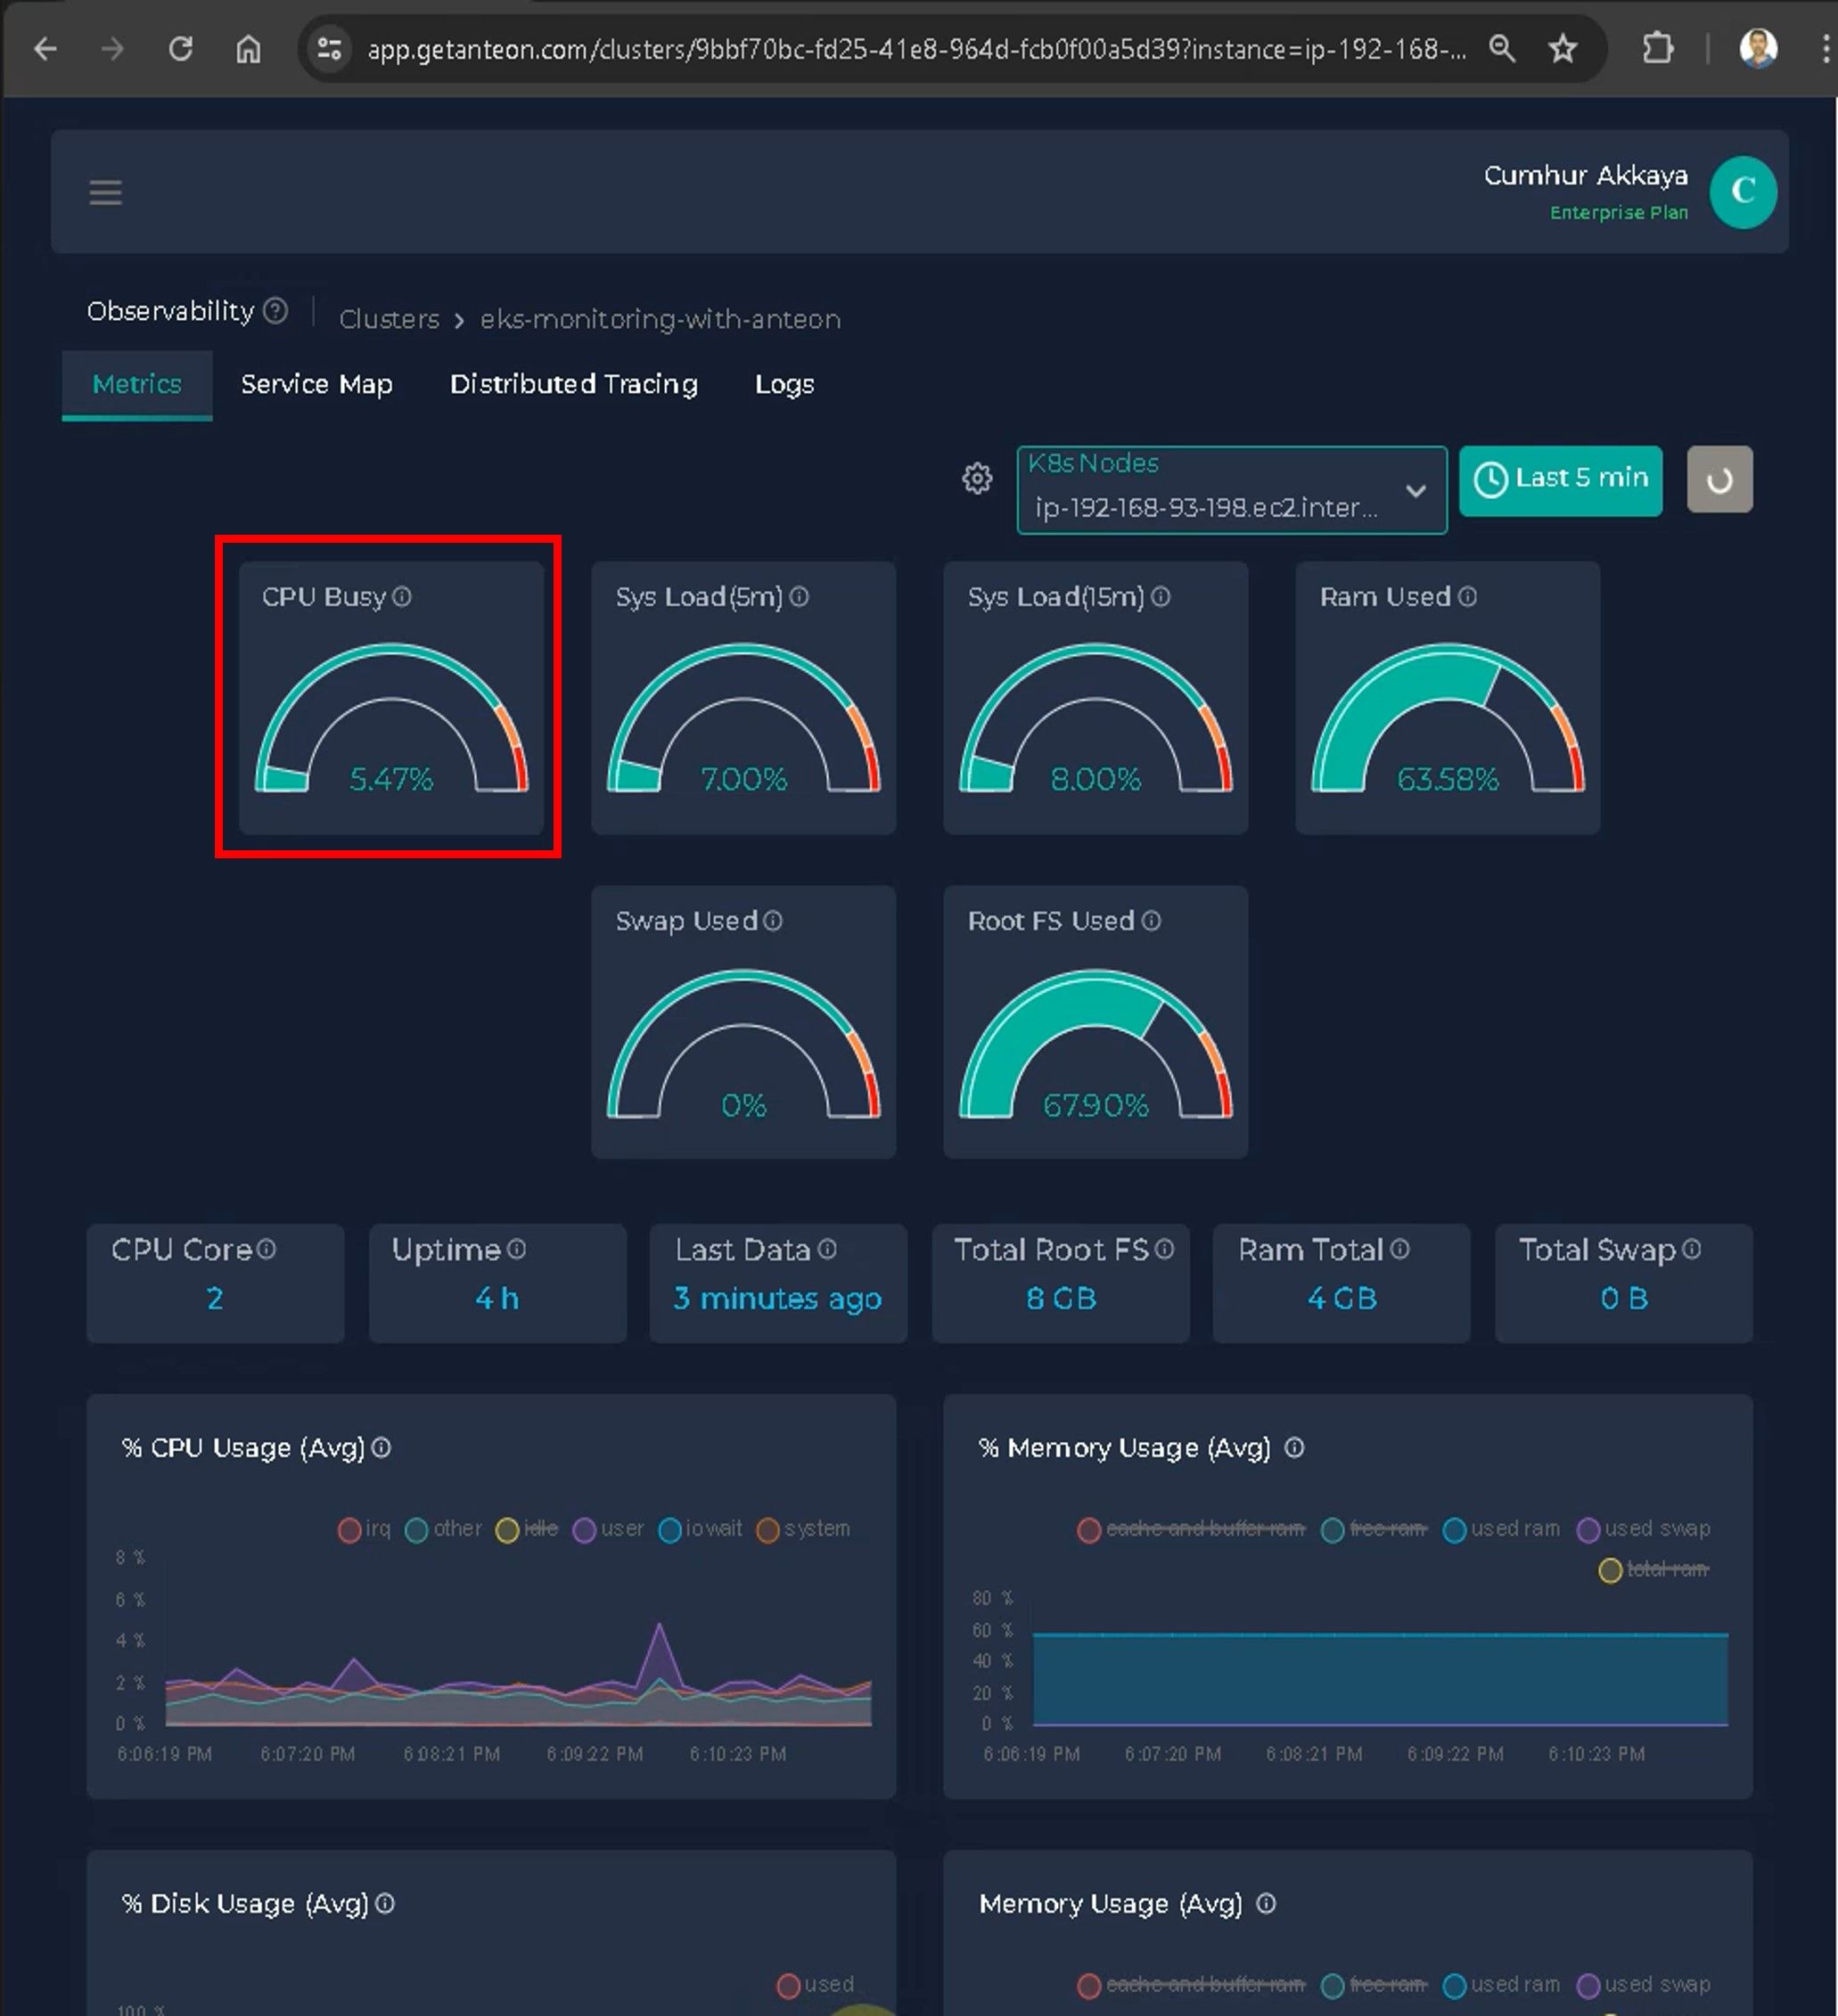
During the load test, the CPU value reached 100% in Anteon Metrics, as shown in the figures below.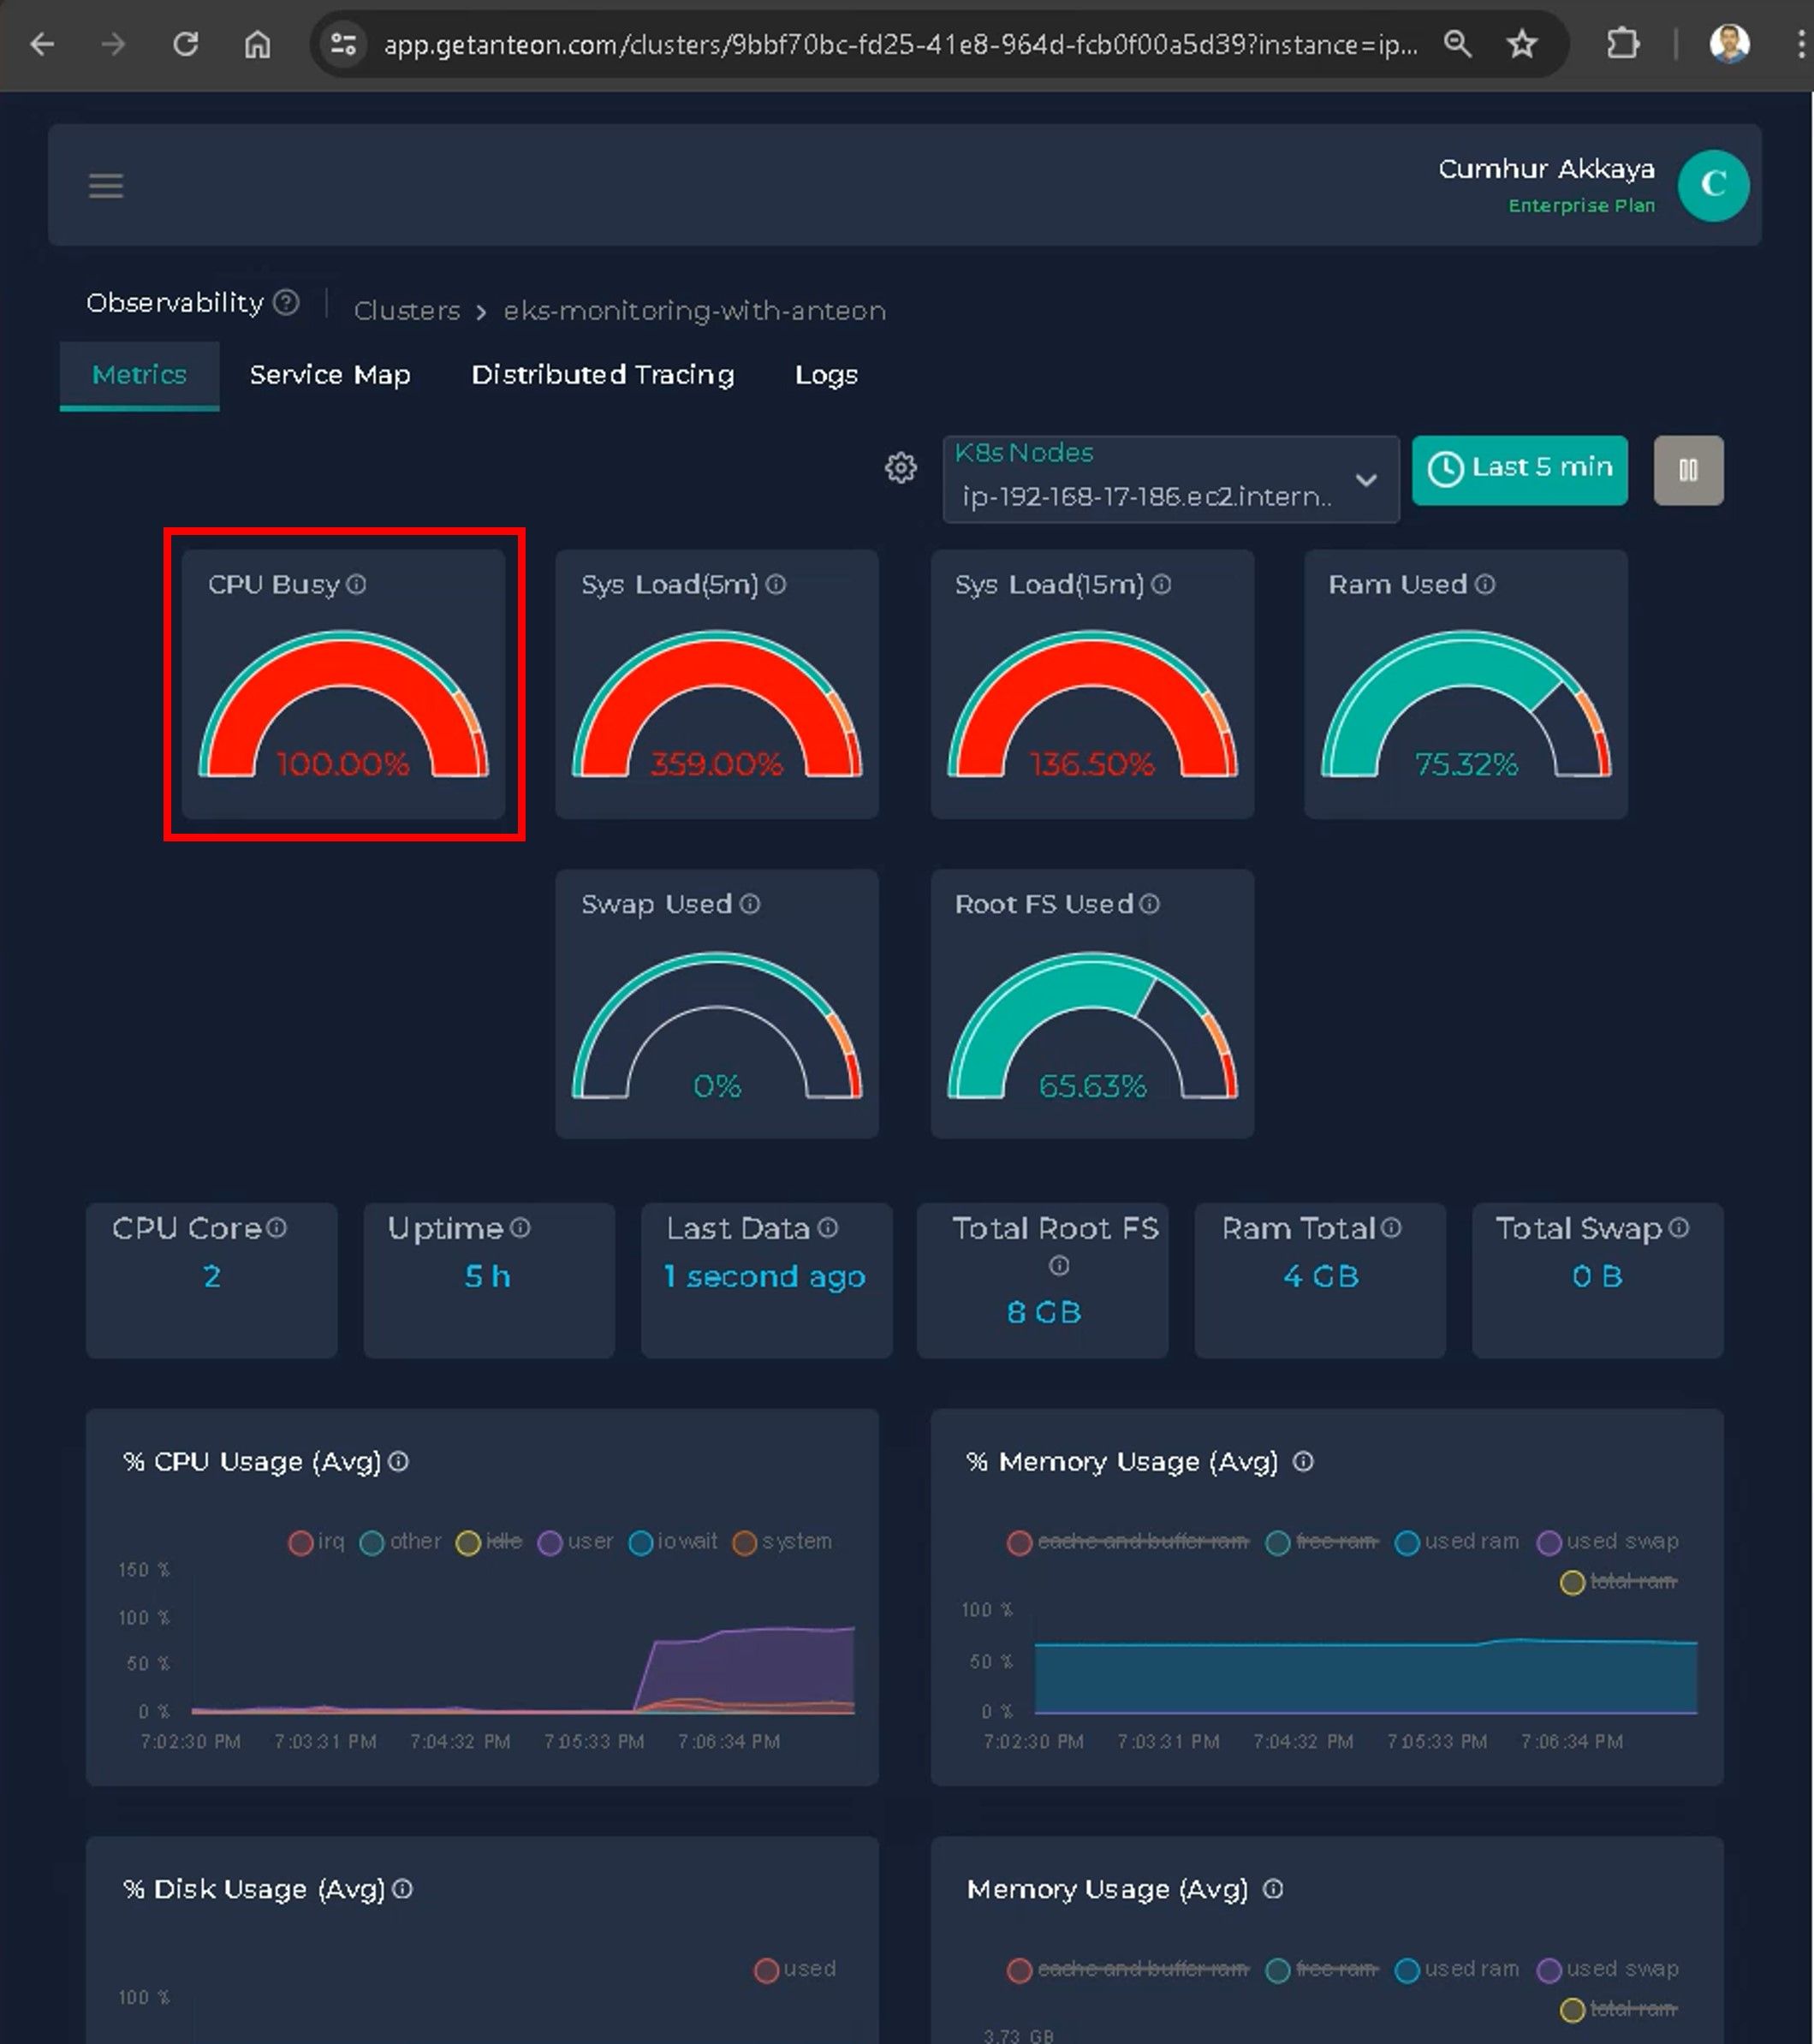
When we click on the alert we created in the Anteon Alerts section, we can see the alert that occurs.
I received an alert message in my e-mail from Anteon in 1 minute.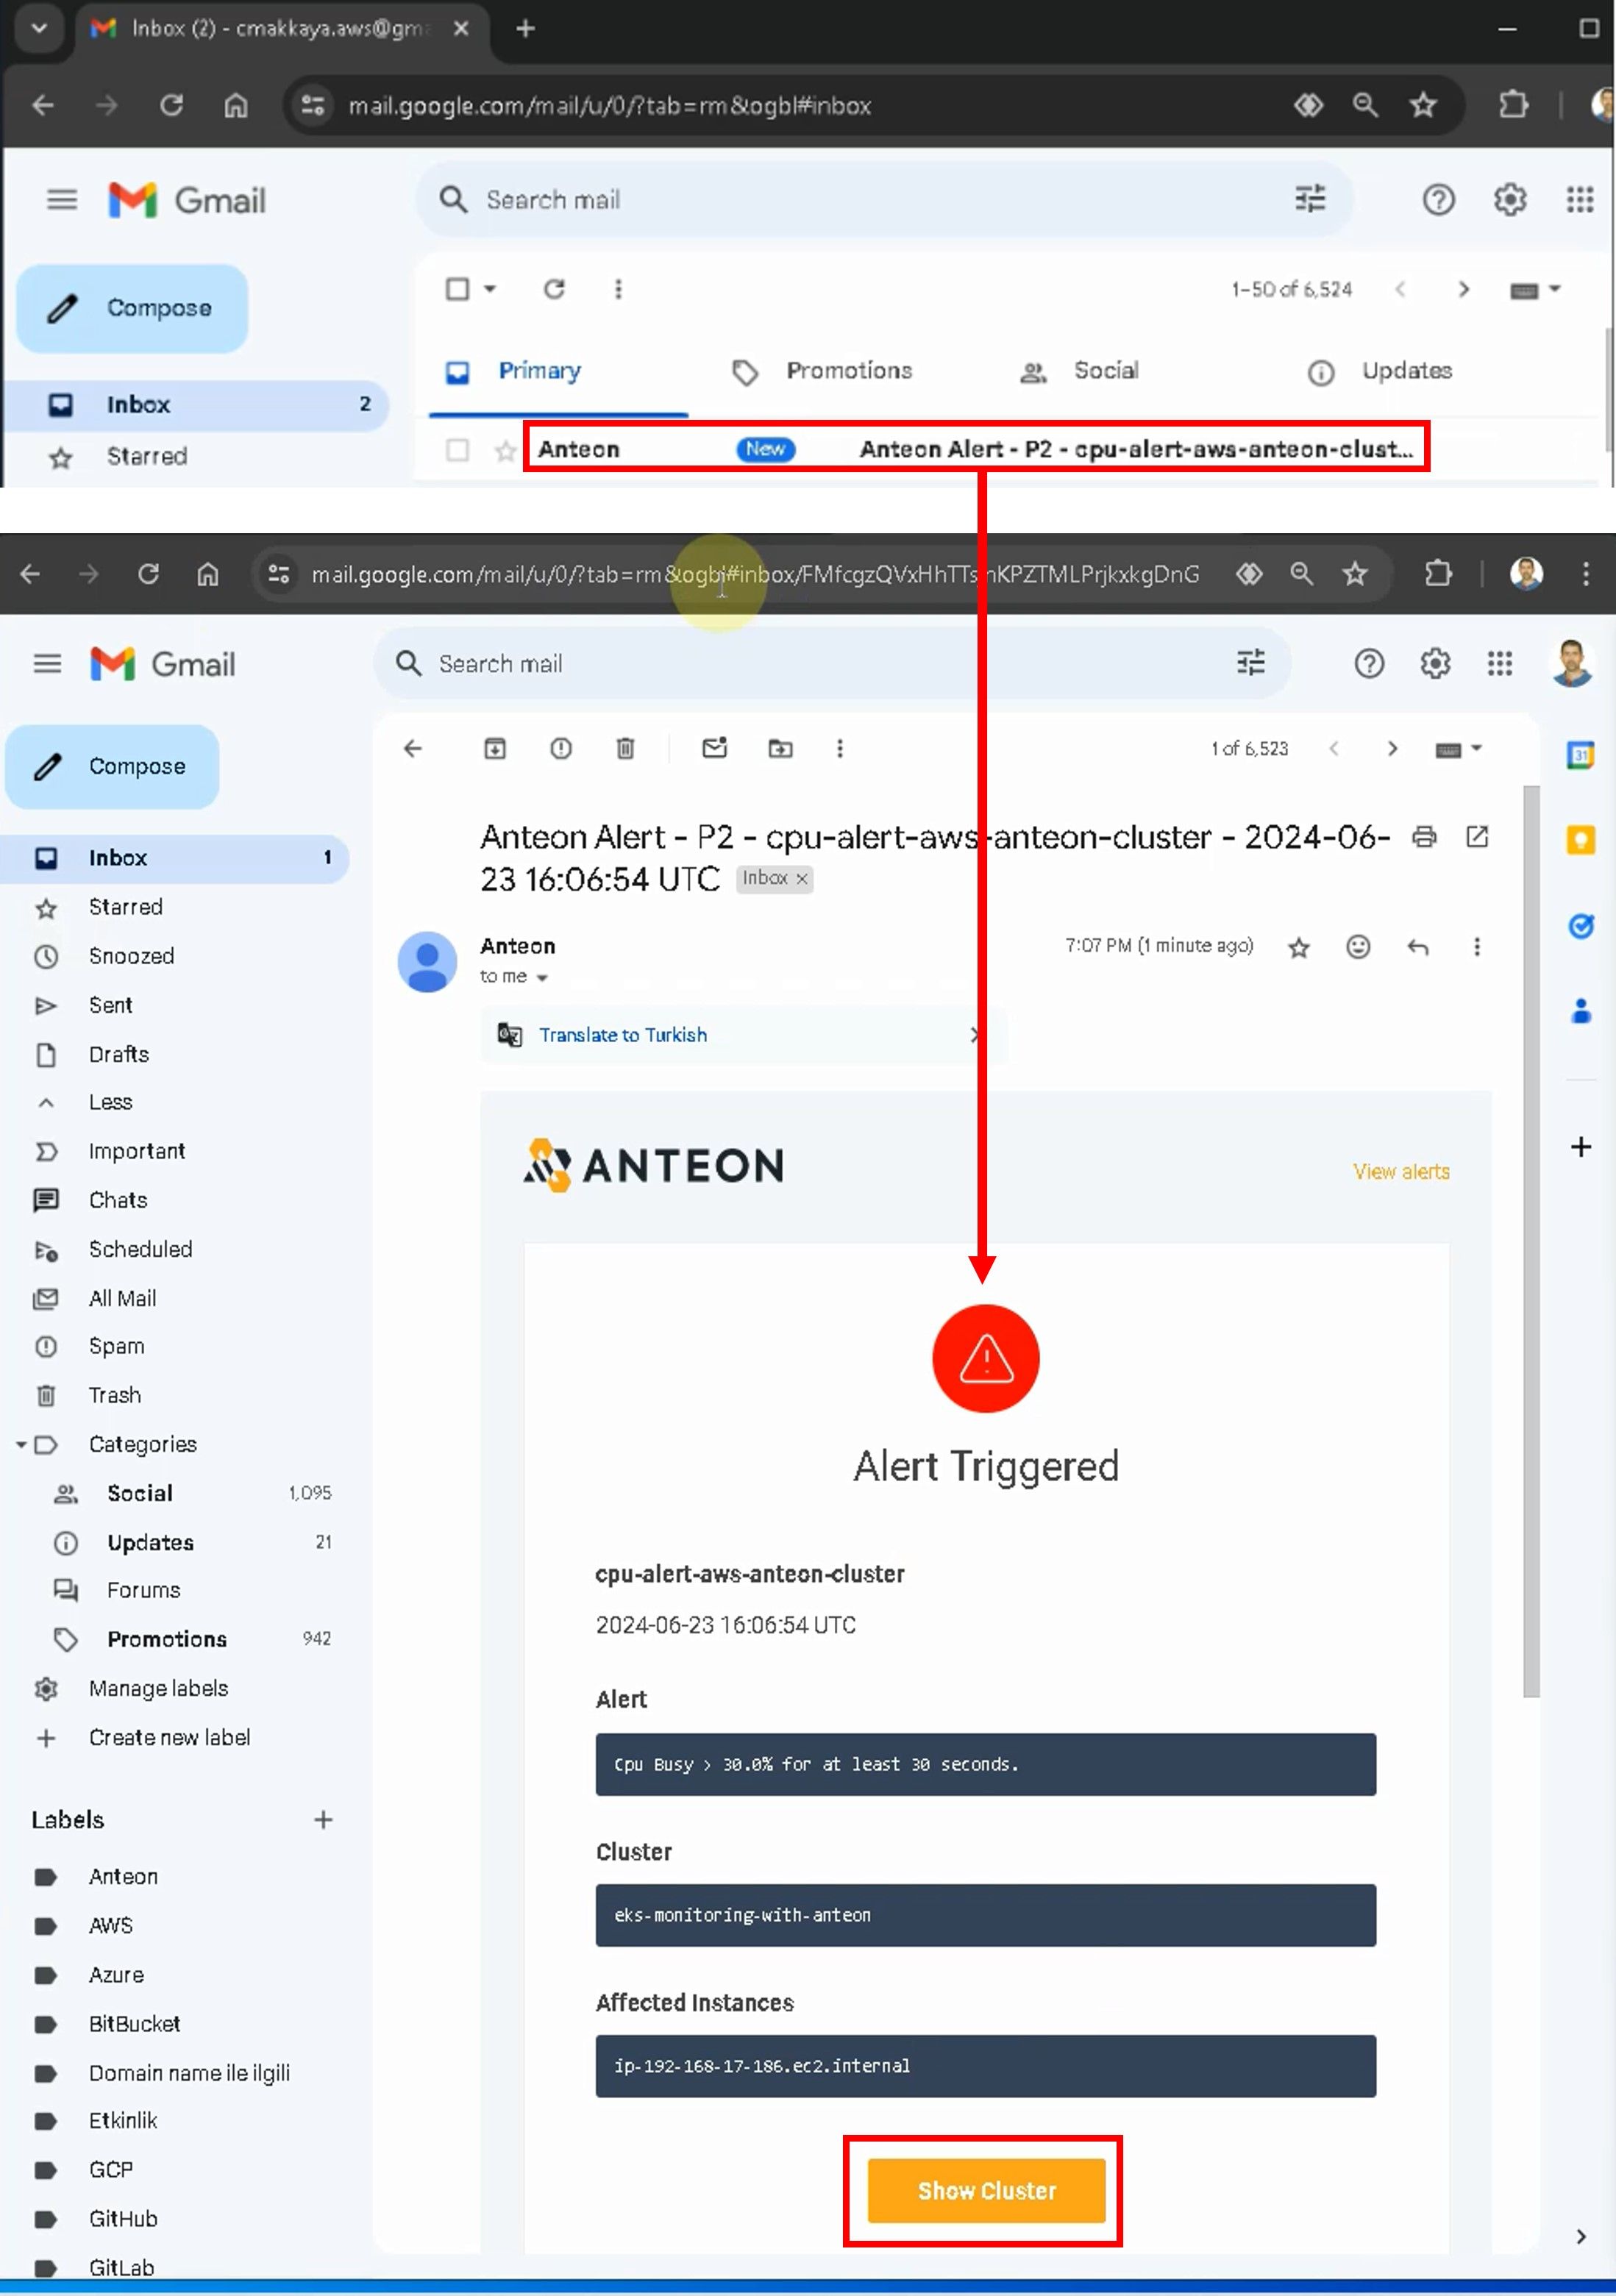
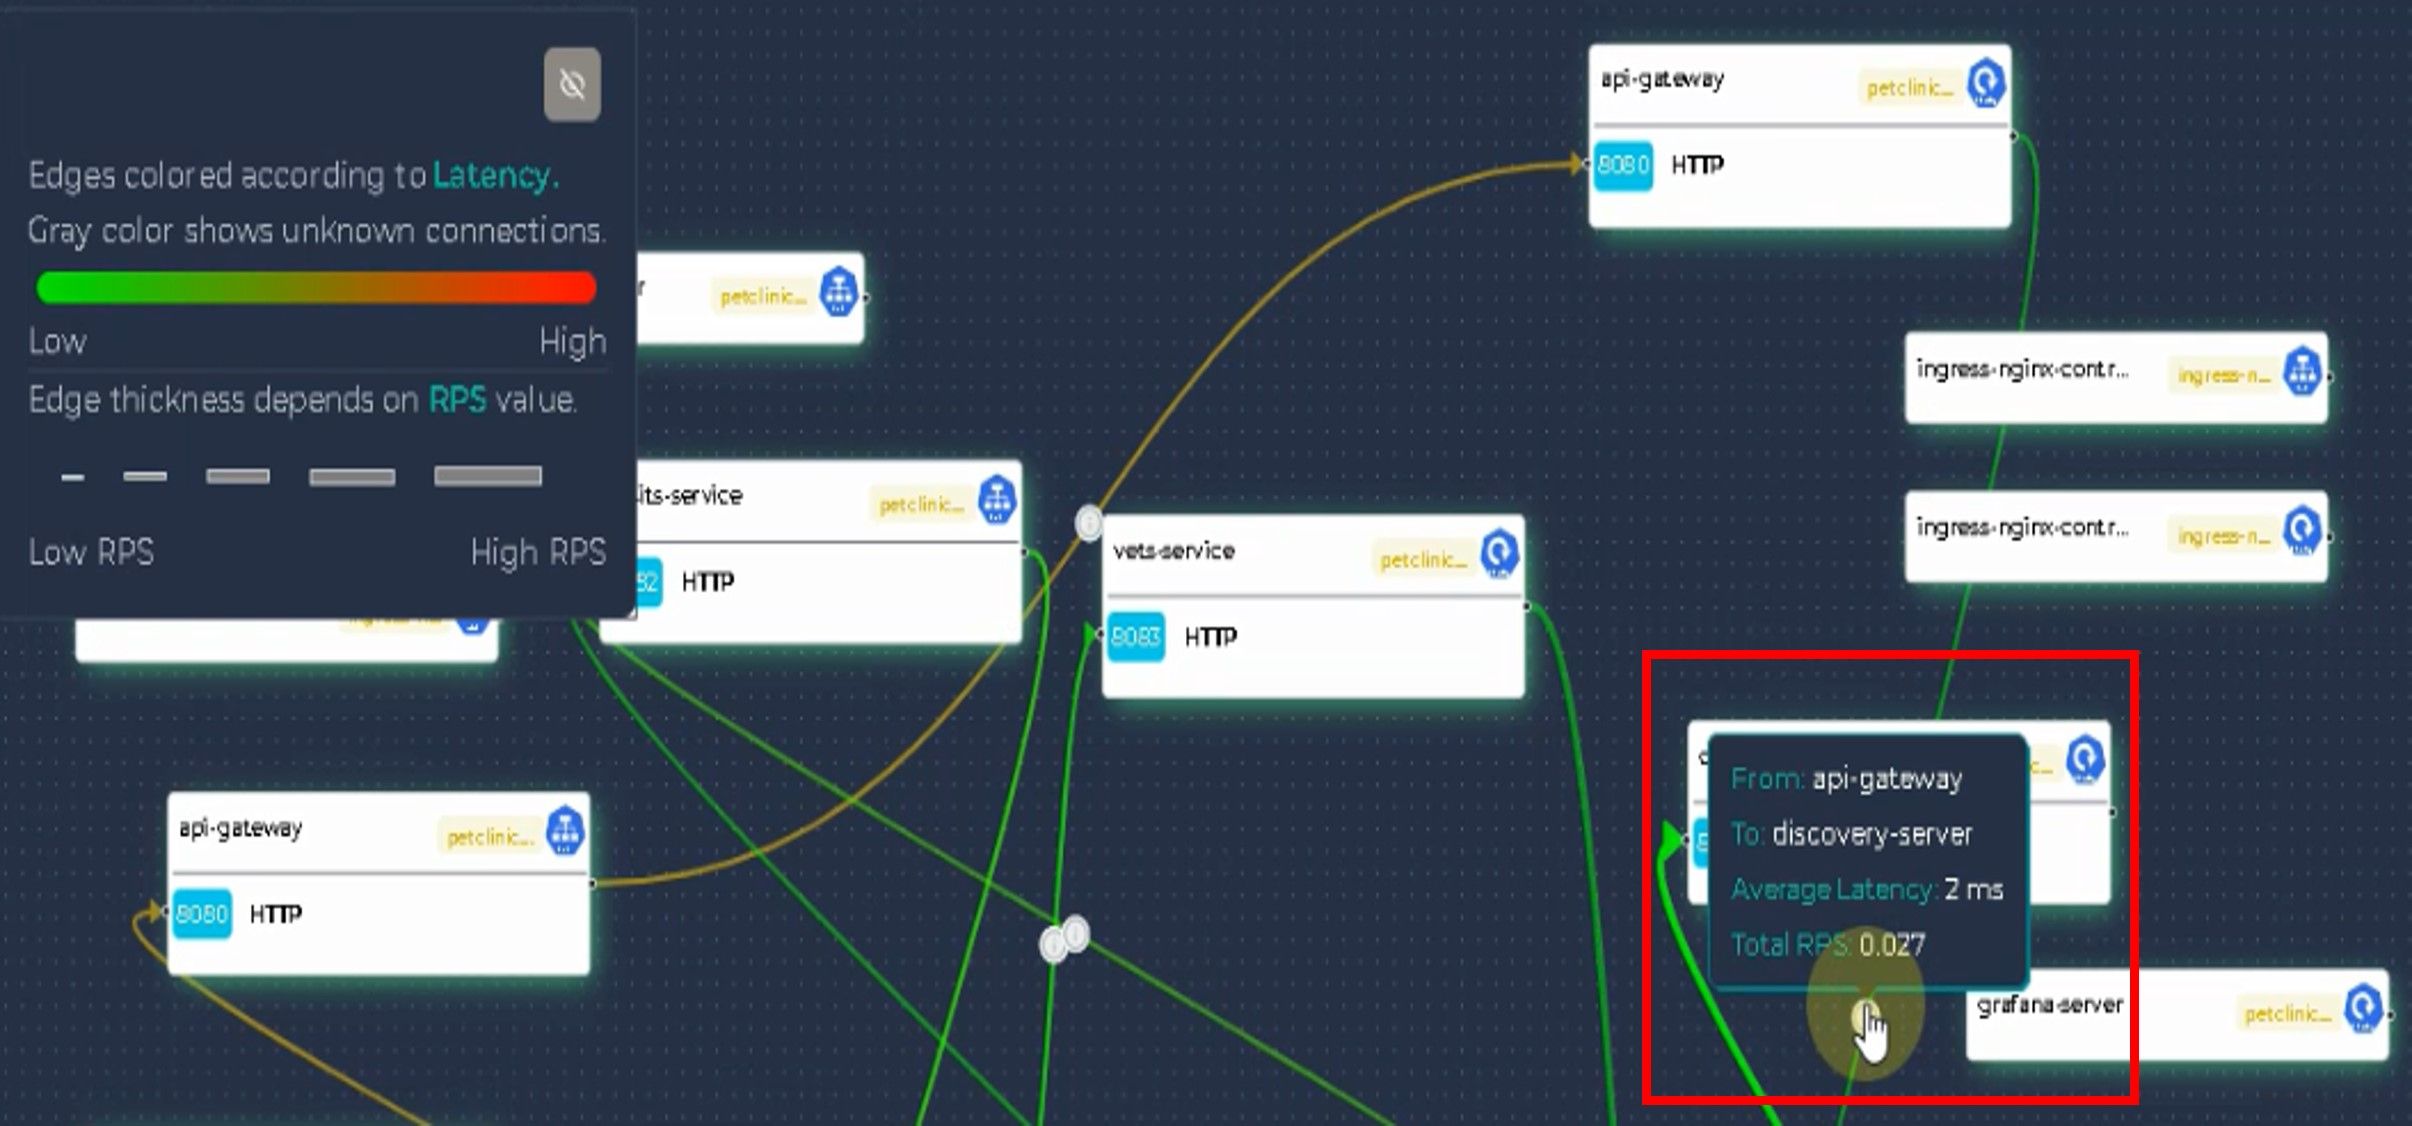
When we click on the Show cluster button, it will show us to our K8s cluster. When we check the Service Map, it will give us clear information about the location of the bottleneck, as shown in the figures below. There are excessive latency and RPS (Requests per second) between the Ingress Nginx Controller and Api-gateway. We will use and examine the Service Map in more detail in my next articles.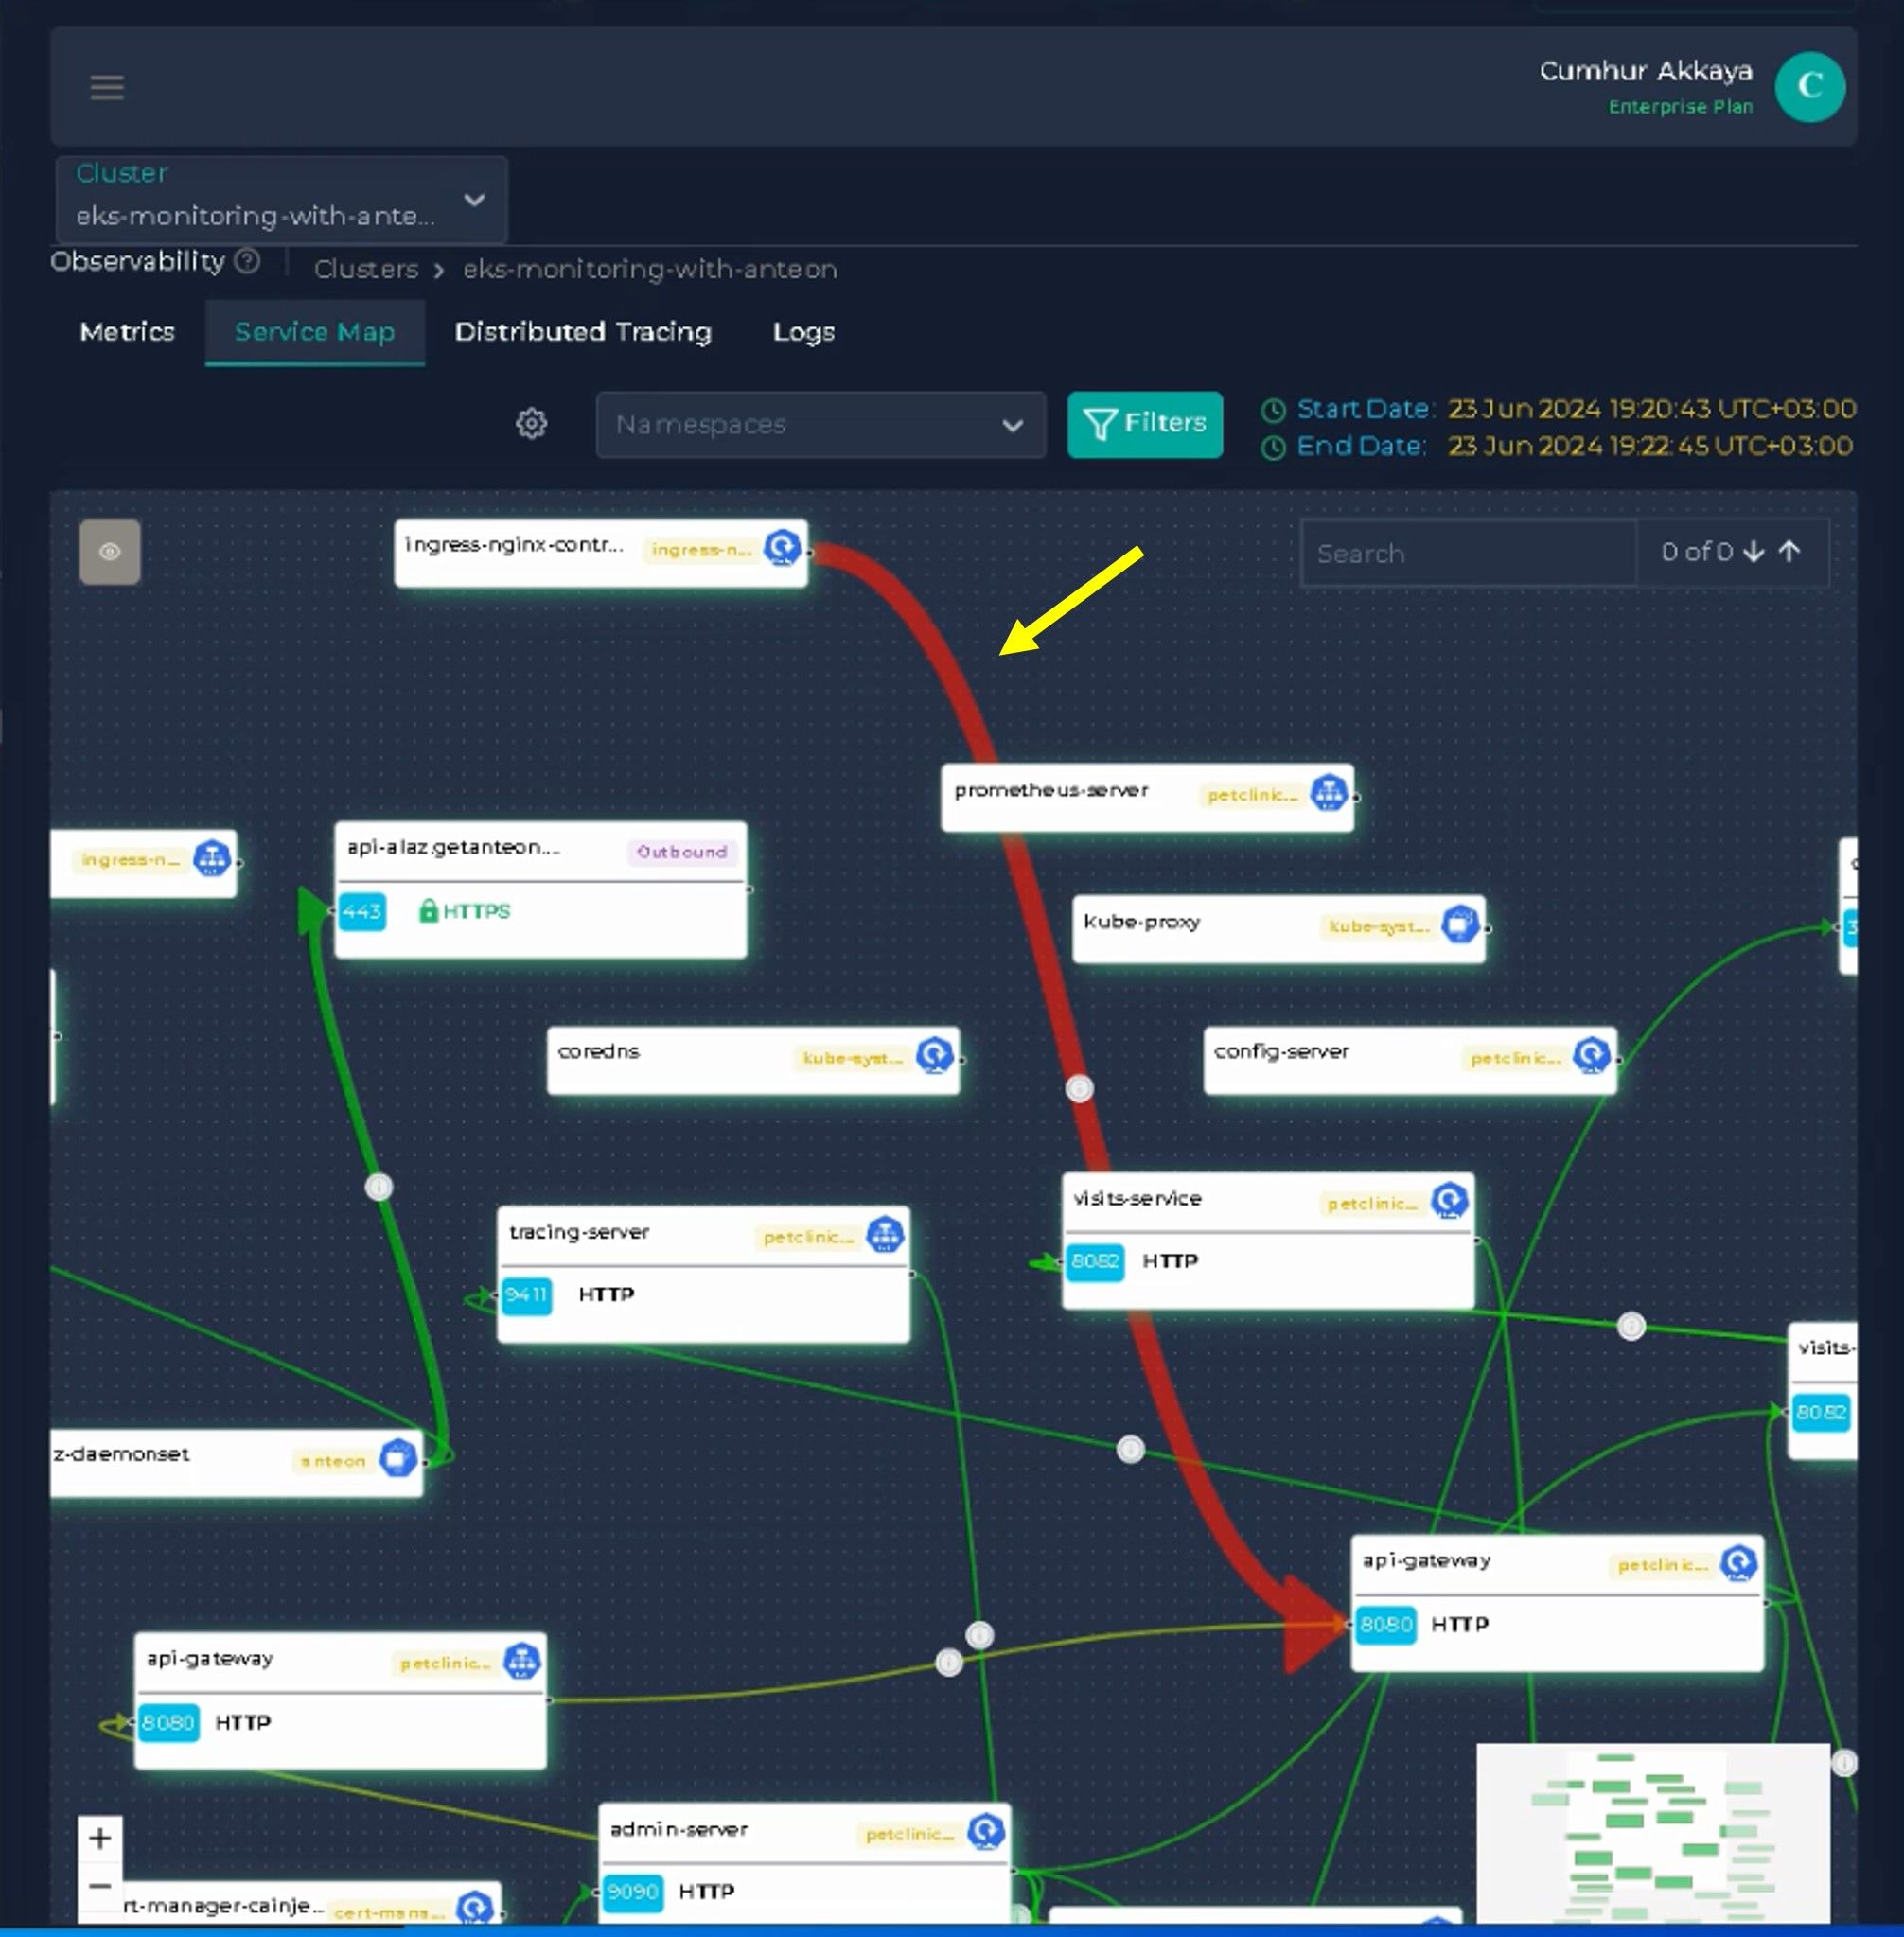
13. Conclusion
In this article, we examined the CI/CD pipeline for the deployment of a microservices application with MySQL Database on the Amazon EKS cluster. We saw the important points to consider in a pipeline. We learned to integrate the Amazon RDS MySql Database to the Amazon EKS cluster on the Jenkins pipeline.
Continuous monitoring is necessary to guarantee optimal performance and reliability in the Kubernetes cluster. We used Anteon for this purpose in this article, and we saw the importance of monitoring the cluster to detect problems and bottlenecks and the benefits of receiving early alerting by setting alarms. Anteon’s simplicity of installation, ease of use, and functionality helped us a lot in these matters.
14. Next post
We will continue monitoring the Kubernetes cluster with Anteon. We‘ll deploy Anteon Self-Hosted on the Kubernetes cluster using the Helm chart. We‘ll also set up Anteon to the Amazon EC2 instances using Docker Compose. We will also examine the Performance Testing and Service Map features in more detail in these deployment options.
We will also test the effect of using Amazon CloudFront on microservices application’s performance with Anteon Performance Testing. I’m sure you will be very surprised when we examine the results in the Metrics, Test result, and Service Map.
We will deploy Anteon by using AWS Marketplace for easy deployment on AWS and monitor the CI/CD pipeline in K8s using it.
Later, we‘ll deploy and run Anteon Self-Hosted both on the Azure Kubernetes Service (AKS), Google Kubernetes Engine (GKE), and on the Azure Virtual Machine (VMs) and GCP Compute Engine (VMs).
Also, we’ll run the CI/CD pipeline for the deployment of a microservices app on the Azure AKS by using Azure DevOps (Azure Pipelines) instead of Jenkins, and monitor it using Anteon. In GCP, we’ll run the CI/CD pipeline by using GitHub Action, GitLab CI/CD, and BitBucket Pipelines, and monitor them by using Anteon.
We will compare various Kubernetes monitoring tools with each other and see their advantages and disadvantages. For example, Prometheus-Grafana, Datadog, Kubernetes Dashboard, Anteon, Amazon CloudWatch, Azure Monitor, and Google Cloud Monitoring as monitoring tools, Elastic Stack (ELK), Loki, Amazon CloudWatch Logs, Azure Monitor Logs, and Google Cloud Logging as logging tools.
We will do these practically step by step in the next articles.
Happy Clouding…
15. References
(2) https://getanteon.com/docs/#what-is-anteon-1
(3) https://getanteon.com/docs/deployment/
(4) https://github.com/getanteon/anteon/#-kubernetes-monitoring
(5) https://github.com/getanteon/anteon/#-performance-testing
(6) https://getanteon.com/docs/getting-started/#anteon-features
(7) https://docs.aws.amazon.com/eks/latest/userguide/create-cluster.html
(9) https://getanteon.com/pricing/
(10) https://getanteon.com/docs/kubernetes-monitoring/service-map/
(11) https://getanteon.com/docs/kubernetes-monitoring/alerts/#key-features-and-benefits