

Introduction: How to Detect Slow SQL Queries
In today’s rapidly evolving tech landscape, the integration of SQL databases with Kubernetes clusters has become increasingly prevalent. This fusion, while unlocking new horizons of scalability and efficiency, also introduces unique challenges in monitoring and managing SQL queries, , including the detection of PostgreSQL slow queries.
In this blog post, we delve into the intricacies of monitoring SQL queries within Kubernetes clusters using Anteon, and explore effective strategies for detecting and optimizing slow SQL queries, particularly PostgreSQL slow queries.
We will:
-
Deploy a sample Django application relying on Postgres
-
Execute queries on this application and monitor the queries executed by latency
Note: This blog post is about monitoring SQL queries inside a Kubernetes cluster, but the same principles could also be extended to other protocols such as HTTP, HTTP/2, gRPC and RabbitMQ. Check supported protocols here.
Note: I assume that you already have a Kubernetes cluster and set it up in Anteon using Alaz. If you need more help on this, you can follow along the instructions here.
Now that we have our cluster present in Anteon, let’s deploy our sample application to start the monitoring. All the source codes referenced in this article are available here.
Monitoring SQL Traffic
Deploying The Application
Go ahead and run the following command:
kubectl apply -f https://raw.githubusercontent.com/ddosify/blog_examples/main/008_slow_sql_queries/sample_apps.yaml
This will deploy the following two applications:
-
A Postgres server (
postgres) -
A sample Django application (
testserver) -
This application is a simple Django server that operates football league data containing 5 database models and 2 endpoints:
-
Models:
-
League
-
Team
-
Match
-
Player
-
Spectator
Details about these models could be found here.
-
Endpoints:
-
GET: Joins the tables Spectator, Match, Team, League, Player and returns the total count of these rows.
-
GET: Returns the total rows of the tables Player, Spectator, Match, Team, League.
-
POST: Generates the following mock data: 10 League objects, 10 Team objects, 100 Player objects, 100 Match objects, 10000 Spectator objects.
-
DELETE: Clears the objects in the League, Team, Player, Match, Spectator tables.
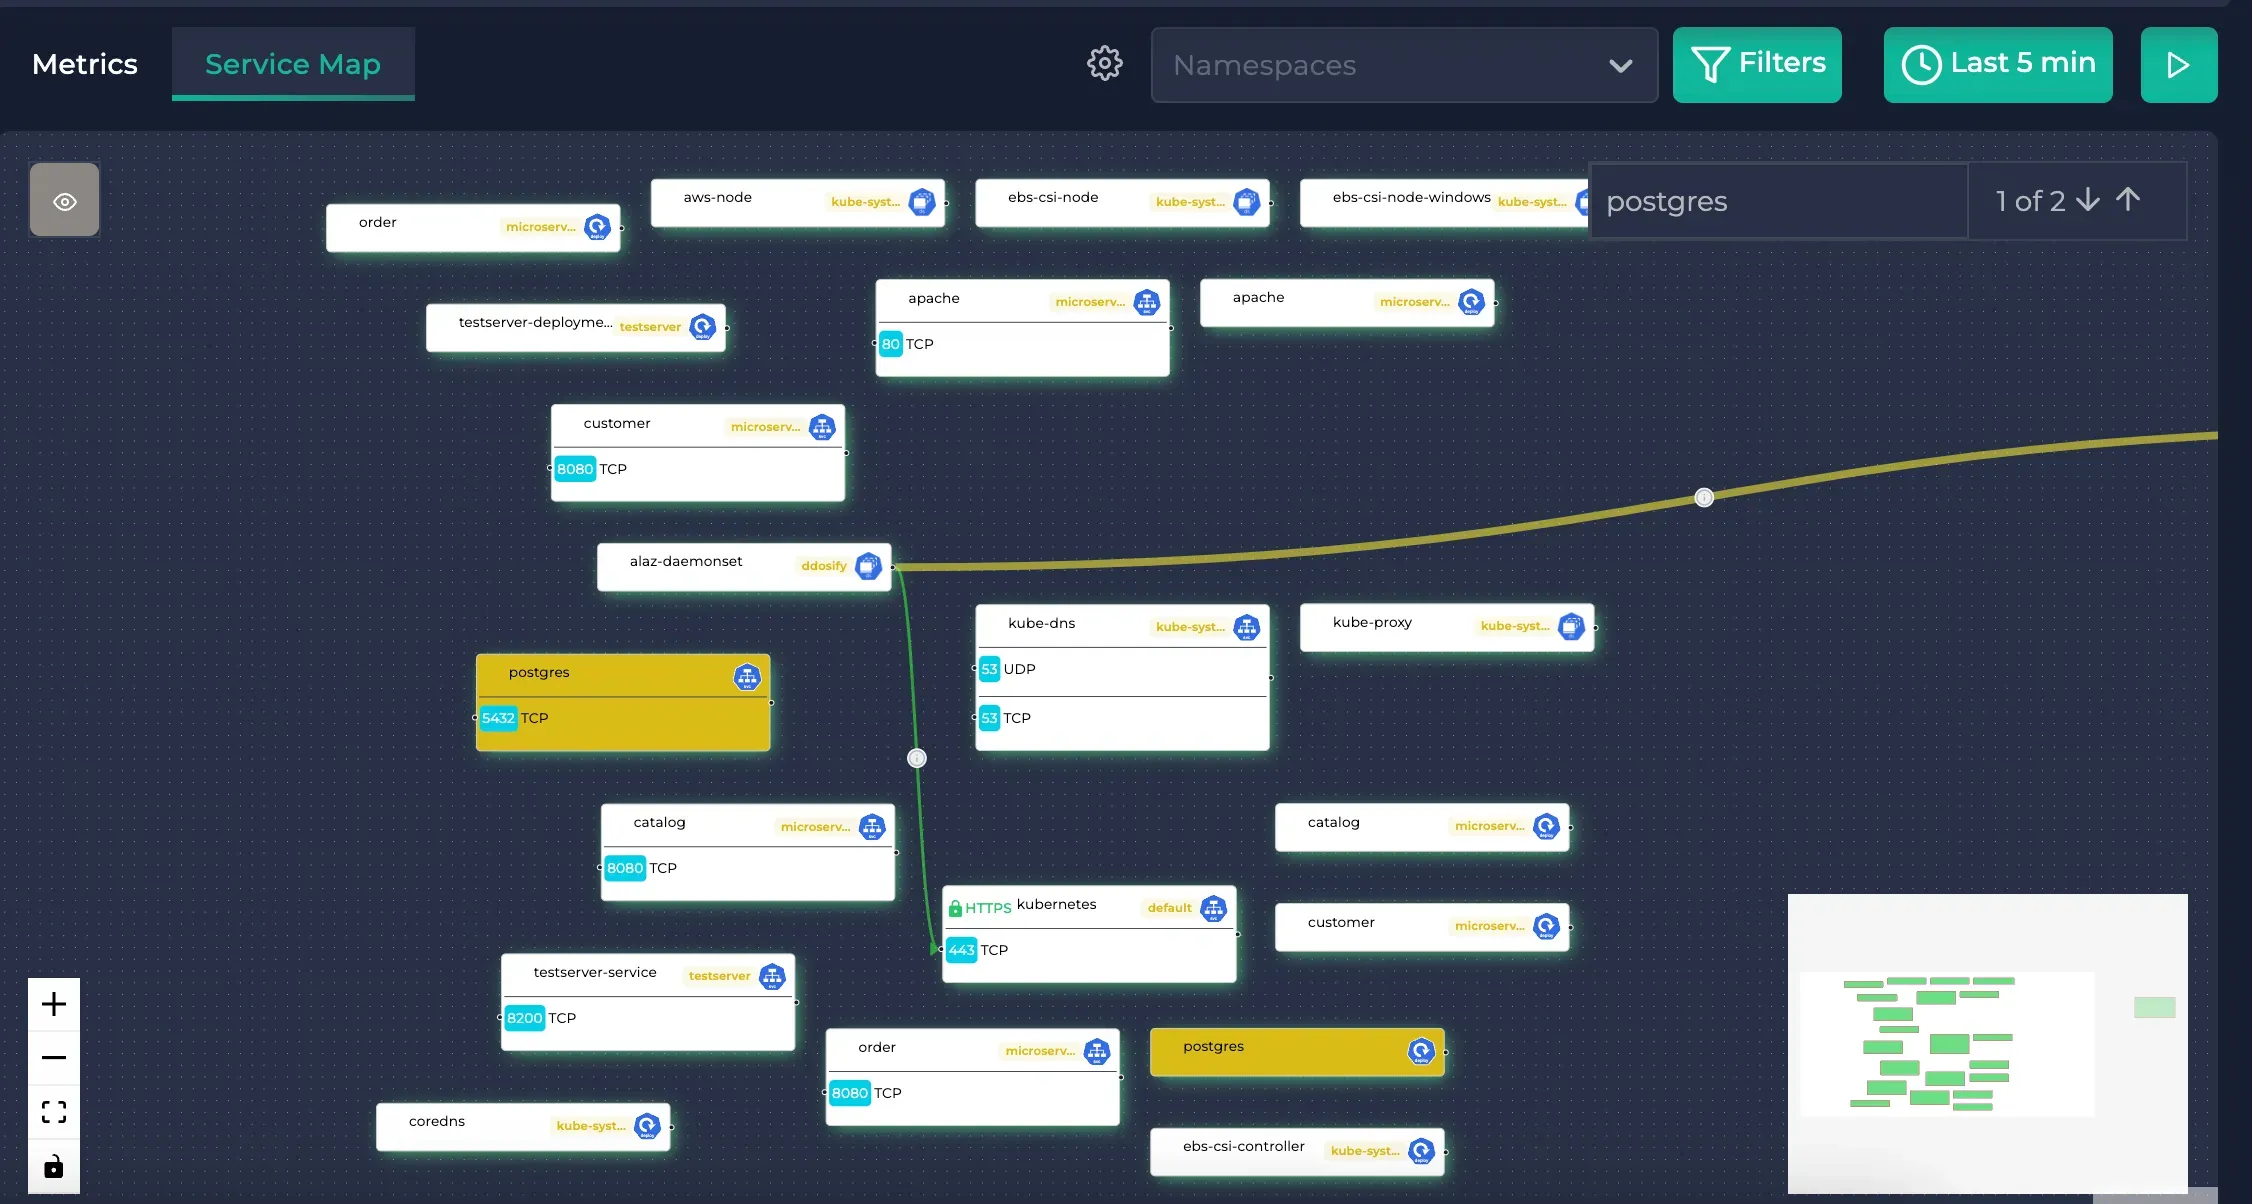
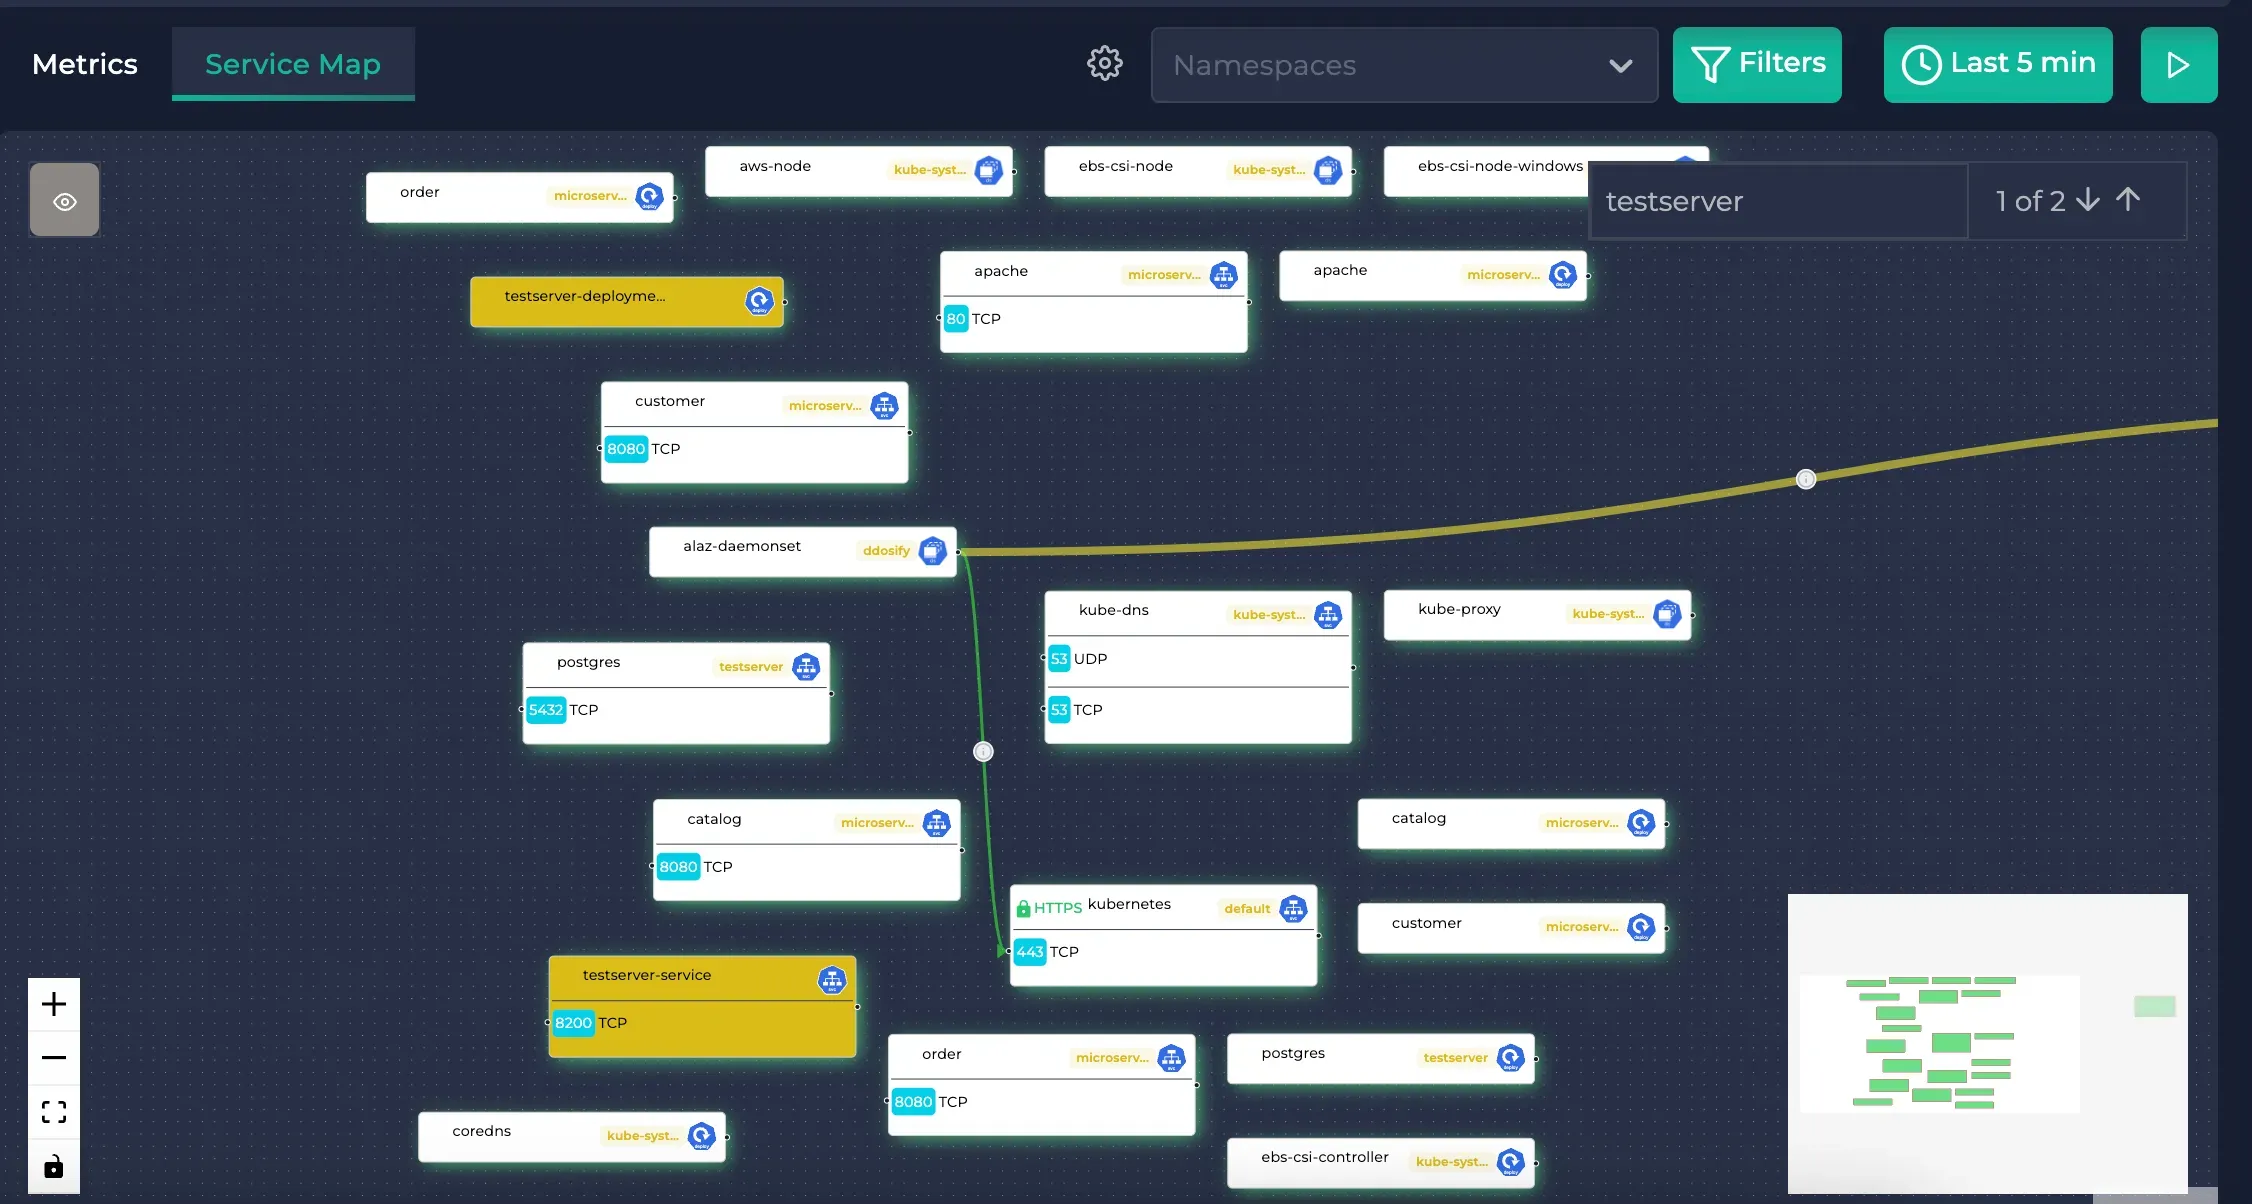
After the installation completed, you should be able to locate postgres and testserver in your service map. Check Anteon docs for installation and this blog post for more information on Kubernetes Monitoring with Anteon.
The service map when Postgres is searched
The service map when Testserver is searched
Generating Traffic
Now, let us check if we can view the traffic between these.
Port forward to testservice:
kubectl port-forward --namespace testserver service/testserver-service 8200:8200
Run this to generate mock data:
curl -X POST http://localhost:8200/football/data
This will take some time as it generates thousands of rows. It may take up to 30 seconds.
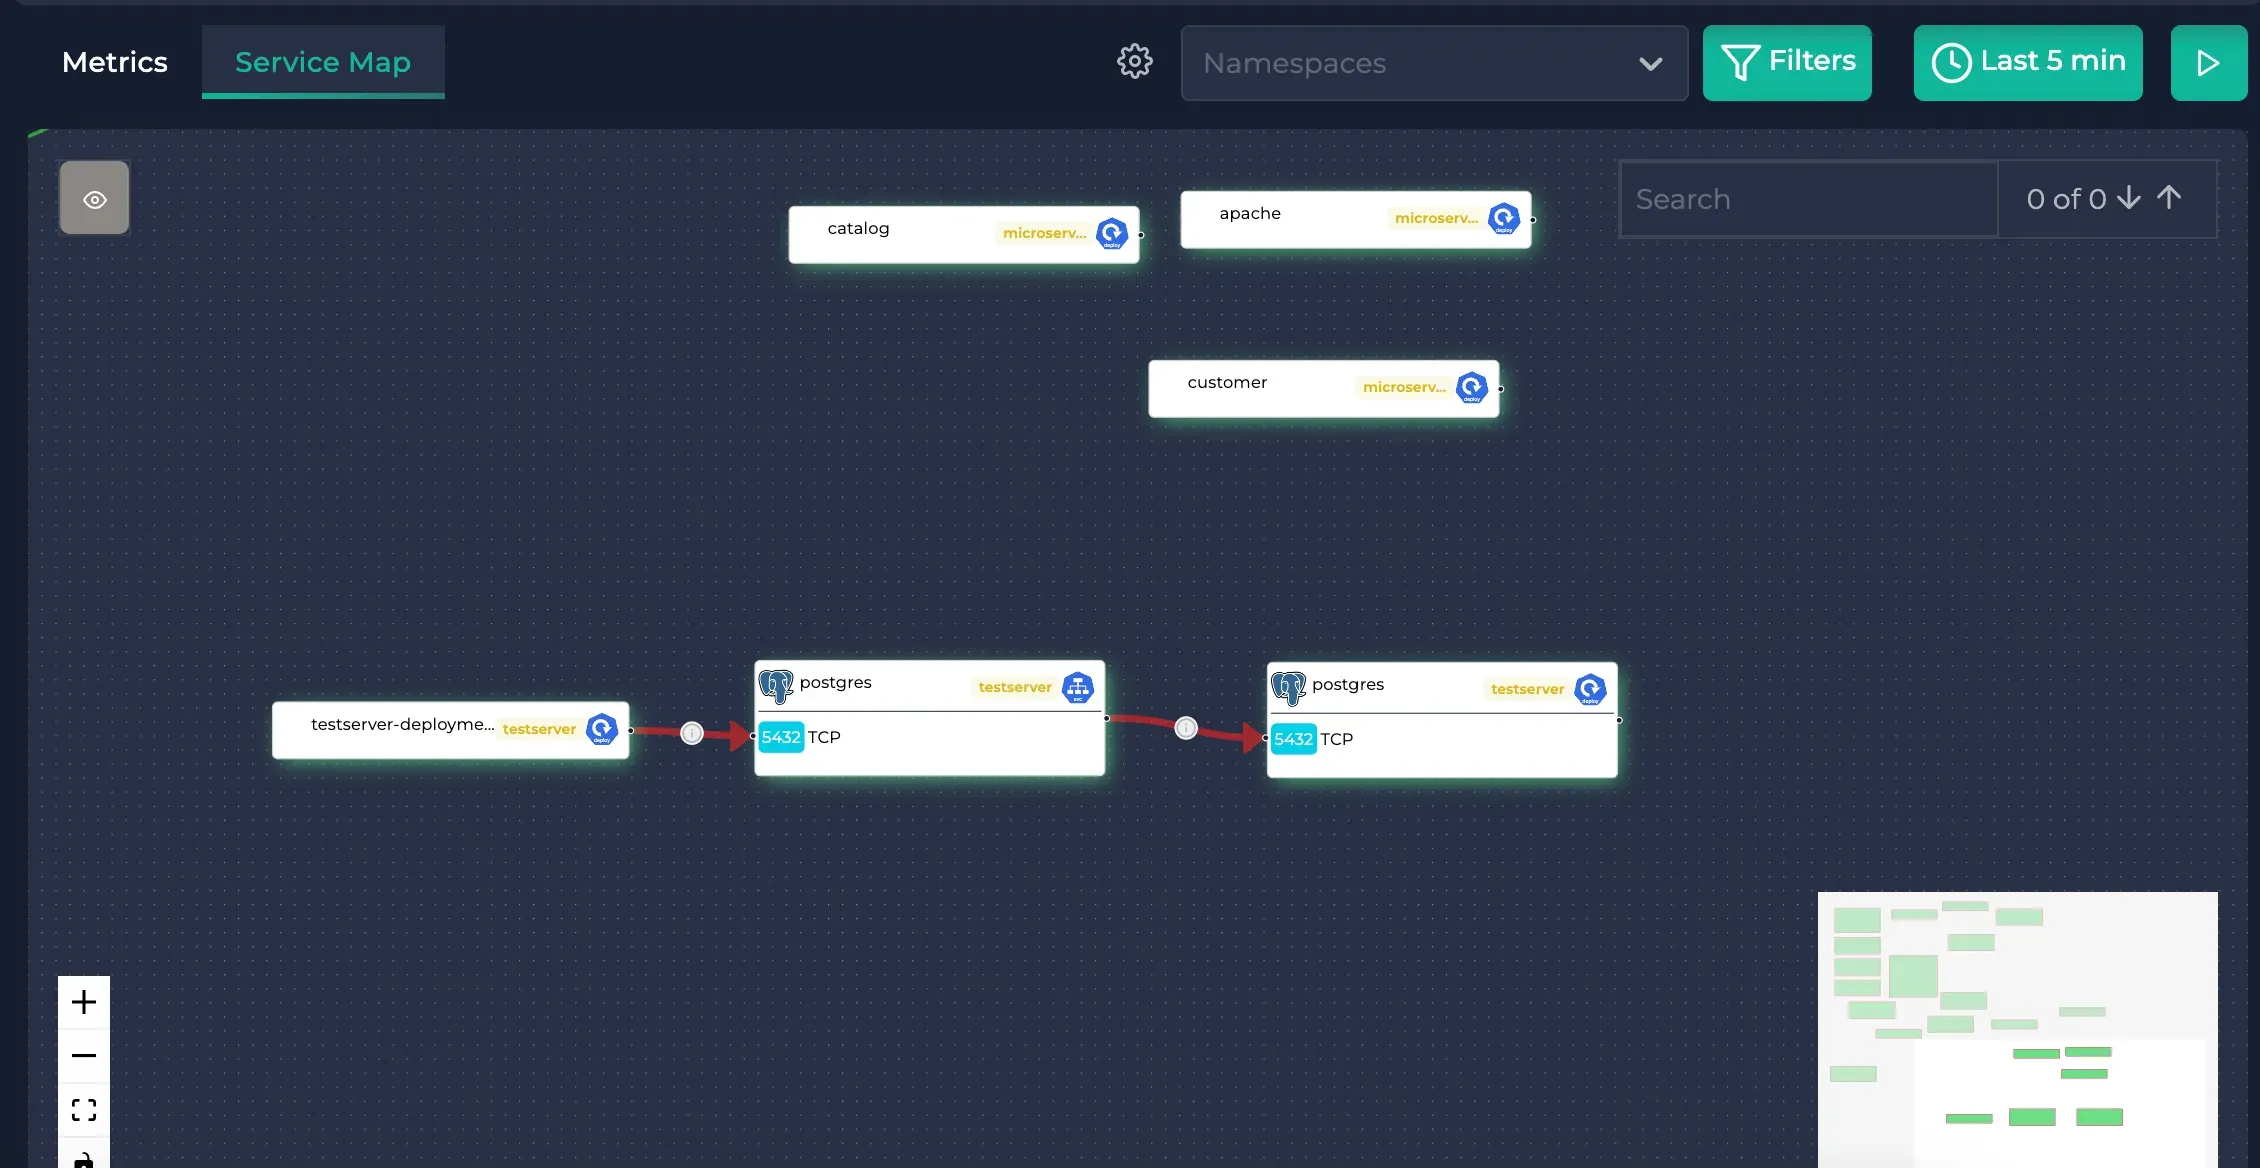
Then, you will see that this connection is created in the service map (note that the edges are red, meaning that the latency is high):
Generated traffic
Click on testserver-deployment (the same traffic can be viewed on the postgres service and the postgres deployment as well)
Testserver deployment

Then click on POSTGRES
Postgres traffic
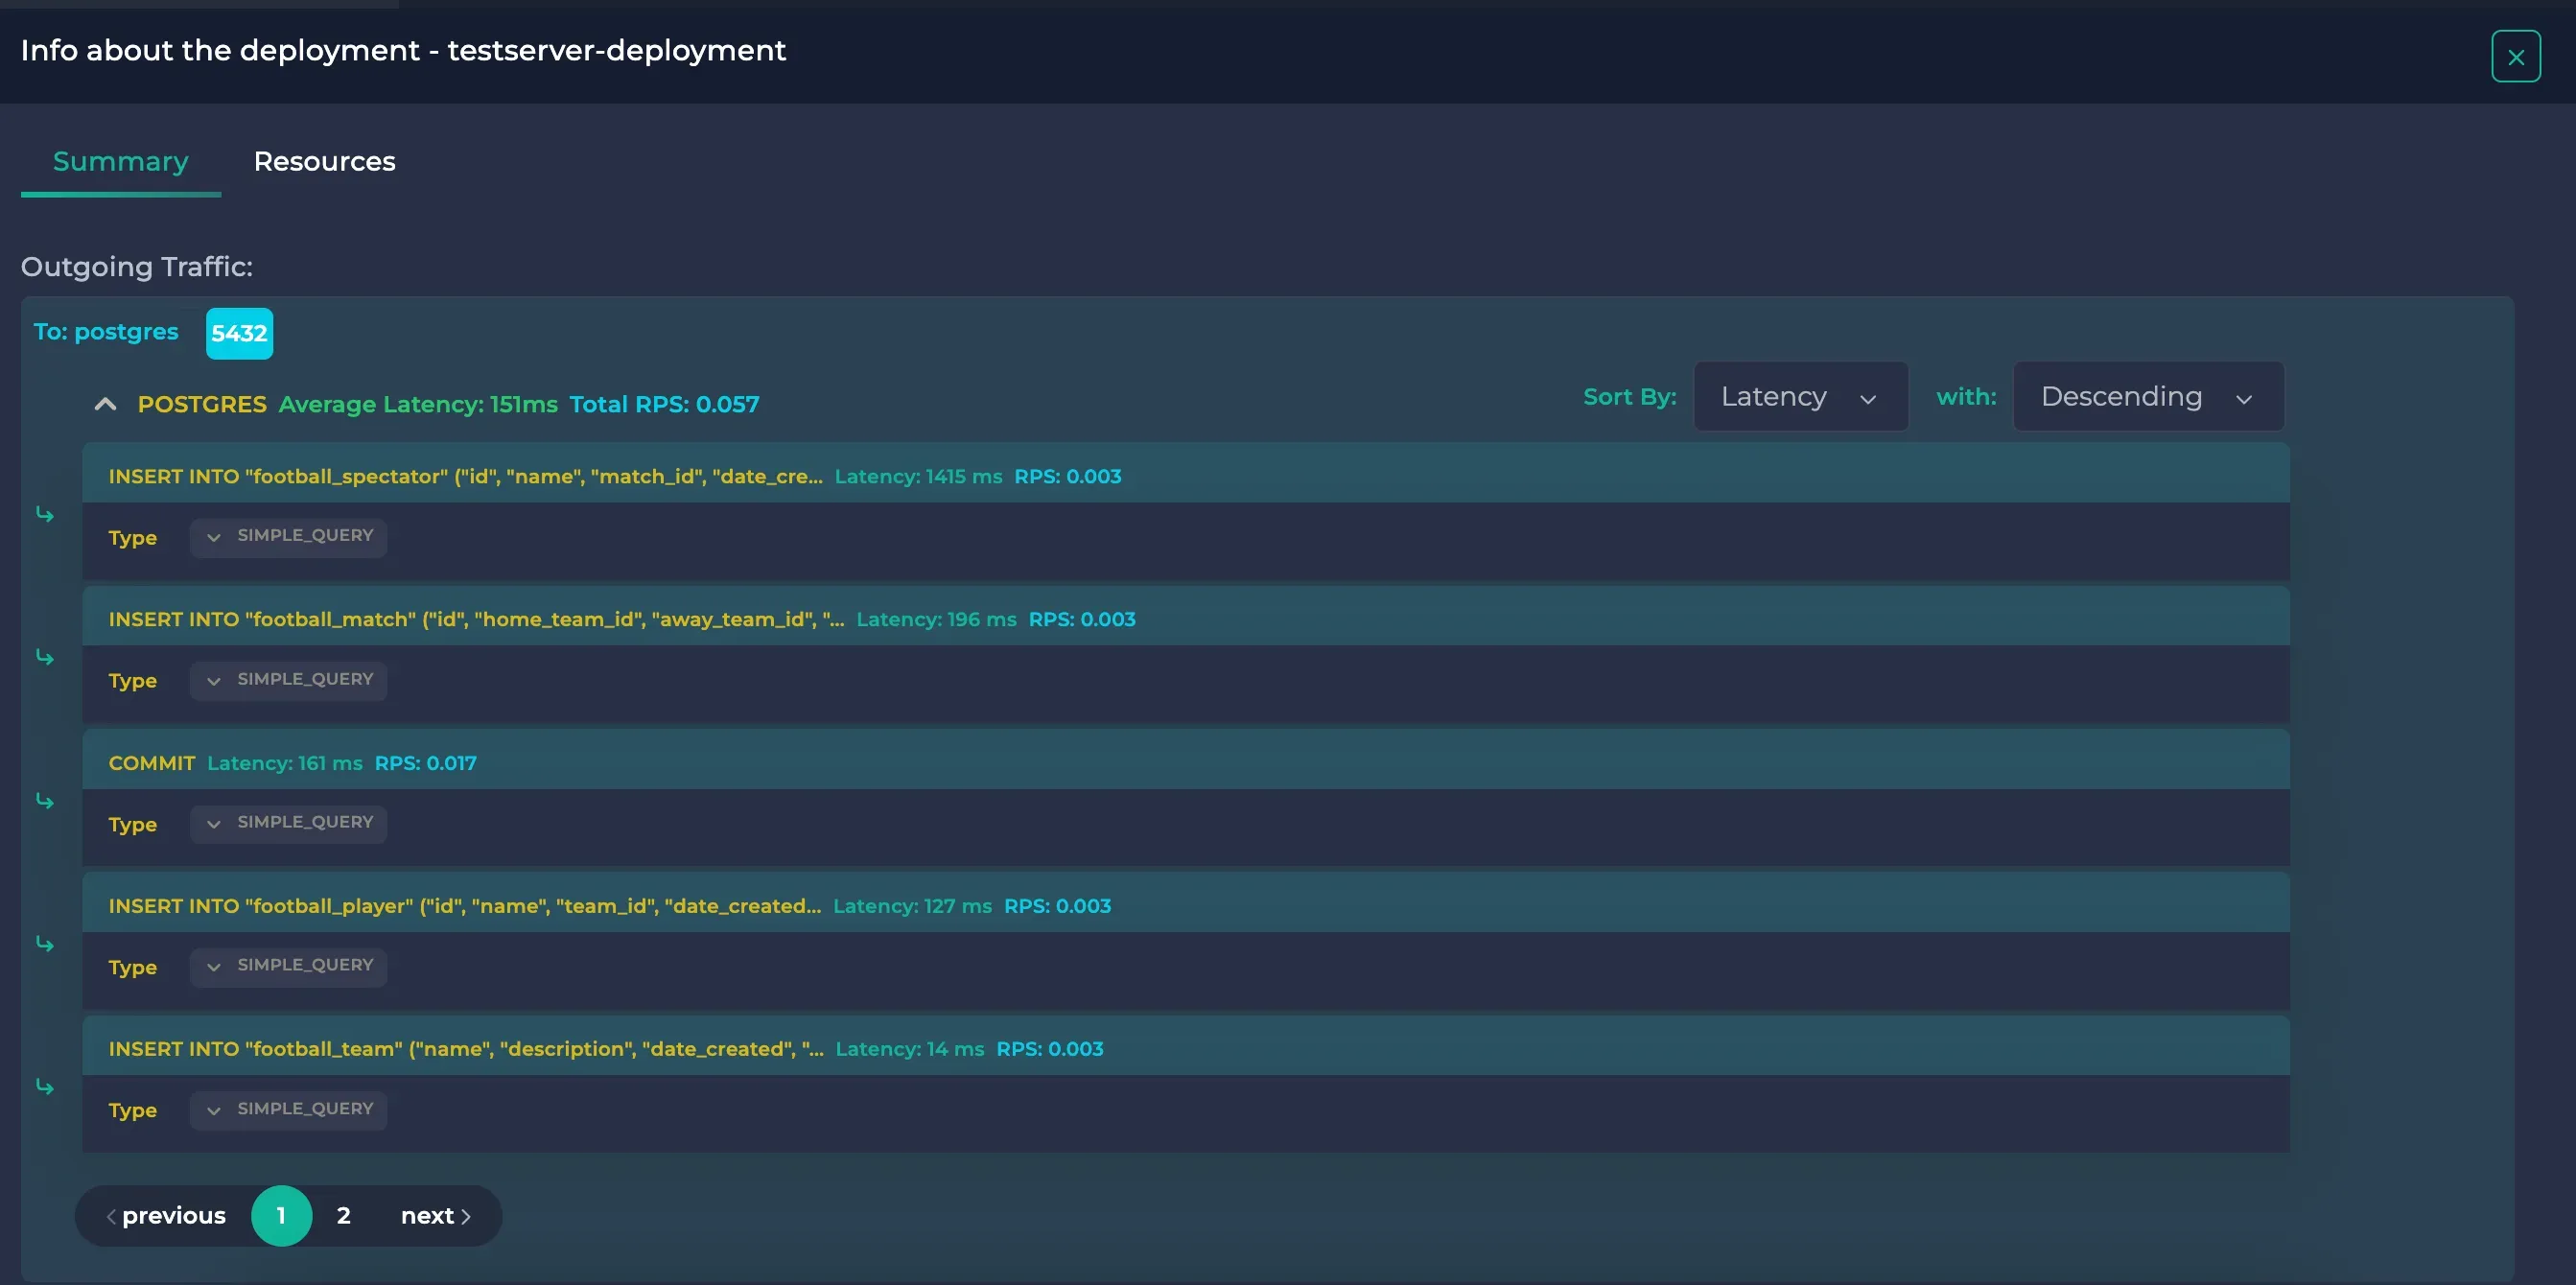
Here, you will see the executed Insert queries. You can also view the actual queries and their latencies along with their RPS by clicking on them.
Detailed Postgres traffic
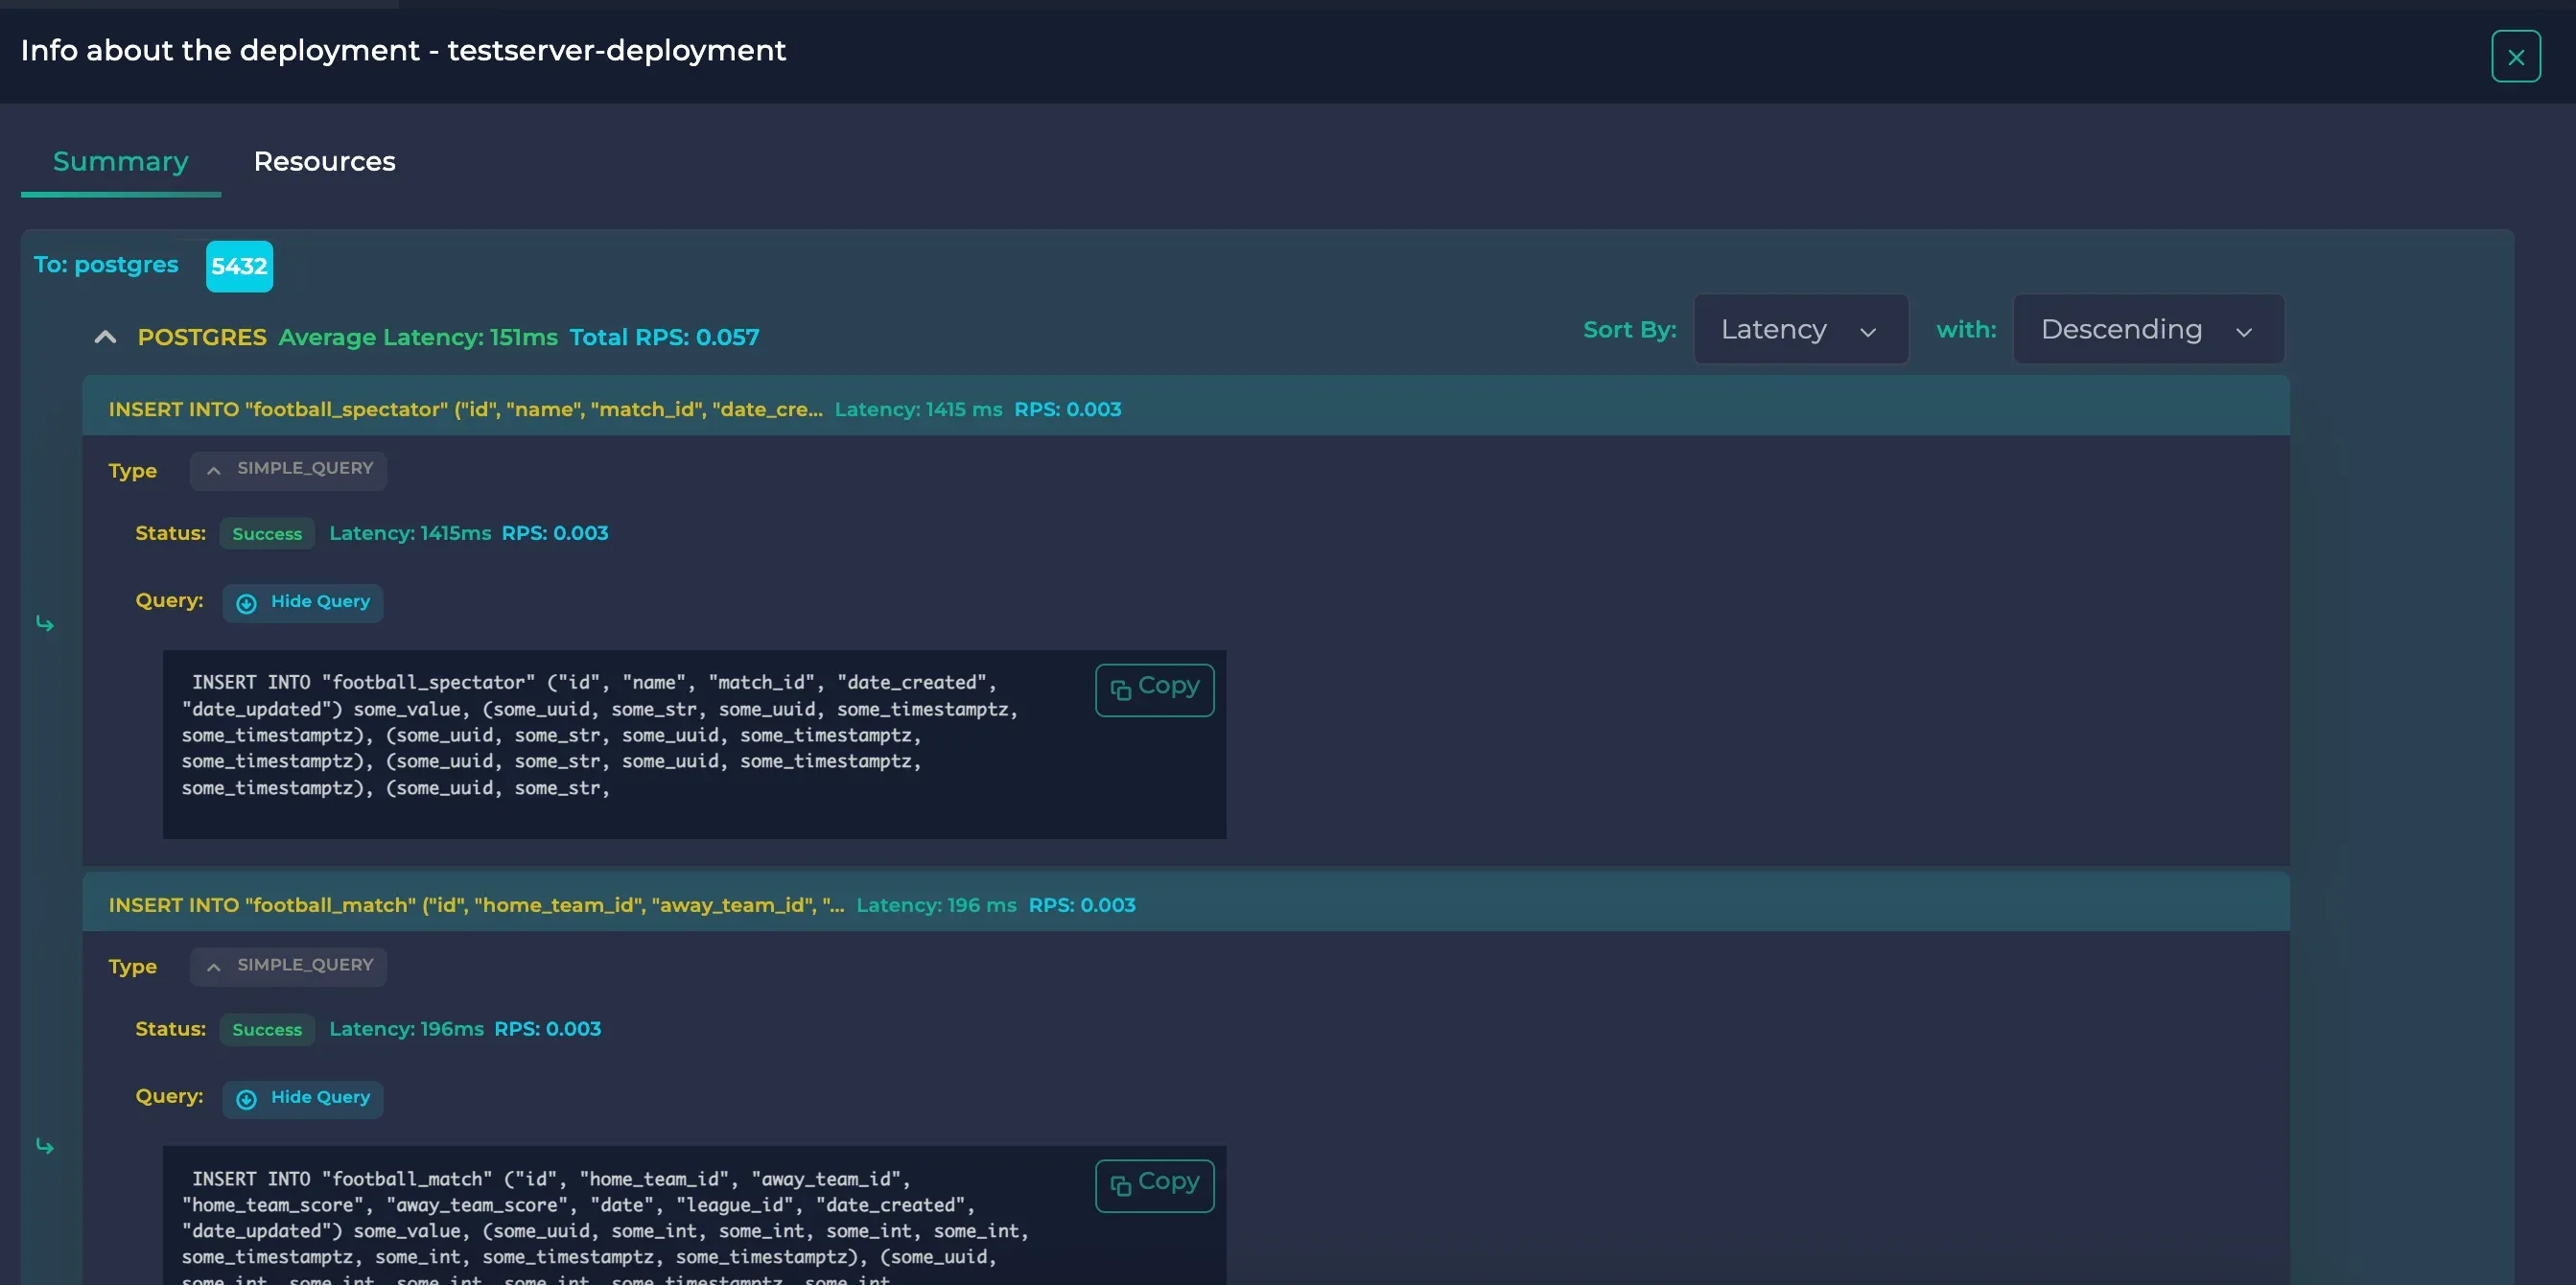
The default ordering is max latency first. If you wish, you can also view max rps or min latency/rps by using the sort selectors in the upper right corner.
Here, we can see that whereas inserting new data to Match took 196 ms, inserting new data to Spectator was nearly 7x slower with 1415 ms.
If you wish to view the count of the current data, you can hit the same endpoint with GET:
curl -X GET http://localhost:8200/football/data
This will return:
{

	"leagues": 100,

	"teams": 1000,

	"players": 10000,

	"matches": 10000,

	"spectators": 100000

}
And you will start to see the Select queries in the resource details:
Postgres traffic including the select queries
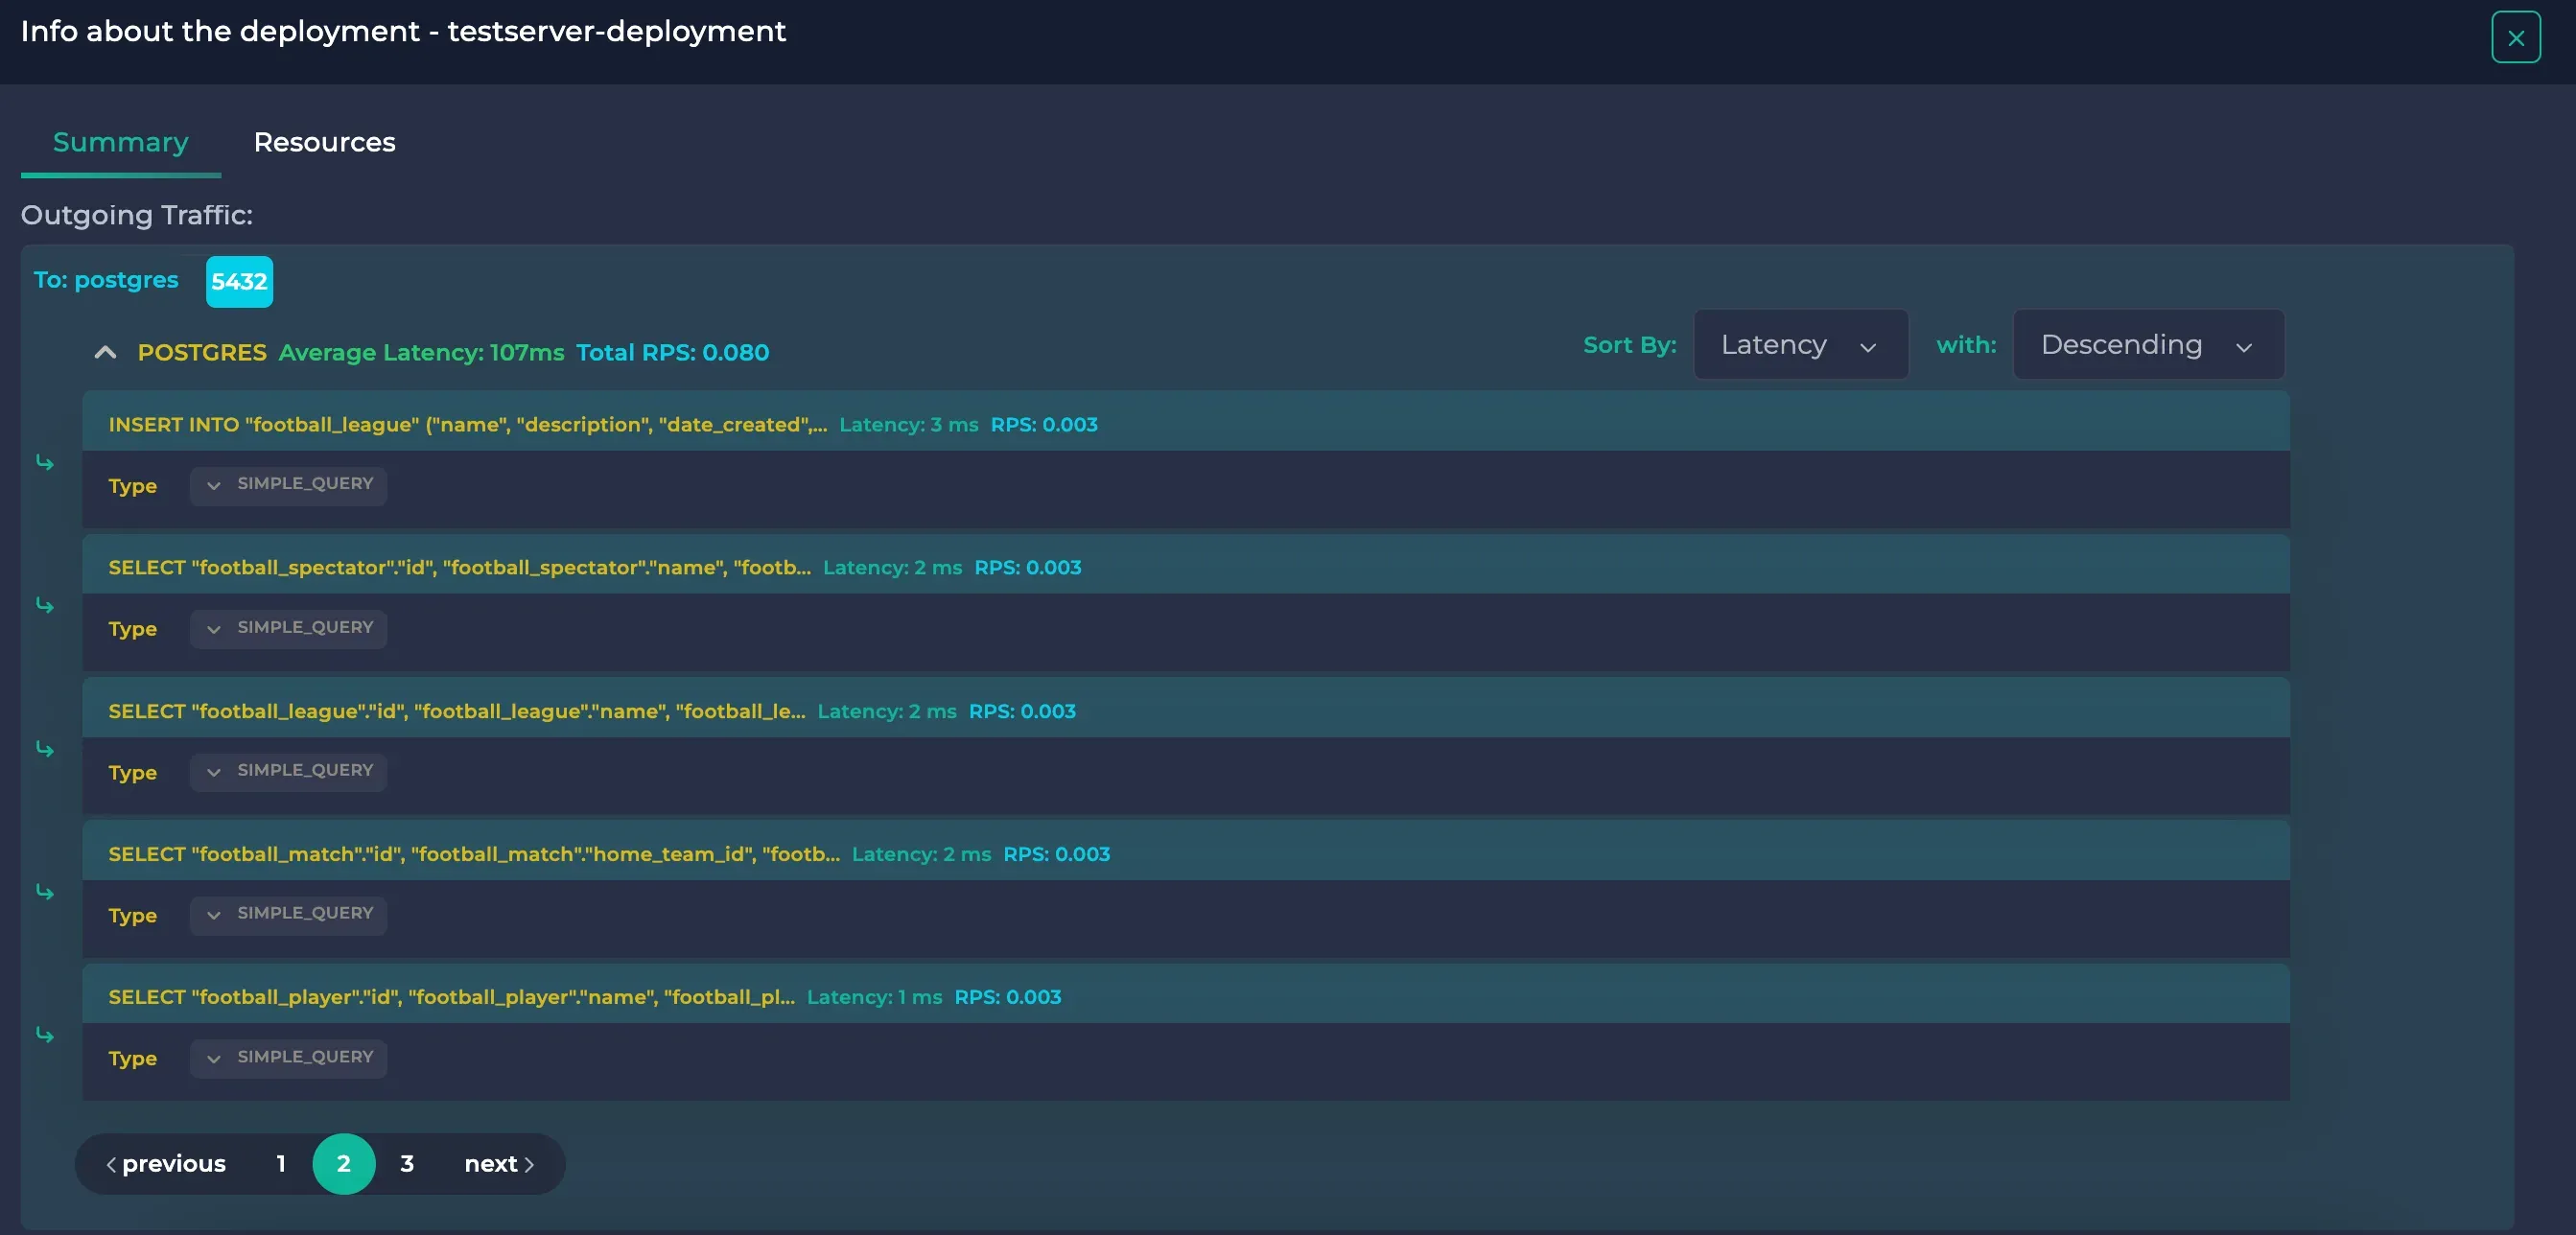
You can see that the Select queries did not take as much time as the Insert queries
Let’s also see an expensive query. Hit the following endpoint:
curl -X GET http://localhost:8200/football/join/
This endpoint joins all of the 5 tables and groups them. Its actual query is this:
SELECT
    League.name AS league_name,
    HomeTeam.name AS team_name,
    Player.name AS player_name,
    Match.home_team_score,
    Match.away_team_score,
    COUNT(DISTINCT Spectator.id) AS spectator_count
FROM
    football_match as Match
JOIN
    football_league as League ON Match.league_id = League.id
JOIN
    football_team AS HomeTeam ON Match.home_team_id = HomeTeam.id
JOIN
    football_team AS AwayTeam ON Match.away_team_id = AwayTeam.id
JOIN
    football_player as Player ON Player.team_id = HomeTeam.id OR Player.team_id = AwayTeam.id
JOIN
    football_spectator as Spectator ON Spectator.match_id = Match.id
GROUP BY
    Match.id, League.name, HomeTeam.name, AwayTeam.name, Player.name
ORDER BY
    League.name, HomeTeam.name, COUNT(DISTINCT Spectator.id) DESC
After you hit this endpoint, it may take some time (about 6 seconds) to calculate the result. Then, you can view this query in Anteon:
The join query
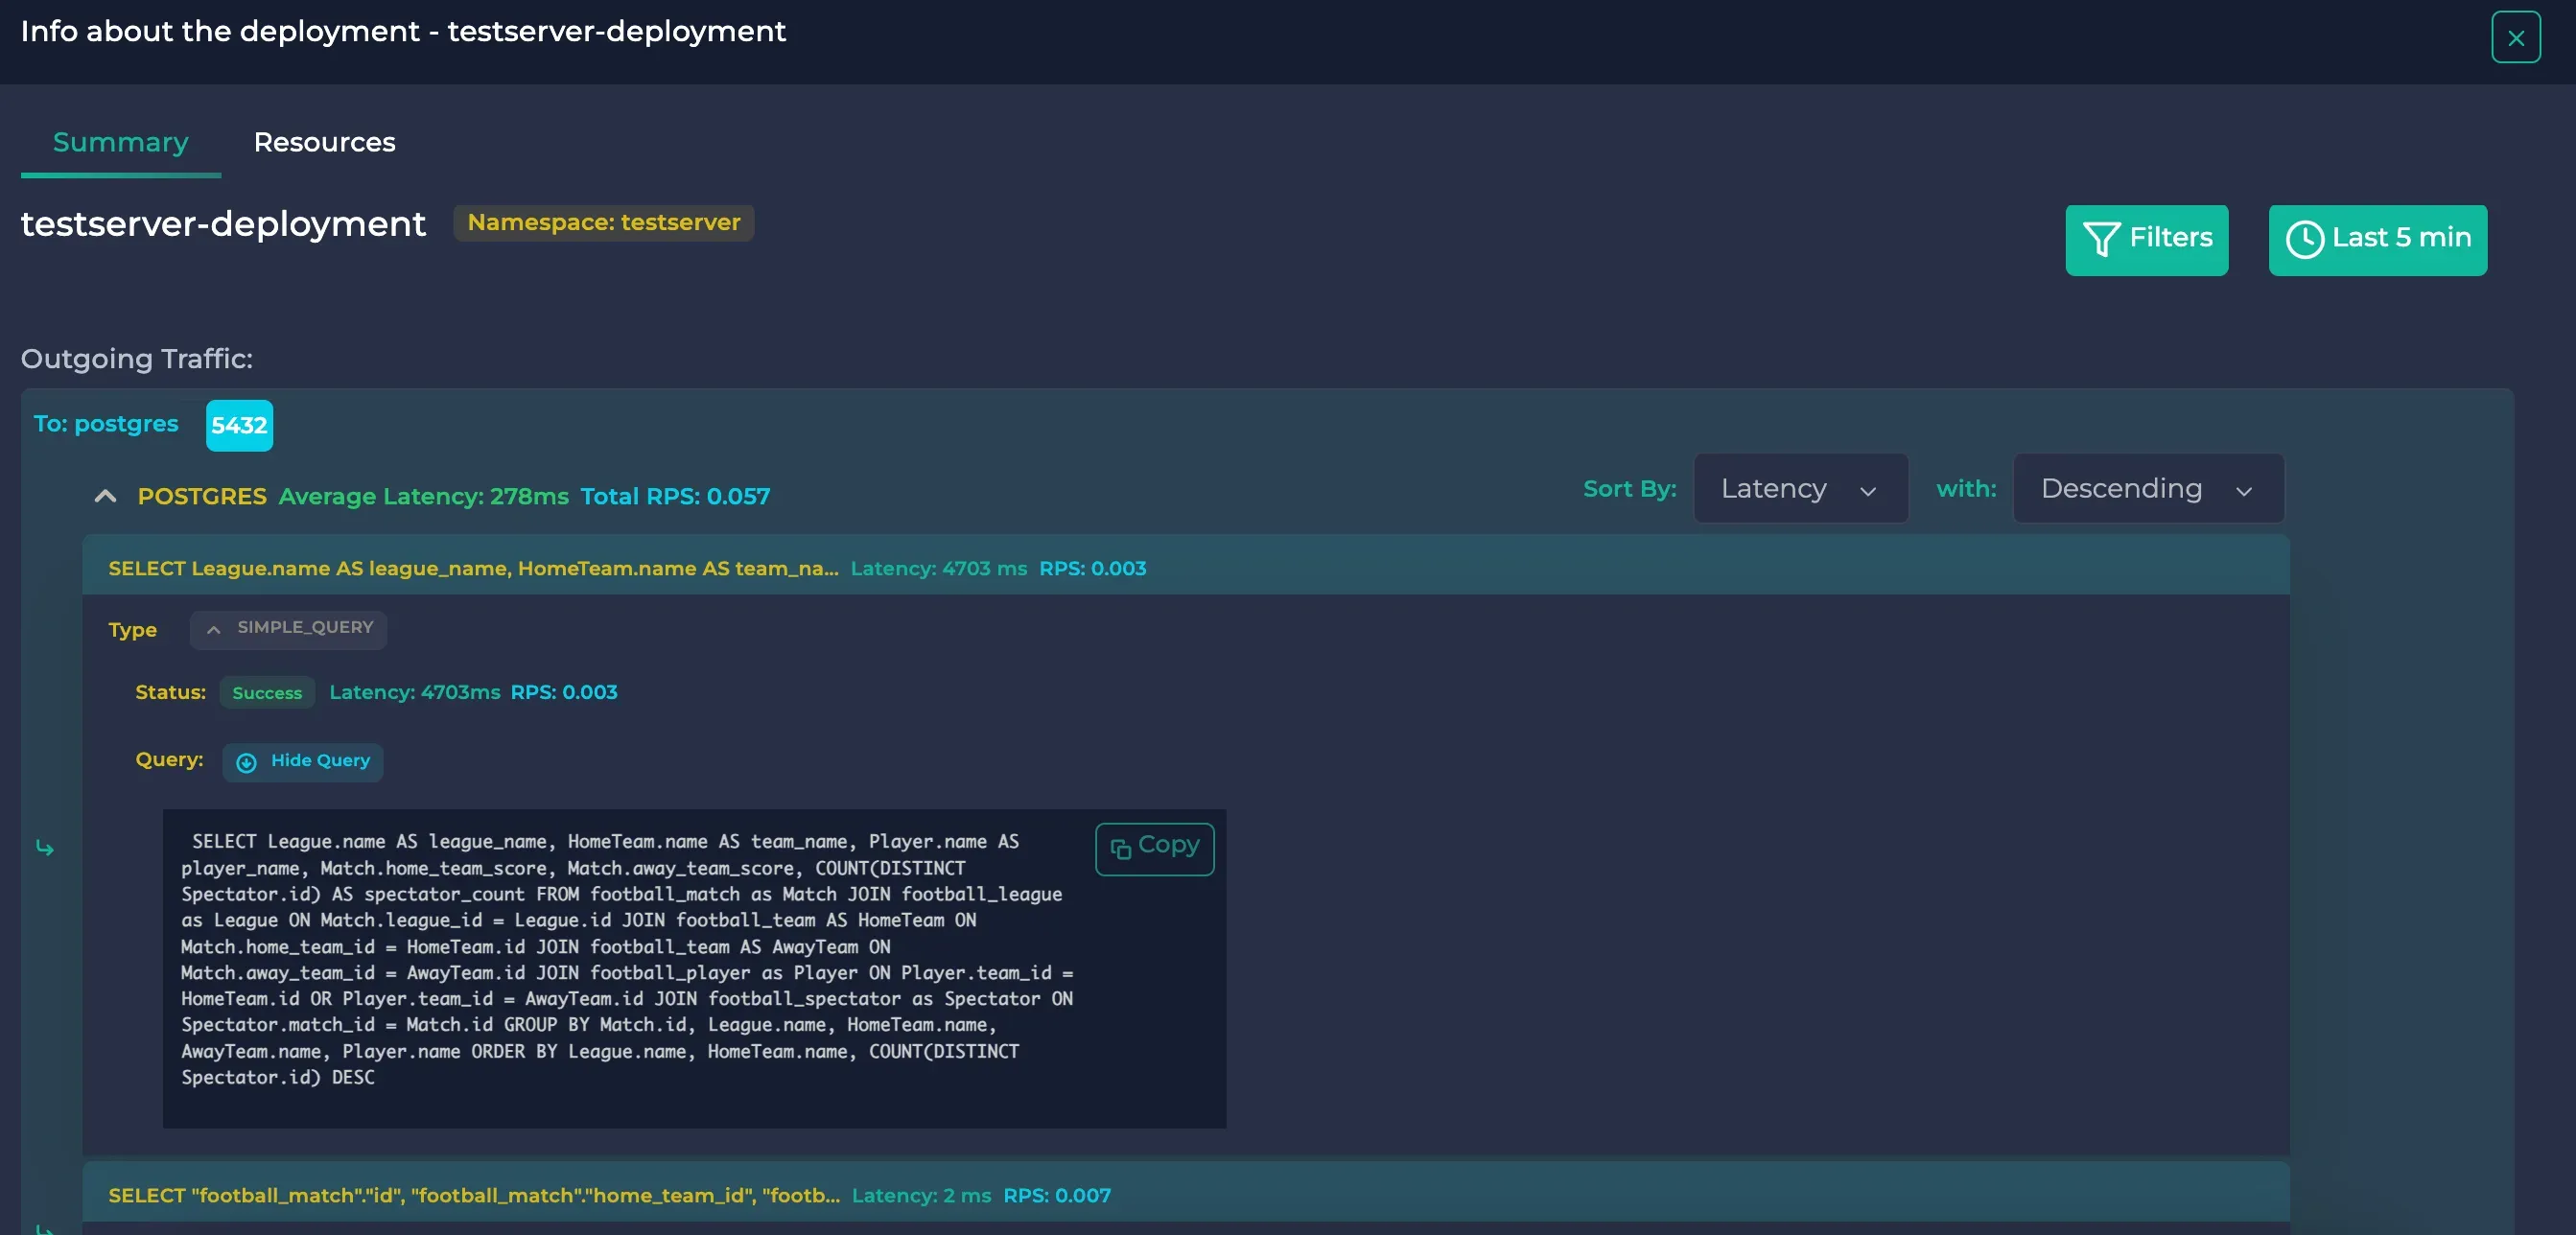
As you can see, it took 4703 ms to finish the query. The query in the details section also matches with the actual query running on the Django server (if the query had literals, they would have been replaced by placeholders).
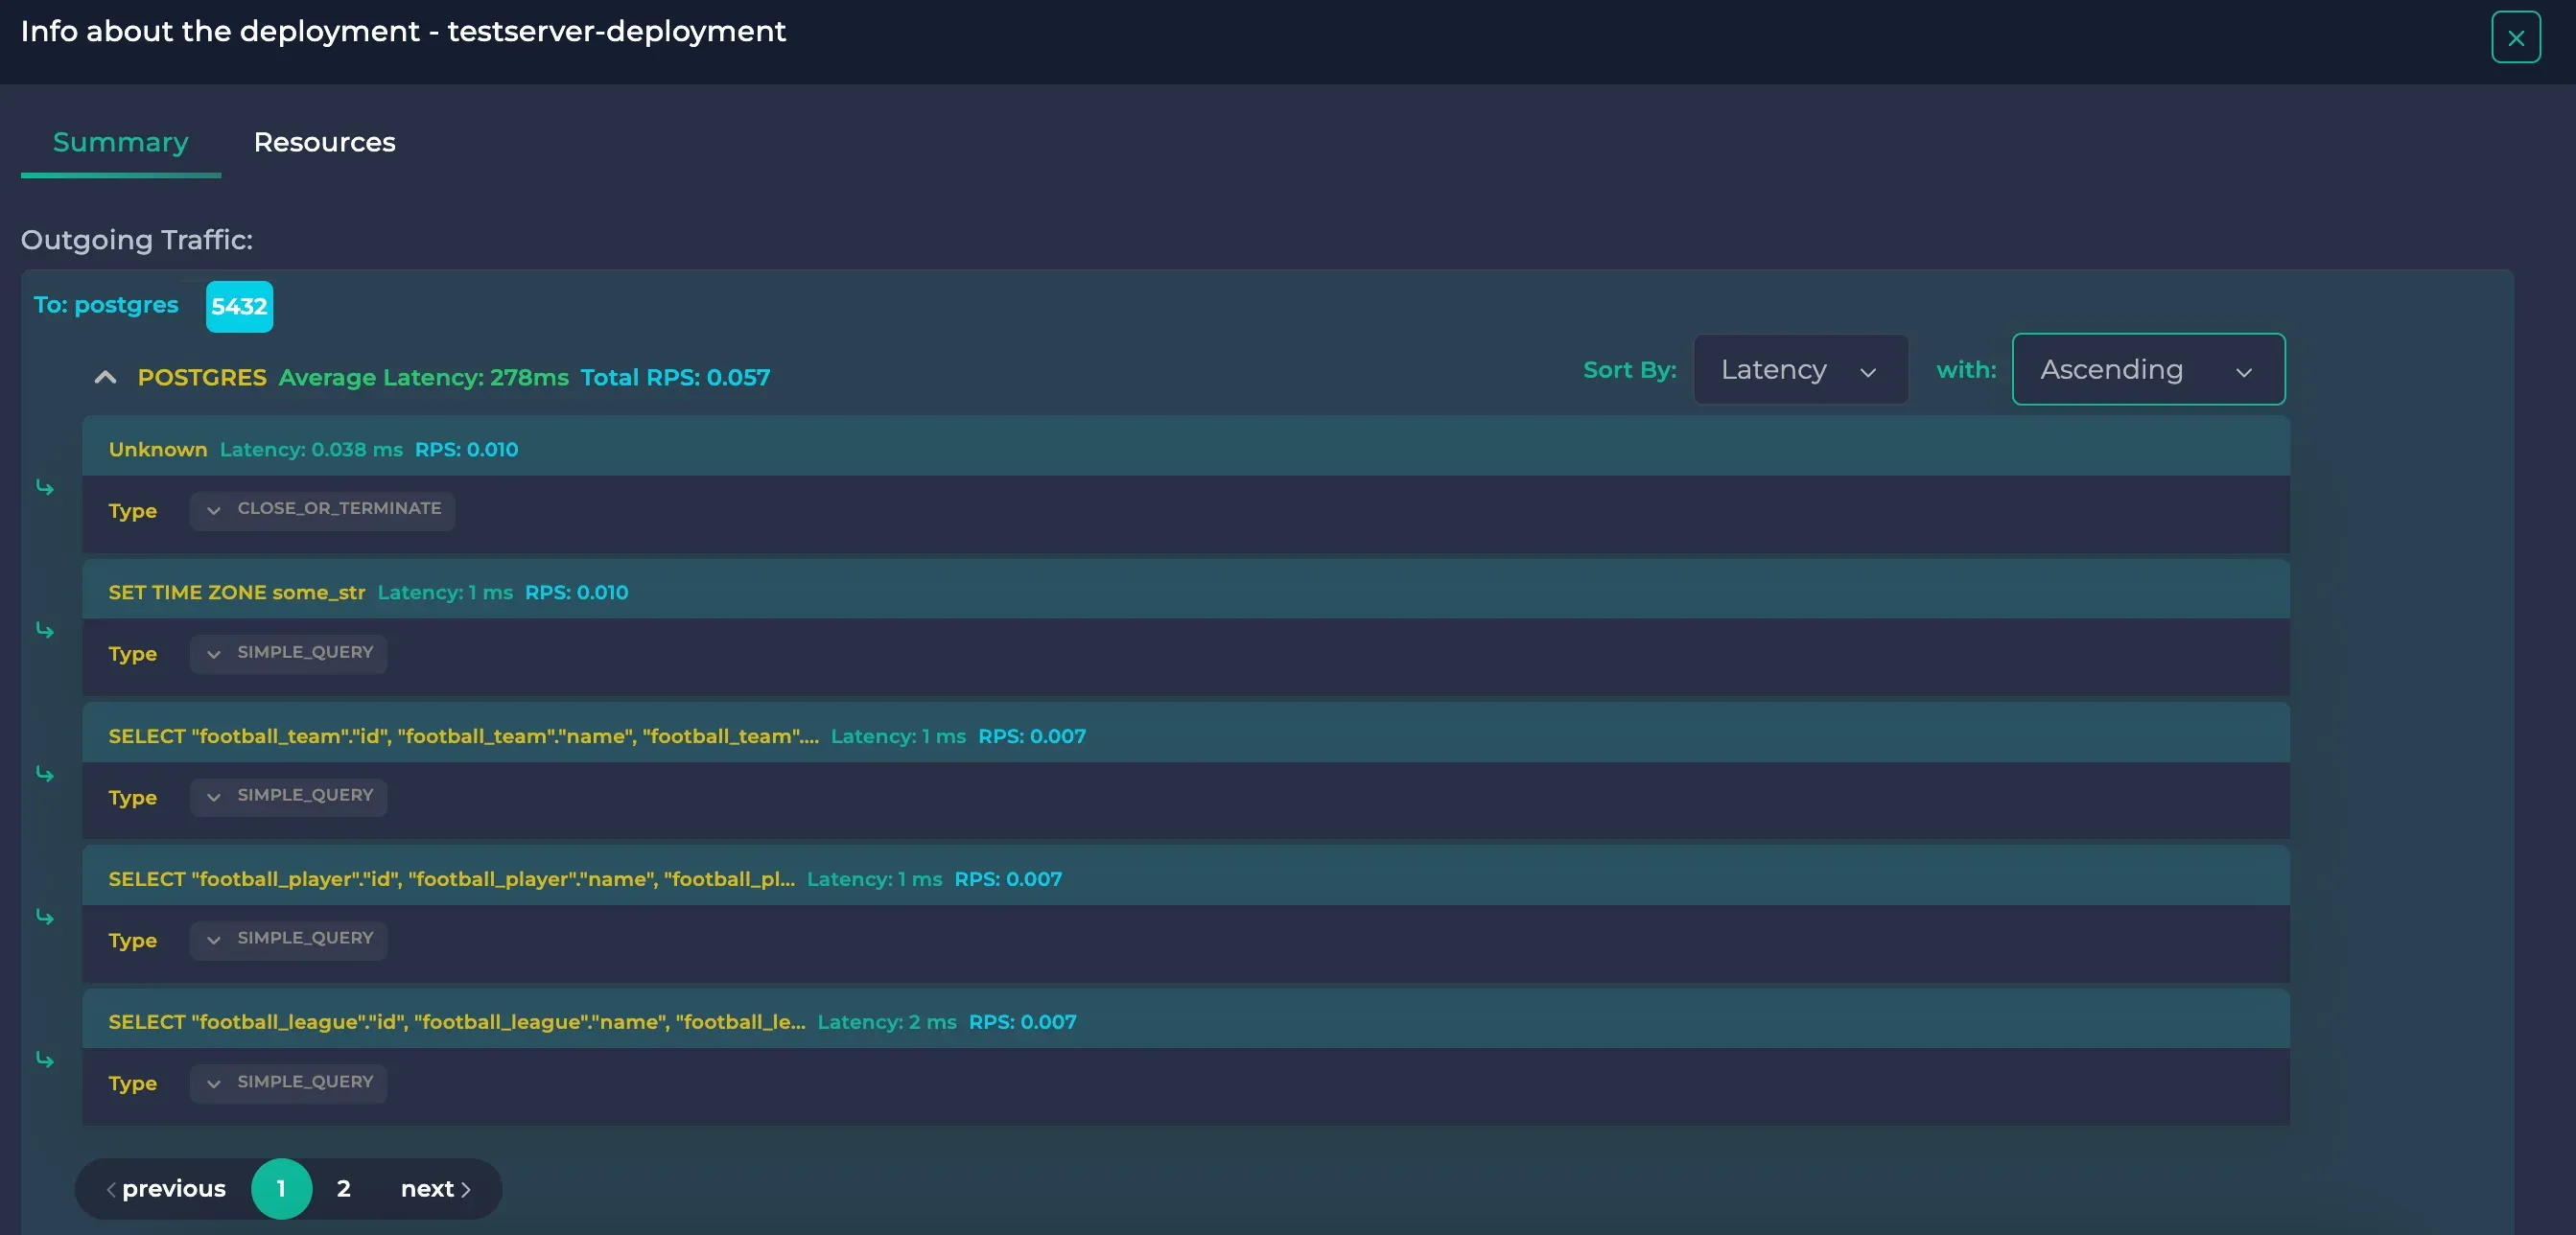
If we wanted to see the fastest queries, we could change the “sort with” option on the upper right corner of the protocol to “Ascending”. It would reveal this:
SQL queries ordered by ascending latency, page 1
SQL queries ordered by ascending latency, page 2
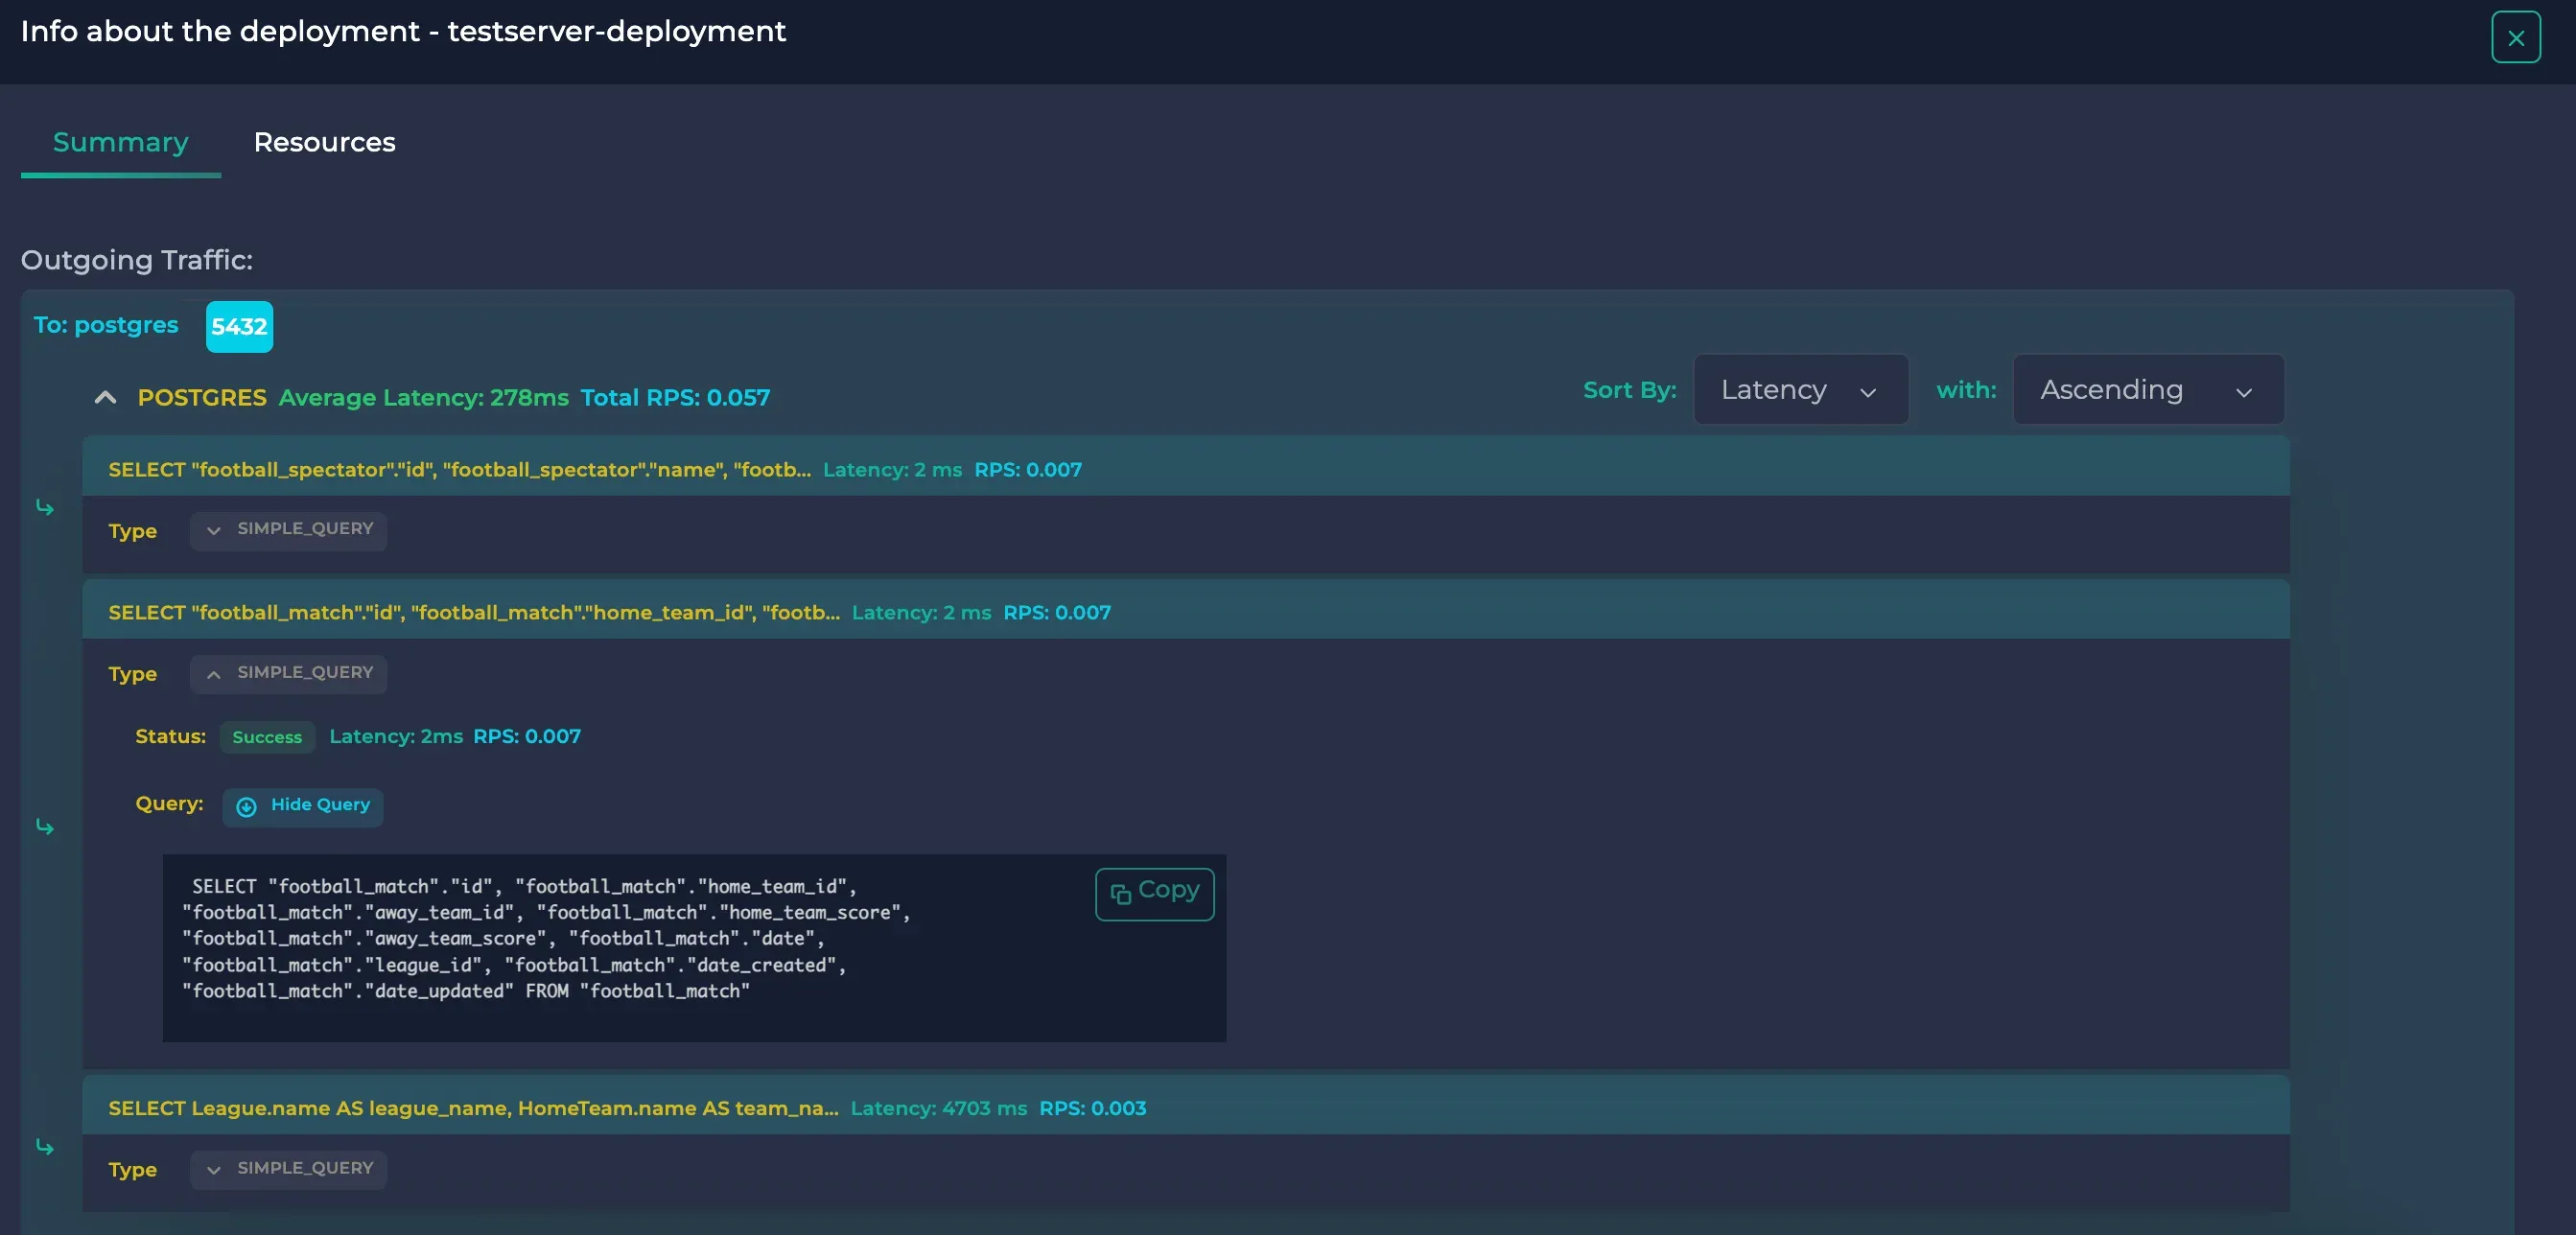
Here, we could see that the select queries done in the GET method of http://localhost:8200/football/data/ are fast, taking at most 2 ms. However, the join query in http://localhost:8200/football/join/ took about 5 seconds. If this were an actual application, the latency being 2500x higher would imply a bottleneck or an inefficient query. As a result, we were able to use Anteon to monitor the SQL queries in our Kubernetes cluster to ensure its health.
Wrapping-up: How to Detect Slow SQL Queries
In conclusion, leveraging Anteon for monitoring the performance of SQL queries, both fast and slow, in your system is an essential step towards ensuring optimal database health and overall application performance. Slow SQL queries can be particularly detrimental, causing significant delays and affecting the user experience. By understanding how to effectively utilize Anteon, you can
-
identify bottlenecks,
-
fine-tune your SQL statements,
-
and ultimately provide a smoother, more reliable user experience.
Remember, consistently monitoring and analyzing your SQL queries isn’t just about fixing immediate issues; it’s about proactively shaping a robust, efficient system that stands the test of time and user demand. If you want to learn more on how to use Anteon to make your Kubernetes cluster bullet-proof through all circumstances, you can check our docs.
⭐️ If you found Anteon platform useful, please star our GitHub repository.