The ability to scale applications efficiently in response to varying loads (i.e. via the increase in website traffic) is crucial for maintaining performance and optimizing resource use. In this post, we are going to talk about Kubernetes autoscaling with Horizontal Pod Autoscaler (HPA).
The Horizontal Pod Autoscaler (HPA) enables Kubernetes Clusters to automatically adjust the number of running Pods based on observed CPU utilization or other selected metrics. This capability not only ensures that applications can handle sudden traffic spikes without manual intervention but also reduces costs by scaling down during low-usage periods.
The HPA is not just about handling peak loads; it's about making sure that your resources are always right-sized, striking the perfect balance between performance and cost.
We will assume that you already know the basic concepts of Kubernetes. If you don’t, check out the “Kubernetes 101 - Introduction & Architecture” blog post.
In the following sections, we will
- Understand the mechanics of Horizontal Pod Autoscaling and how it works
- Move on to using it in a real example
Let’s dive in!
What is Horizontal Pod Autoscaling (HPA)?
Horizontal Pod Autoscaling enables a Kubernetes Cluster to dynamically adjust the number of Pods for a given resource. While vertical scaling would assign more resources to a Pod, horizontal scaling works by assigning extra Pods to a resource. HPAs can be managed and queried through the kubectl API.
To effectively use HPA, you need to:
- Decide on the metrics that will trigger Kubernetes scaling actions. These could include CPU or memory usage, among others. Options include using:
- Default metrics from the Kubernetes Metrics Server.
- Custom metrics, which require exporting them to the Kubernetes Metrics Server via the Custom Metrics API or the External Metrics API. For example, these could be the number of messages in a RabbitMQ queue, Prometheus metrics, etc. More on defining and using custom metrics can be found here.
- Remember, HPA can be applied only to scalable objects, this excludes DaemonSets.
- Ensure Pods have the necessary resource requests set, as HPA uses these to determine Kubernetes scaling actions. For more on resource requests, see the Kubernetes documentation.
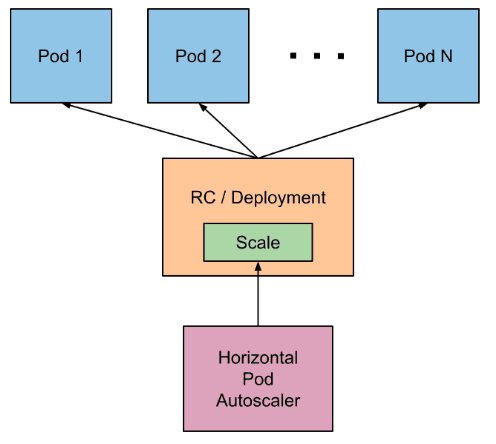
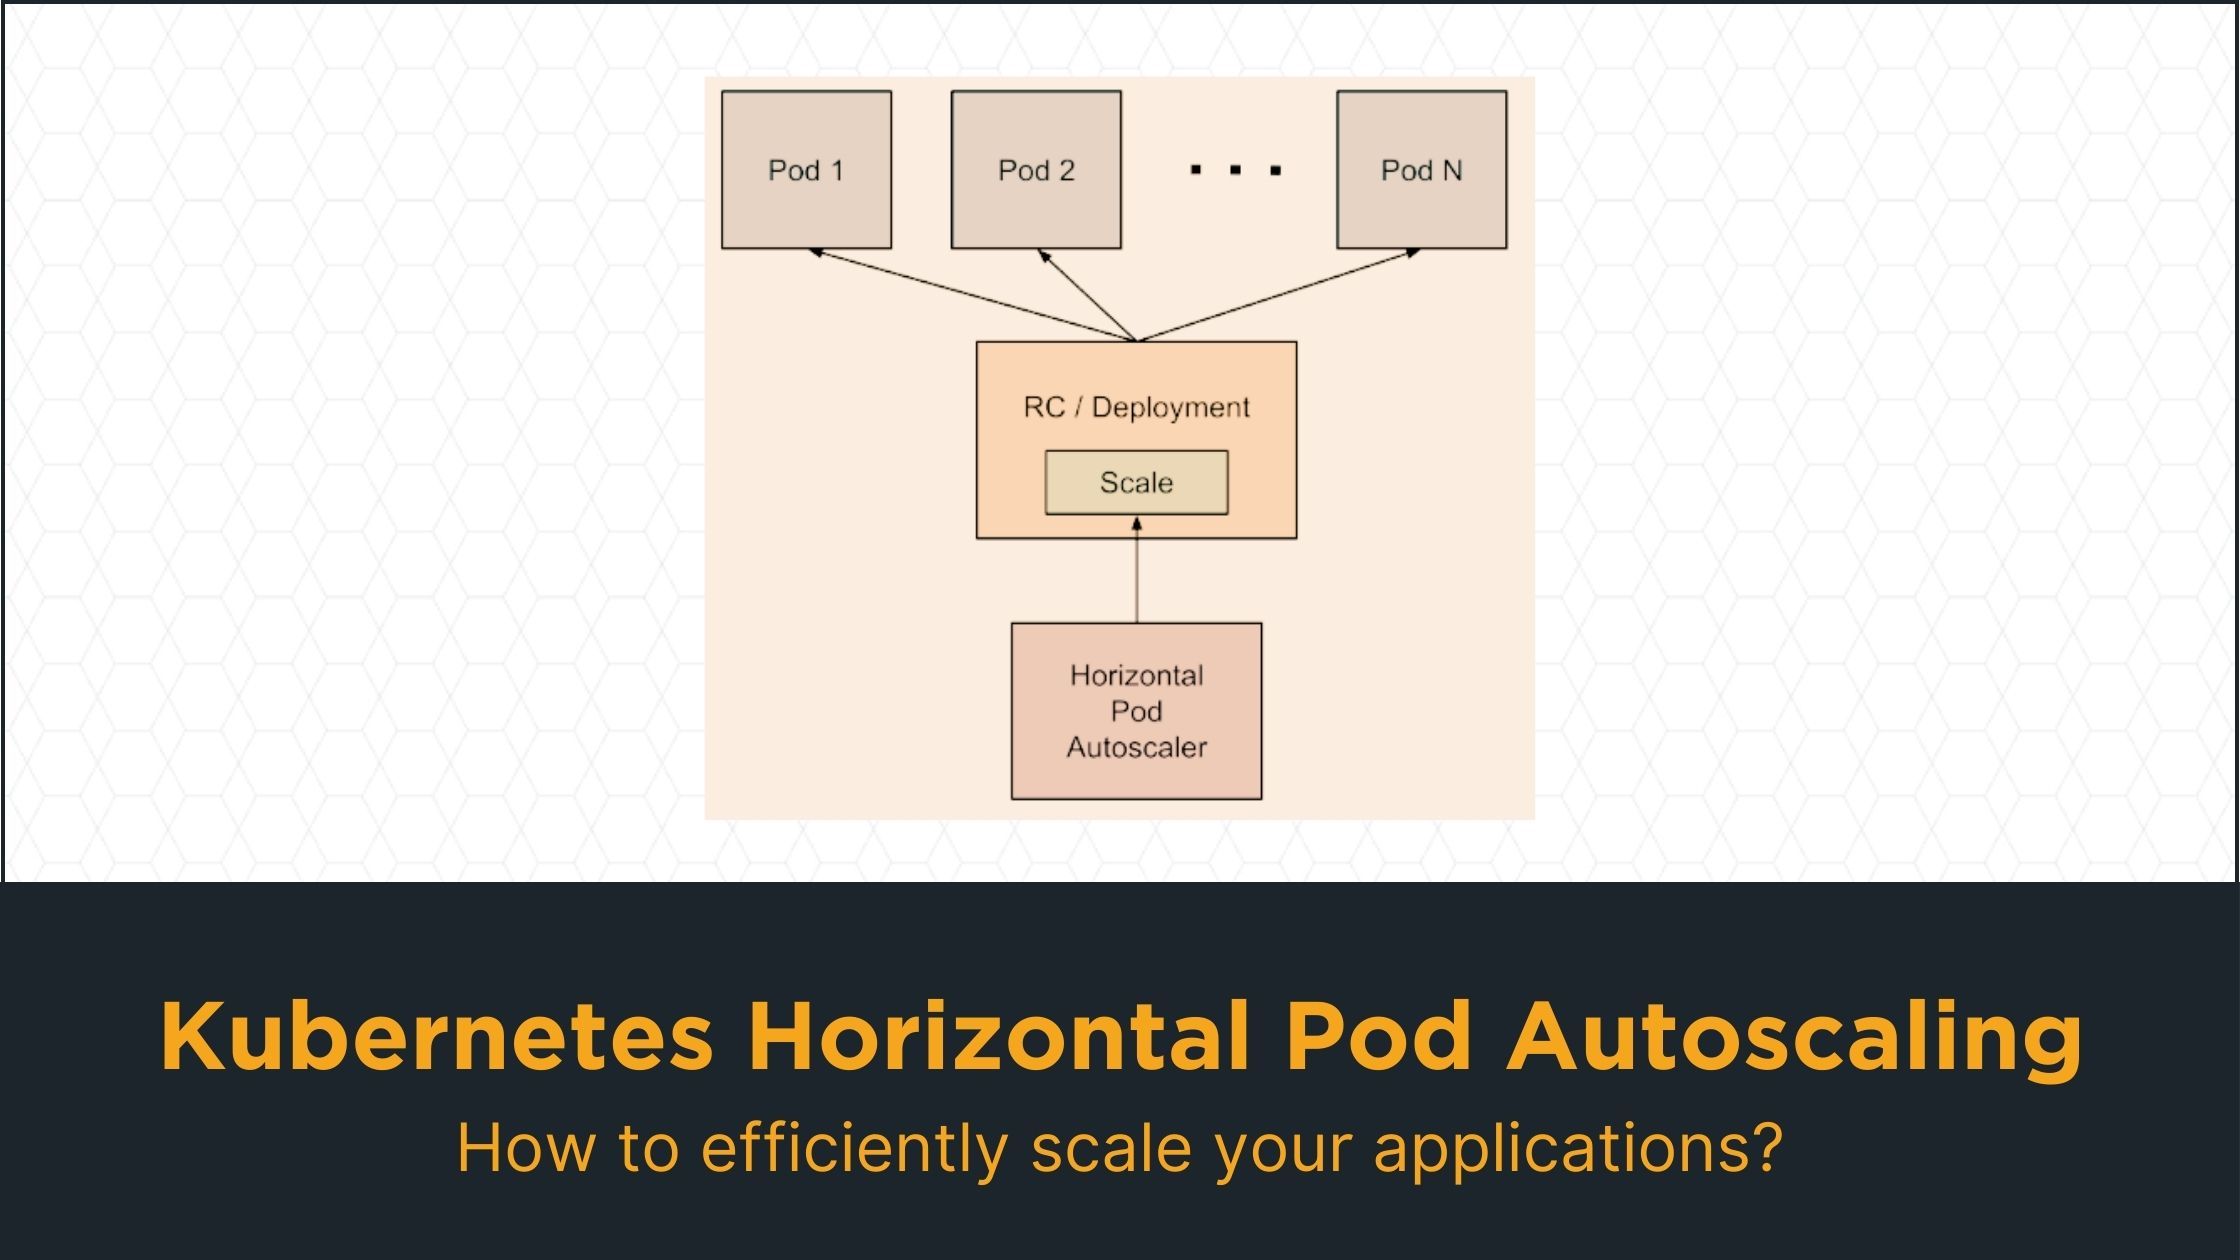
How does Horizontal Pod Autoscaling work?
In a sense, we can think of the work of an HPA as the following:
- It periodically (every 15 seconds as default) queries the resource usage of its target object
- Calculates the average resource usage (for example, it averages all of the Pods of a Deployment)
- You can check here to learn more about the calculation logic.
- Then, depending on the given threshold and the average usage, it calculates the number of desired Pods. This number could be smaller or larger than the current number of Pods. Then, Kubernetes applies this change to the target object to scale it up/down.
- Now that we have a basic idea on Kubernetes Horizontal Pod Autoscaling, let’s try it ourselves.
Demo: Kubernetes Horizontal Pod Autoscaler Example
In the demo, we will:
- Create a Kubernetes Cluster on Minikube
- Configure it and install the required services
- Set up HPA and test it
Prerequisites
We will use a macOS operating system. However, this only affects the installation of Minikube and you can find a link for installing it on different operating systems in the relevant section.
- Kubectl
- Required to manage the Kubernetes Cluster
- Homebrew (if on macOS)
- Required to install Minikube
- To see how you can install it, you can check its website.
1. Creating a Kubernetes Cluster
First of all, we need to create a local demo Kubernetes Cluster to test Horizontal Pod Autoscaling (HPA). For this purpose, we should first install Minikube and then set up a Cluster.
1.1 Installing Minikube
The way you install Minikube depends on your operating system. Here, we will use the ARM64 macOS architecture. For more information about the installation instructions for other operating systems, you can check the first section (Installation) here.
Here, we will use the Homebrew installer. To do so, execute this:
brew install minikube
With this, we can move on to setting up a Kubernetes Cluster.
1.2 Setting up a Kubernetes Cluster on Minikube
Execute this:
minikube start
This will take some time. After a while, you should expect an output like this:
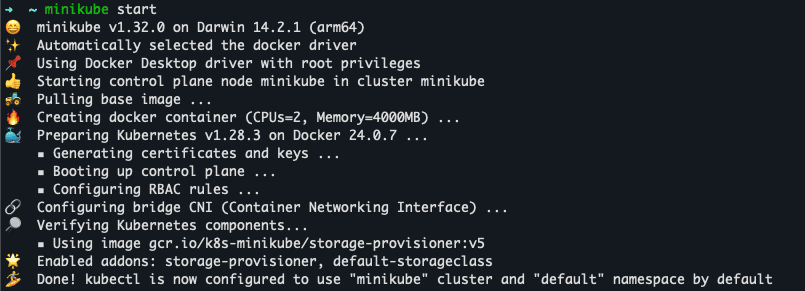
And that’s all! Now we have a Kubernetes Cluster running in Minikube.
This command will also set the default context of kubectl to this newly created Cluster. This means that you do not have to configure kubectl to access this Cluster. However, if you want to access your other Clusters through kubectl, you need to use kubectl use-context <context_name> to switch to the appropriate context before executing any other commands.
2. Configuring the Cluster
2.1 Installing Kubernetes Metrics Server
Kubernetes Metrics Server allows a Kubernetes Cluster to know about its resource usage. Since we will use the Pod metrics (CPU usage, to be more specific) to determine on how and when to scale the Pods, we need to install it. To do so, we will use kubectl:
kubectl apply -f https://github.com/kubernetes-sigs/metrics-server/releases/latest/download/components.yaml
This is the output you should expect:
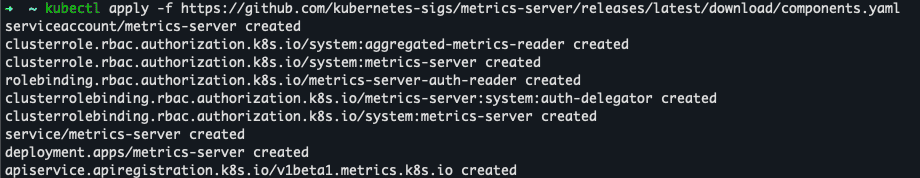
Running this command applies the metrics server configuration YAML in the given URL and installs it in your cluster. After this, you can verify its status:
kubectl get deployment metrics-server -n kube-system
Here, we will see this:

We see that even though it was deployed 3 minutes 43 seconds ago, metrics-server still hasn’t been up yet. We can check its logs with:
kubectl logs deployment/metrics-server -n kube-system
2.2 Fixing the IP SANs Problem
Here, the important thing is the error:
E0306 17:19:41.746695 1 scraper.go:149] "Failed to scrape node" err="Get \"https://192.168.49.2:10250/metrics/resource\": tls: failed to verify certificate: x509: cannot validate certificate for 192.168.49.2 because it doesn't contain any IP SANs" node="minikube"
This tells us that there has been a certificate validation problem between the node and the Kubelet API. For more information about certificates in Kubernetes, you can check the docs. To handle this issue, we will follow the solution given in this blog post.
According to the blog post, we need to add the config serverTLSBootstrap: true to the ConfigMap named kubelet-config and all nodes of our cluster (we have only one since we are using Minikube).
2.2.1 Editing the kubelet-config
To edit the ConfigMap, execute this:
kubectl edit configmap kubelet-config -n kube-system
This will take your terminal window to the configuration file. Here, add the line serverTLSBootstrap: true under the line kind: KubeletConfiguration. It should look like this:
...
    kind: KubeletConfiguration
    serverTLSBootstrap: true
...
Then save the file and exit.
2.2.2 Editing the Kubelet Config On the Kubernetes Node
First, we need to connect to the minikube’s virtual machine (VM) node:
minikube ssh
Then open the config file located in /var/lib/kubelet/config.yaml with your preferred text editor.
sudo vi /var/lib/kubelet/config.yaml
Here, do the same as the step 2.2.1. You should have a section like this:
...
    kind: KubeletConfiguration
    serverTLSBootstrap: true
...
Then restart the kubelet service:
sudo systemctl restart kubelet
Exit the ssh and return to your host. Now restart the metrics-server:
kubectl rollout restart deployment metrics-server -n kube-system
Then we need to sign the certificates. Run this:
kubectl get csr
You will see this. On the right, you can see that the last certificate is waiting for approval. Find its name (csr-t2pkd in this case):

Run the command
kubectl certificate approve <csr_name>

# In our case, the command is
# kubectl certificate approve csr-t2pkd
Restart the metrics-server again
kubectl rollout restart deployment metrics-server -n kube-system
After a while, you can check the status of the metrics-server using the command:
kubectl get deployment metrics-server -n kube-system
If you see this, it means that the server works correctly.

2.3 Installing the Demo App
Now we need a sample application to deploy on Kubernetes to test the scaling. For this purpose, we can deploy a basic Django app containing an endpoint (with a URL http://testserver-service:8200/computation?fib=5) that recursively calculates the fibonacci number of the given query parameter (5 in this case). To do so, execute
kubectl apply -f https://raw.githubusercontent.com/getanteon/blog_examples/main/009_kubernetes_hpa/sample_application.yaml
This is the output you expect to see:
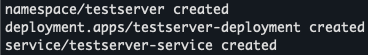
Let’s also check the status of the application:
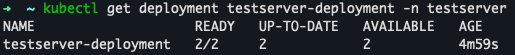
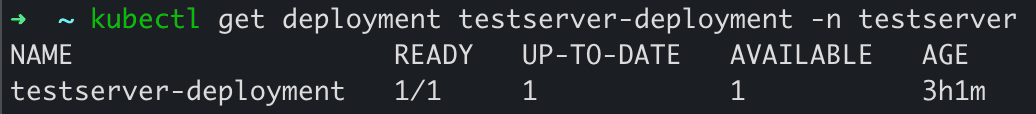
kubectl get deployment testserver-deployment -n testserver

As you can see, the deployment has successfully started up.
3. Horizontal Pod Autoscaling (HPA)
Now that we have our cluster and apps set up, we can finally move on to testing the Horizontal Pod Autoscaling (HPA).
3.1 Setting the HPA Up
For the thresholds, we will use the following:
- CPU Percent: 50 (this means that we want our Pods to use at most 50% of their requested CPU’s. If this threshold is exceeded, HPA will assign new Pods to our deployment)
- Min Pods: 1
- Max Pods: 10
Execute this:
kubectl autoscale deployment testserver-deployment -n testserver --cpu-percent=50 --min=1 --max=10Note: It is important to set the namespace of the HPA the same as the namespace of the deployment that we want to scale.
You will see this

Let’s also check its status
kubectl get hpa -n testserver
Here, we see that the Horizontal Pod Autoscaler has successfully been set up.

3.2 Verifying the HPA
Let’s generate a load on the app to see if it is scaled or not. For this purpose, we can execute this:
kubectl run -i \
    --tty load-generator \
    --namespace testserver \
    --rm --image=busybox \
    --restart=Never \
    -- /bin/sh -c "while sleep 0.1; do wget -q -O- http://testserver-service:8200/computation?fib=5; done"
Let’s first see what this command does:
kubectl run: Runs an image on the Kubernetes cluster-i —tty: Runs the image on an interactive terminal.load-generator: Assign the nameload-generatorto the Pod we are starting up—namespace testserver: Sets the namespace of the Pod astestserver. This is useful as it allows the Pod to refer to the service of our app by only using its name.-rm: Removes the Pod once it finishes execution—image=busybox: Specifies the image of the Pod. In this case, BusyBox is a lightweight Unix distribution.—restart=Never: Prevents this Pod from being restarted once it is deleted-- /bin/sh -c "while sleep 0.1; do wget -q -O- http://testserver-service:8200/computation?fib=5; done": Runs a bash command that sends a request to our computation endpoint in an infinite loop every 0.1 seconds. You can change fib=5 to any other value to increase/decrease the load.
Before running the command, verify that we have a single Pod hosting our app
kubectl get deployment testserver-deployment -n testserver

Now let’s run the command. You will see this:

After waiting for a while, go ahead and run this to check the status of our test app:
kubectl get deployment testserver-deployment -n testserver
You can see that the number of Pods is increased to 2 due to the load.
You can experiment with the sleep duration and the fibonacci query parameter to see how the number of Pods change. You can also run this command to see the status of the HPA:
kubectl get hpa -n testserver
Here, the below image tells us that even though there are 2 replicas, the average CPU usage (65%) exceeded our threshold of 50%. So we can expect new Pods to appear. After waiting a while and re-executing the command, we can see that we now have 3 Pods.

Now go ahead to the terminal where you started the load generator and stop its execution. After waiting a while, you can see that the number of Pods is reduced to 1, the minimum value we specified in the HPA.
Conclusion
As you can see, the Kubernetes Horizontal Pod Autoscaler (HPA) stands as a testament to the platform's ability to provide robust, scalable solutions for managing containerized applications.
Through its intelligent monitoring and automated Kubernetes scaling capabilities, HPA ensures that applications can effortlessly adapt to changing demands, maintaining optimal performance while efficiently utilizing resources.
By aligning resource allocation with actual demand, HPA not only maximizes application performance but also contributes to a more sustainable and cost-effective use of computing resources. And with the Kubernetes autoscaling example in this post, we demonstrated how you can make use of HPA.
If you want to learn more about the intricacies of HPA in Kubernetes, you can check here.
Until the next blog post, happy monitoring!