Redis, in-memory key-value store performs read and write operations significantly faster than databases that rely on conventional storage methods. This performance edge has led major tech companies like X (formerly Twitter), GitHub, and Snapchat to rely on Redis cluster. Likewise, leading cloud providers such as GCP, AWS, and Azure offer hosted Redis-based data stores. However, Redis isn’t without its challenges. Issues like memory exhaustion and CPU spikes can degrade performance and increase latency. Resolving these issues is crucial to maintaining optimal performance.

In this blog post, we delve into how Anteon leverages eBPF (extended Berkeley Packet Filter) to efficiently monitor Redis deployments within Kubernetes environments. By using eBPF monitoring, we provide real-time traffic monitoring and Kubernetes observability to identify and troubleshoot performance issues. Monitoring Redis databases and Kubernetes traffic using open-source tools like the Alaz eBPF agent offers insights that traditional methods often miss. These cloud-native monitoring tools help our clients pinpoint and resolve database bottlenecks, enhancing application performance. We’ll begin with a theoretical overview and finish with a practical code example, providing a thorough guide how we implemented this observability solution.
What is a Redis Cluster?
Redis, an acronym for REmote DIctionary Server, was created by Salvatore Sanfilippo in 2009 to enhance scalability and performance for a web log analyzer. It quickly gained popularity and today, Redis serves multiple roles: as a cache for frequently accessed data, and as a message broker in real-time applications, enabling rapid data communication between services. This made Redis increasingly popular in distributed applications.
Redis Serialization Protocol (RESP)
The Redis Serialization Protocol (RESP) is an L7 protocol used by Redis to facilitate communication between clients and servers. RESP is designed to handle various types of data structures exchanged between clients and servers. For example, consider the following message:
*3 $3 SET $4 name $6 anteon
: The*3*character is used to specify an array data type, and the number3indicates that the array contains three elements.
: The$3$character specifies a bulk string “SET”, and the number3indicates that the string length is 3 characters.
: This is the first element of the array and a Redis command to set a key to a specified value.SET
: Similar to the previous$4$3, this indicates another bulk string “name” with a length of 4 bytes.
: This is the second element of the array, representing the key to be set.name
: This indicates a bulk string “anteon” with a length of 6 bytes.$6
: This is the third element of the array, representing the value to be set for the key.anteon
This is just one of the possible commands in RESP. The protocol supports various other types of data structures, each with its own prefix:
- Simple Strings: Prefixed with
+ - Errors: Prefixed with
- - Integers: Prefixed with
:
These prefixes help Redis efficiently parse and handle different types of data exchanged between clients and servers.
Common Reddis Issues
As with every application component, Redis requires specific monitoring and tuning to function appropriately under varying application loads. Let’s outline a couple of scenarios a developer might encounter:
Out-of-Memory
One of the simplest errors one might encounter is the out-of-memory error. Redis has built-in protections that allow users to set a maximum limit on memory usage using the maxmemory option in the configuration file. Once this limit is reached, Redis will start replying with an error to write commands (while continuing to accept read-only commands).
Latency
To monitor memory usage and other statistics, you can use the Redis command line redis-cli with the INFO commandstats command. Here’s an example of its output:
cmdstat_set:calls=11796,usec=43329,usec_per_call=3.67,rejected_calls=0,failed_calls=563
cmdstat_command|docs:calls=2,usec=3820,usec_per_call=1910.00,rejected_calls=0,failed_calls=0
This command provides statistics for each Redis command, including the number of failed and rejected calls, and the average execution latency per call under the usec_per_call key.

CPU spikes
Under complex calls, a Redis deployment can experience high CPU spikes, which can be detrimental to your application and must be monitored and handled appropriately.
💡 Beside the observability features, our platform also provides extensive metrics — invaluable for introspecting various components performance.
Redis on Kubernetes the right way
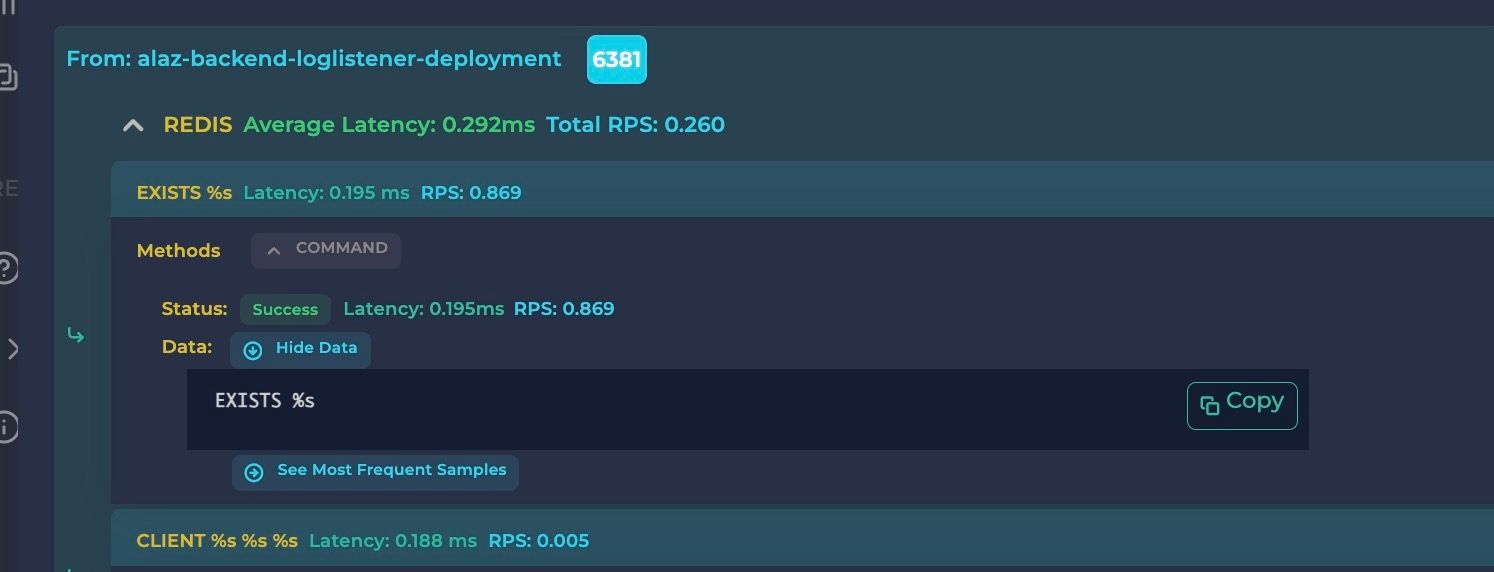
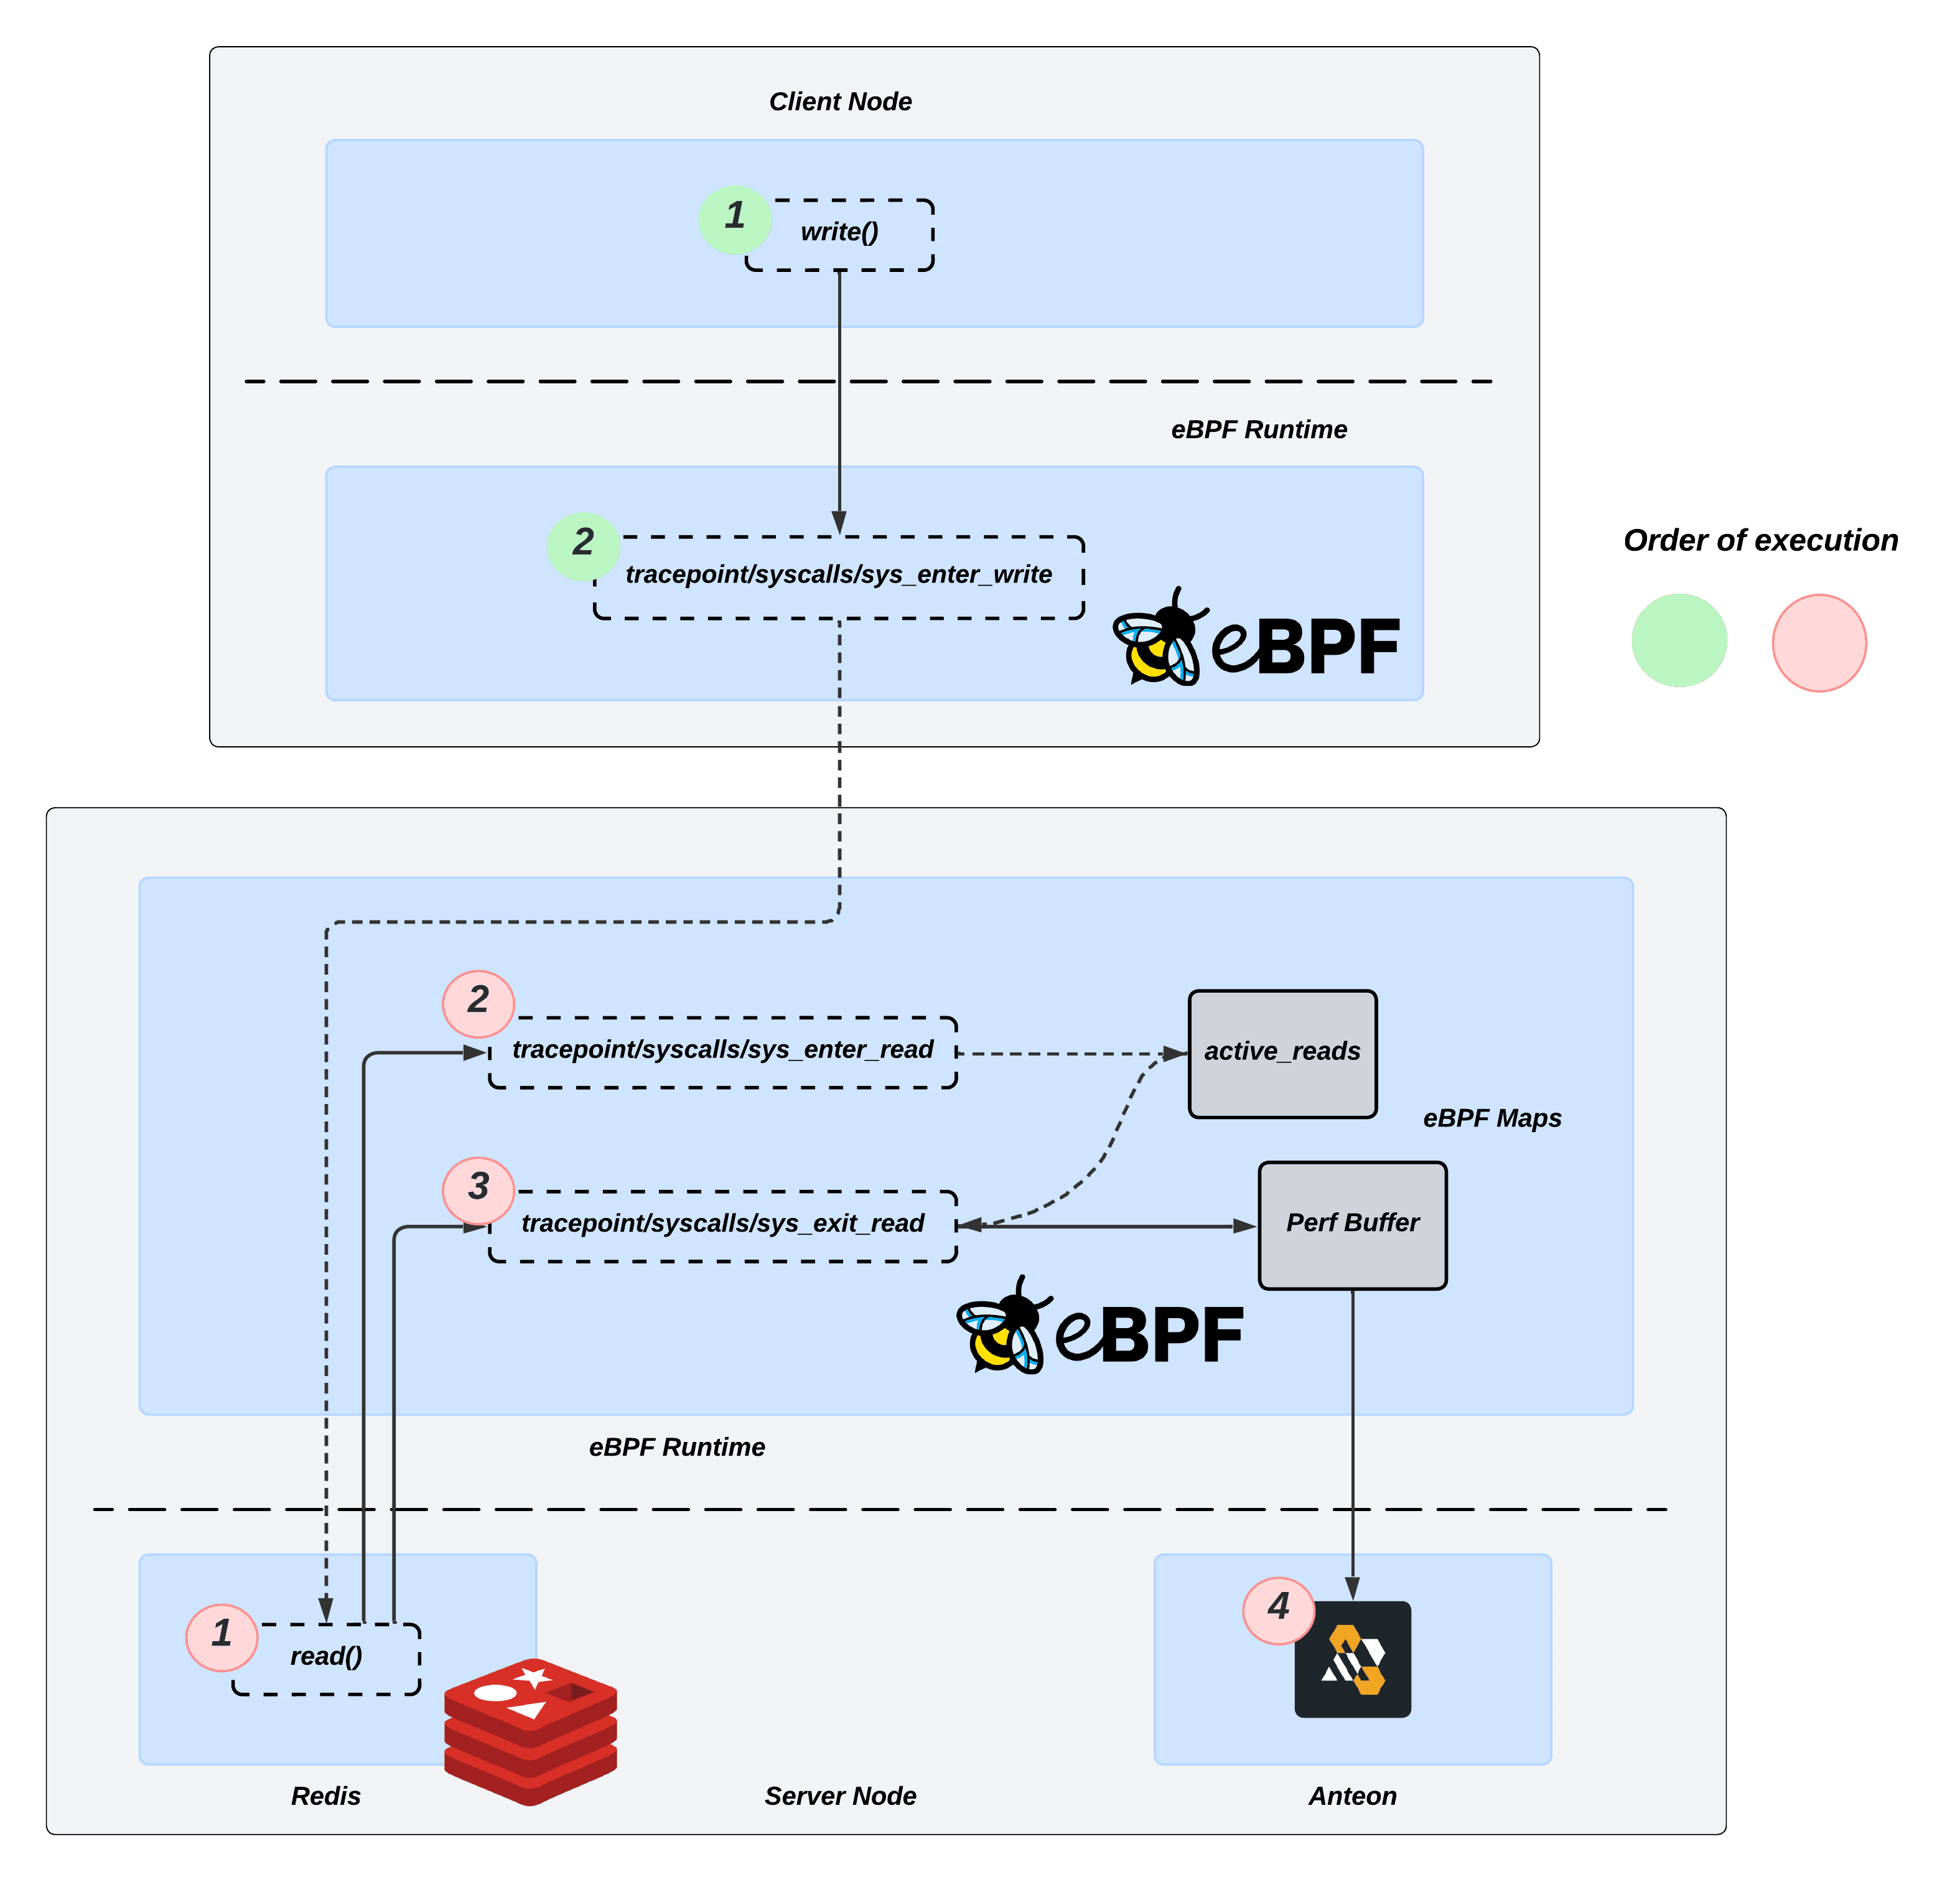
Our platform utilizes an eBPF agent named Alaz, which runs as a DaemonSet on your Kubernetes cluster. The agent’s primary task is to load and attach eBPF programs on each Kubernetes node, and then it listens for kernel events transferred to the user space via eBPF maps. While we’d love to delve into eBPF here in detail, it deserves its own dedicated post, if not an entire series. If you’re not familiar with it yet, there are numerous online resources available that can provide you with a quick introduction.
The following code snippets reference specific parts of our Agent. The complete source code is available in our GitHub repository.
💡 For more insights on database protocol observation, you can check out our discussion on monitoring the PostgreSQL protocol here.
For the case of Redis, after socket creation and connection establishment between the client and server, the kernel will call the write function of the socket’s protocol handler to send data to the server. The kernel will call the read function of the socket’s protocol handler to receive data from the remote peer.
Therefore, the objective is to attach to these syscall hook points:
: Triggered ontracepoint/syscalls/sys_enter_writewritesyscall and used to capture sent data. Provides access to the input arguments of thewritesyscall.
: Triggered on the enter oftracepoint/syscalls/sys_enter_readreadsyscall and used to capture received data. Provides access to the input arguments of thereadsyscall.
: Triggered on the exit oftracepoint/syscalls/sys_exit_readreadsyscall. Provides access to the return values of thereadsyscall.
These hook points provide us access to connection file descriptor, socket address, and Redis queries, including their type, parameters.
💡 In the context of eBPF programs, the in-kernel attachment points are commonly referred to as Hooks or Hook points. Each hook point varies primarily in terms of which in-kernel data types and variables it can access.
During the write syscall our tracepoint program parses the send data (buf variable) and checks whether it is any of the RESP commands:
ping:
static __always_inline
int is_redis_ping(char *buf, __u64 buf_size) {
    if (buf_size < 14) {
        return 0;
    }
    char b[14];
    if (bpf_probe_read(&b, sizeof(b), (void *)((char *)buf)) < 0) {
        return 0;
    }
// *1\r\n$4\r\nping\r\n
if (b[0] != '*' || b[1] != '1' || b[2] != '\r' || b[3] != '\n' || b[4] != '$' || b[5] != '4' || b[6] != '\r' || b[7] != '\n') {
    return 0;
}
if (b[8] != 'p' || b[9] != 'i' || b[10] != 'n' || b[11] != 'g' || b[12] != '\r' || b[13] != '\n') {
    return 0;
}

return STATUS_SUCCESS;
}
pong:
static __always_inline
int is_redis_pong(char *buf, __u64 buf_size) {
    if (buf_size < 14) {
        return 0;
    }
    char b[14];
    if (bpf_probe_read(&b, sizeof(b), (void *)((char *)buf)) < 0) {
        return 0;
    }

    // *2\r\n$4\r\npong\r\n$0\r\n\r\n
    if (b[0] != '*' || b[1] < '0' || b[1] > '9' || b[2] != '\r' || b[3] != '\n' || b[4] != '$' || b[5] != '4' || b[6] != '\r' || b[7] != '\n') {
        return 0;
    }
    if (b[8] != 'p' || b[9] != 'o' || b[10] != 'n' || b[11] != 'g' || b[12] != '\r' || b[13] != '\n') {
        return 0;
    }

    return STATUS_SUCCESS;
}
"generic”command:
static __always_inline
int is_redis_command(char *buf, __u64 buf_size) {
    if (buf_size < 11) {
        return 0;
    }
    char b[11];
    if (bpf_probe_read(&b, sizeof(b), (void *)((char *)buf)) < 0) {
        return 0;
    }

    // Clients send commands to the Redis server as RESP arrays
    // * is the array prefix
    // latter is the number of elements in the array
    //*3\r\n$7\r\nmessage\r\n$10\r\nmy_channel\r\n$13\r\nHello, World!\r\n
    if (b[0] != '*' || b[1] < '0' || b[1] > '9') {
        return 0;
    }
    // Check if command is not "message", message command is used for pub/sub by server to notify sub.
    // CLRF(\r\n) is the seperator in RESP protocol
    if (b[2] == '\r' && b[3] == '\n') {
        if (b[4]=='$' && b[5] == '7' && b[6] == '\r' && b[7] == '\n' && b[8] == 'm' && b[9] == 'e' && b[10] == 's'){
            return 0;
        }
        return 1;
    }

    // Array length can exceed 9, so check if the second byte is a digit
    if (b[2] >= '0' && b[2] <= '9' && b[3] == '\r' && b[4] == '\n') {
        if (b[5]=='$' && b[6] == '7' && b[7] == '\r' && b[8] == '\n' && b[9] == 'm' && b[10] == 'e'){
            return 0;
        }
        return 1;
    }

    return 0;
}
We utilize a tracepoint at the entry of the read syscall on the server to capture its input parameters, such as the file descriptor and the query payload. This data is then forwarded to a tracepoint at the exit of the read syscall for protocol classification.
Last but not least, tracepoint on the exit of read syscall on the server first checks whether the message is RESP Push Event, using:
static __always_inline
__u32 is_redis_pushed_event(char *buf, __u64 buf_size){
    if (buf_size < 17) {
        return 0;
    }

    char b[17];
    if (bpf_probe_read(&b, sizeof(b), (void *)((char *)buf)) < 0) {
        return 0;
    }

    // In RESP3 protocol, the first byte of the pushed event is '>'
    // whereas in RESP2 protocol, the first byte is '*'
    //*3\r\n$7\r\nmessage\r\n$10\r\nmy_channel\r\n$13\r\nHello, World!\r\n
    if ((b[0] != '>' && b[0] != '*') || b[1] < '0' || b[1] > '9') {
        return 0;
    }

    // CLRF(\r\n) is the seperator in RESP protocol
    if (b[2] == '\r' && b[3] == '\n') {
        if (b[4]=='$' && b[5] == '7' && b[6] == '\r' && b[7] == '\n' && b[8] == 'm' && b[9] == 'e' && b[10] == 's' && b[11] == 's' && b[12] == 'a' && b[13] == 'g' && b[14] == 'e' && b[15] == '\r' && b[16] == '\n') {
            return 1;
        } else {
            return 0;
        }
    }

    return 0;
}
💡 Redis push events provide out-of-band data, functioning as an exception to the typical request-response model of the RESP. They enable a generic push mode for connections, delivering information without requiring a corresponding client request.
And if that’s not the case we try to parse the data types from the payload using:
static __always_inline
__u32 parse_redis_response(char *buf, __u64 buf_size) {
    char type;
    if (bpf_probe_read(&type, sizeof(type), (void *)((char *)buf)) < 0) {
        return STATUS_UNKNOWN;
    }

    // must end with \r\n
    char end[2];
    if (bpf_probe_read(&end, sizeof(end), (void *)((char *)buf+buf_size-2)) < 0) {
        return 0;
    }
    if (end[0] != '\r' || end[1] != '\n') {
        return STATUS_UNKNOWN;
    }

    // Accepted since RESP2
    // Check for types: Array | Integer | Bulk String | Simple String
    if (type == '*' || type == ':' || type == '$' || type == '+'
    ) {
        return STATUS_SUCCESS;
    }

    // https://redis.io/docs/latest/develop/reference/protocol-spec/#simple-errors
    // Accepted since RESP2
    // Check for Error
    if (type == '-') {
        return STATUS_ERROR;
    }

    // Accepted since RESP3
    // Check for types: Null | Boolean | Double | Big Numbers | Verbatim String | Maps | Set
    if (type == '_' || type == '#' || type == ',' || type =='(' || type == '=' || type == '%' || type == '~') {
        return STATUS_SUCCESS;
    }

    // Accepted since RESP3
    // Check for Bulk Errors
    if (type == '!') {
        return STATUS_ERROR;
    }

    return STATUS_UNKNOWN;
}
⚠️ Note: For the sake of simplicity, we’ll only focused on describing the code flow for unencrypted traffic, laying some foundation for an upcoming post on observing encrypted traffic.
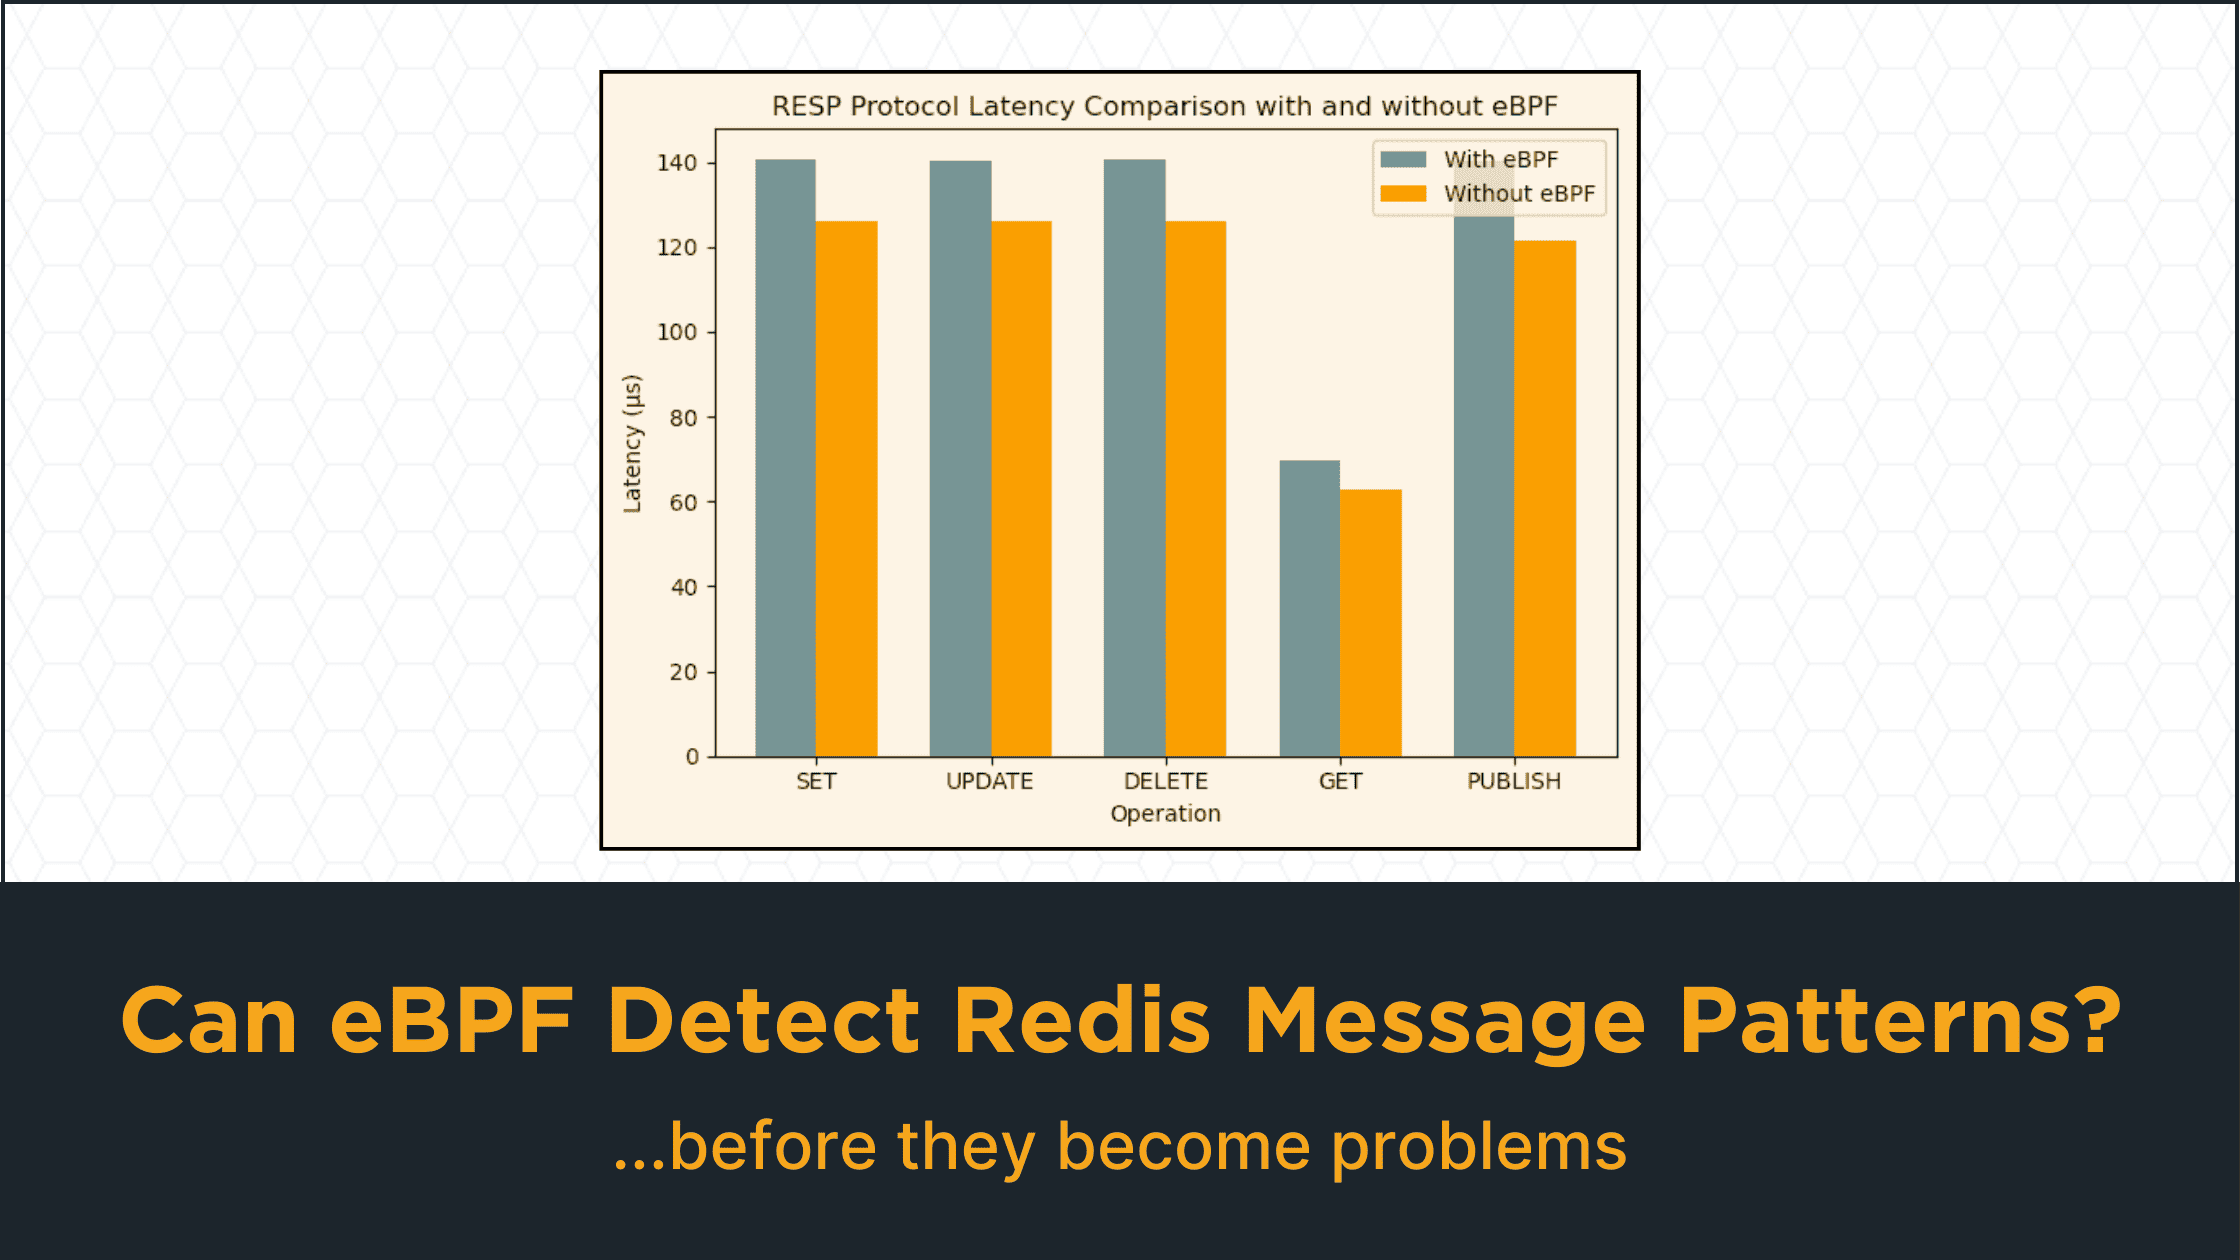
Performance Evaluation
To conclude, we conducted basic performance tests to evaluate the impact of our eBPF programs on the host server, specifically focusing on latency and CPU load when intercepting and parsing RESP protocol traffic. The tests involved measuring the average latency over 10,000 requests.
First, we deployed the Redis container locally using:
docker run --name redis-server -d --memory 4g --cpus 4 -p 6379:6379 redis
To optimize performance and prevent throttling, we assigned 4 CPUs and 4GB of memory to the container. We then evaluated the setup both with and without our eBPF programs monitoring the Redis traffic to observe the impact:
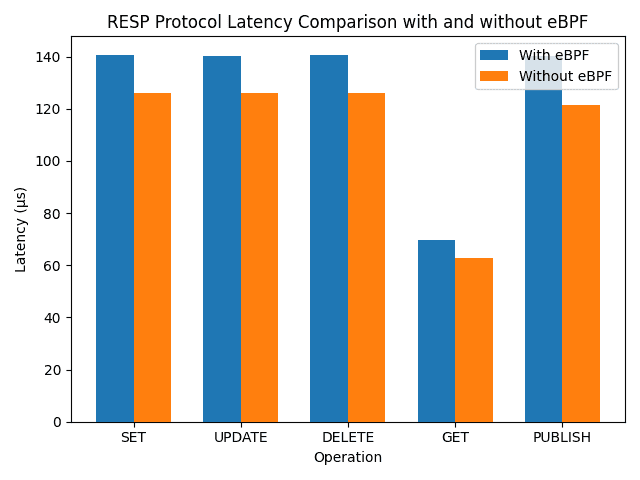
Our results indicate that the eBPF program adds a constant eBPF overhead of approximately 17µs on average. Additionally, the average CPU load introduced by each hook is as follows: 1.89% for tracepoint/syscalls/sys_enter_read, 11.69% for tracepoint/syscalls/sys_exit_read, and 4.26% for tracepoint/syscalls/sys_enter_write.
You can find the load testing programs in the
directory of the repository referenced below./perf
These findings highlight the trade-off between the added latency and CPU load due to eBPF instrumentation and the benefits of detailed protocol observation and analysis.
To be honest, there’s quite a bit of code surrounding the described functionality, primarily focused on extracting the buffer and conducting other protocol-related checks. Presenting Alaz in its entirety might be slightly complex for now. However, to provide you with a tangible example, we’ve prepared a focused demo code that incorporates only the features relevant to Redis. You can access it at the following link.
Conclusion
As database technologies evolve and applications become more complex, tools like Anteon’s eBPF-based Kubernetes monitoring solution are essential for maintaining system health and performance. By leveraging advanced technologies such as eBPF, Anteon positions itself at the forefront of observability solutions, ready to tackle the challenges of modern distributed applications. This ensures Redis deployments are consistently high-performing and reliable, meeting the demands of contemporary distributed applications.