In this blog post, we will focus on monitoring PostgreSQL databases using our Kubernetes PostgreSQL monitoring capabilities. Specifically, we will demonstrate how we track various client queries and help our customers identify potential database bottlenecks.
We will start with a theoretical overview and conclude with a practical code example that you can run yourself.
Monitoring PostgreSQL Databases
Monitoring databases is crucial not only for gaining insights into resource utilization and fault detection but also for optimizing application performance, detecting malicious traffic, managing and planning cost, and preventing downtime. This holds true for all types of databases, including one of the most widely used: PostgreSQL.
PostgreSQL Protocol
PostgreSQL uses a message-based protocol for communication between clients and servers, operating over both TCP/IP and Unix-domain sockets. While the default TCP port registered with IANA is 5432, any non-privileged port can be used. To avoid confusion, we will refer to the frontend as the database client and the backend as the database server.
Among the many message formats in PostgreSQL for executing SQL commands, the two we are primarily concerned with are:
- Simple Query: Executes a single SQL command sent as a single string using the
message type, providing straightforward and direct execution of queries likeQ
.SELECT * FROM users - Extended Query: Uses a multi-step process involving
,Parse
,Bind
, and other message types to support complex interactions, including parameterized queries and prepared statements.Execute
💡 A prepared statement optimizes performance by parsing and analyzing a statement once during preparation. When executed, it uses specific parameter values, reducing repetitive parsing and improving efficiency.
During backend development, these message formats are typically abstracted away by programming language libraries. However, understanding them is essential for our work, as we directly parse them from scratch within the kernel using eBPF.
Anteon and PostgreSQL in Kubernetes
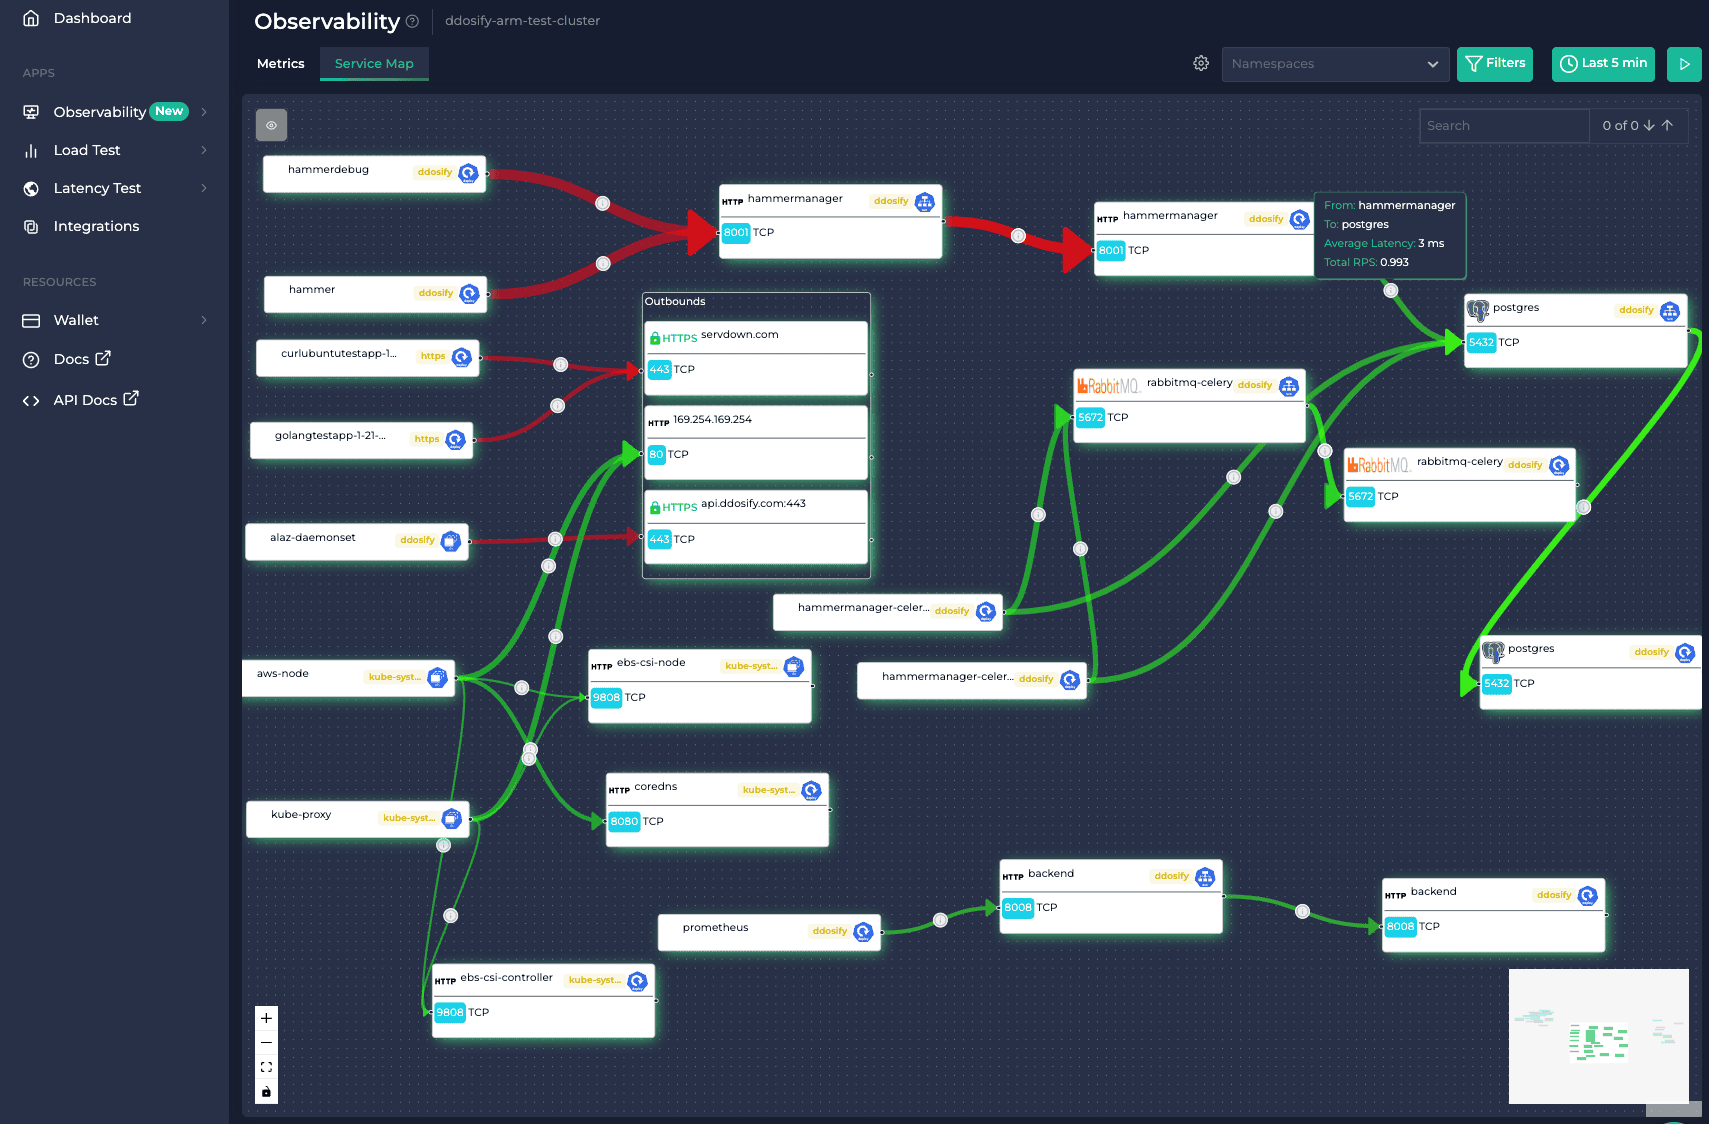
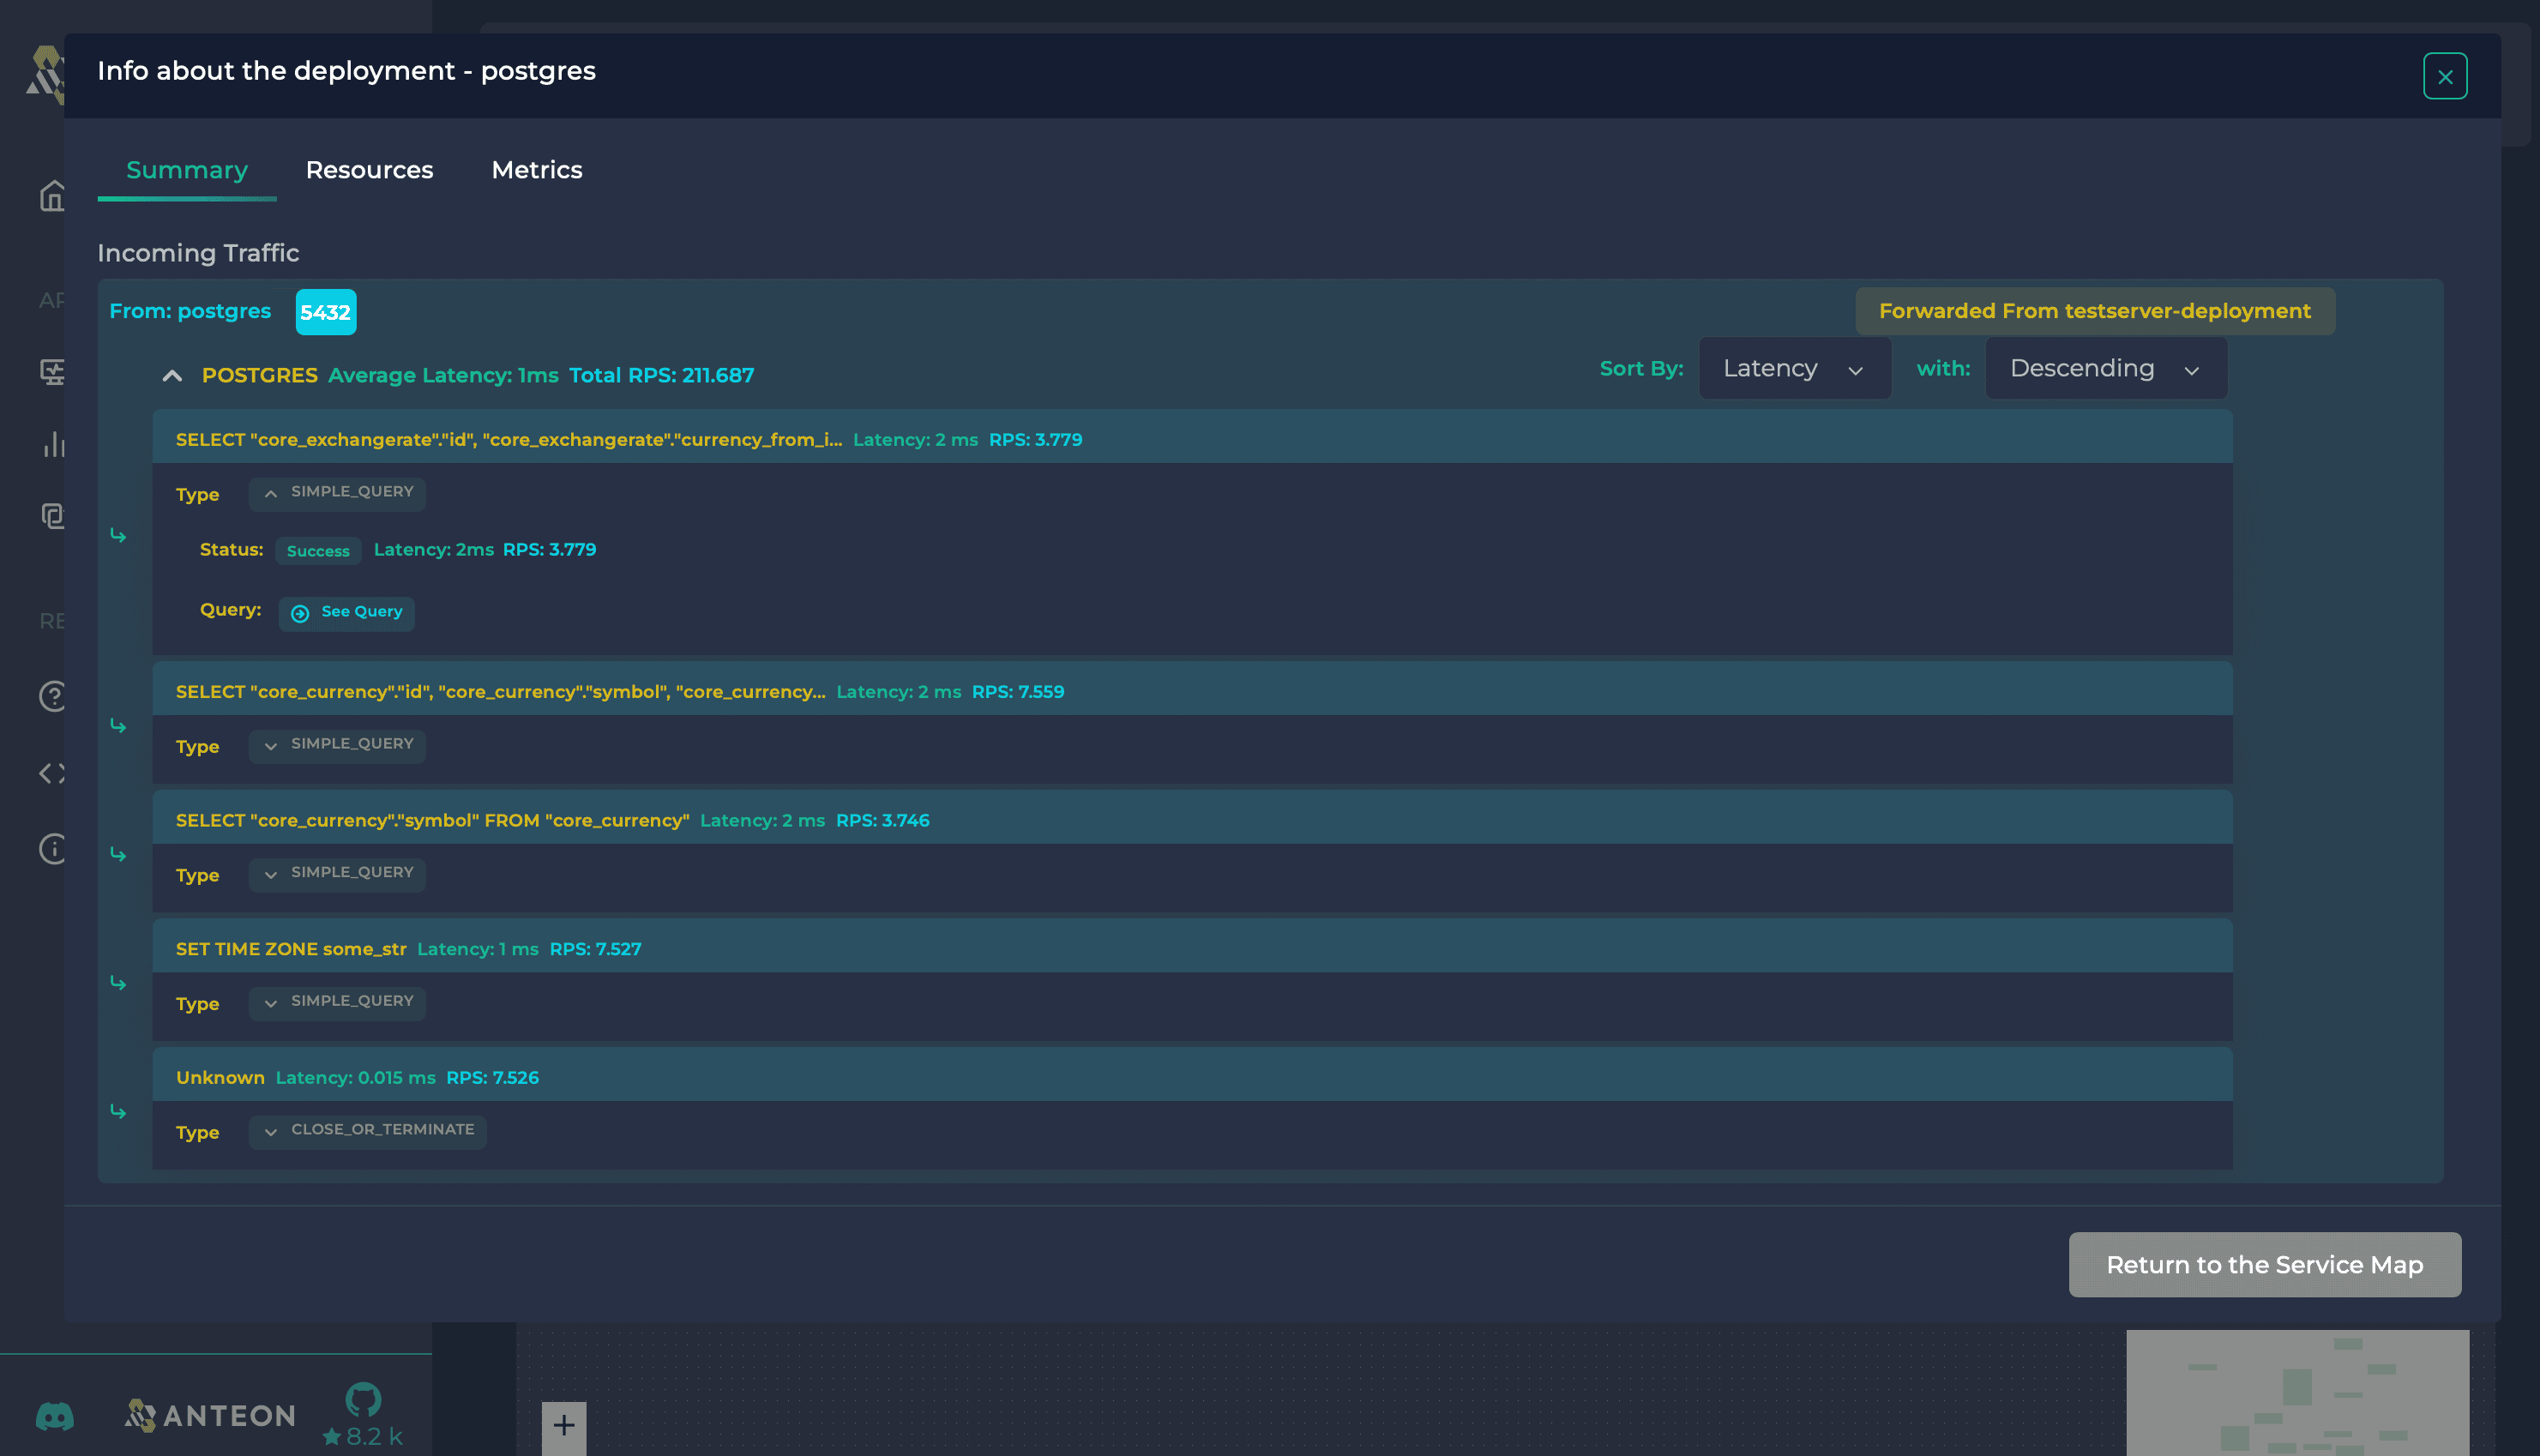
In our web interface, for each PostgreSQL database deployment, you can easily view the client queries, their classification by query type, and the status of each request, as illustrated in the following image.
💡 Anteon platform demo is available on demo.getanteon.com. Give it a look.
If you look carefully at the image, you’ll also notice insights like request latency and RPS. We’ll discuss these parameters in another post, as they are primarily related to the underlying TCP protocol that PostgreSQL builds upon. For now, let’s focus on how we achieve this comprehensive visibility.
PostgreSQL Observability using Alaz eBPF Agent
Behind the scenes, our platform utilizes an eBPF agent named Alaz, which runs as a DaemonSet on your Kubernetes cluster. The agent’s primary task is to load and attach eBPF programs on each Kubernetes node, and then it listens for kernel events transferred to the user space via eBPF maps. While we’d love to delve into eBPF here in detail, it deserves its own dedicated post, if not an entire series. If you’re not familiar with it yet, there are numerous online resources available that can provide you with a quick introduction.
The following code snippets reference specific parts of our Agent. The complete source code is available in our GitHub repository.
eBPF Hook Points
In the context of eBPF programs, the in-kernel attachment points are commonly referred to as Hooks or Hook points. Each hook point varies primarily in terms of which in-kernel data types and variables it can access. For the case of PostgreSQL, after socket creation and connection establishment between the client and server, the kernel will call the write function of the socket’s protocol handler to send data to the server. The kernel will call the read function of the socket’s protocol handler to receive data from the remote peer. Therefore, the objective is to attach to these syscall hook points:
: Triggered ontracepoint/syscalls/sys_enter_writewritesyscall and used to capture sent data. Provides access to the input arguments of thewritesyscall.
: Triggered on the enter oftracepoint/syscalls/sys_enter_readreadsyscall and used to capture received data. Provides access to the input arguments of thereadsyscall.
: Triggered on the exit oftracepoint/syscalls/sys_exit_readreadsyscall. Provides access to the return values of thereadsyscall.
These hook points provide us access to connection file descriptor, socket address, and PostgreSQL queries, including their type, parameters.
PostgreSQL (L7) Protocol Parsing
PostgreSQL protocol is a L7 protocol, meaning our programs should be able to fetch and parse its application data from inside the kernel. Similar concepts apply for HTTP, HTTP/2, AMQP, RESP and other protocols.
⚠️ Note: For the sake of simplicity, we’ll only focus on describing the code flow for unencrypted traffic, laying some foundation for an upcoming post on observing encrypted traffic.
During the write syscall our tracepoint program parses the send data (buf variable) and check whether the it matches any of the PostgreSQL message format using the following function:
static __always_inline
int parse_client_postgres_data(char *buf, int buf_size, __u8 *request_type) {
    // Return immeadiately if buffer is empty
    if (buf_size < 1) {
        return 0;
    }

    // Read the first byte from the buffer
    // This should be the identifier of the PostgresQL message
    char identifier;
    if (bpf_probe_read(&identifier, sizeof(identifier), (void *)((char *)buf)) < 0) {
        return 0;
    }

    // The next four bytes of the buffer should specify the length of the message
    __u32 len;
    if (bpf_probe_read(&len, sizeof(len), (void *)((char *)buf + 1)) < 0) {
        return 0;
    }

    // Check if the identifier represents connection termination ("X") and
    // the length is 4 bytes (as per protocol docs)
    if (identifier == POSTGRES_MESSAGE_TERMINATE && bpf_htonl(len) == 4) {
        bpf_printk("Client will send Terminate message\n");
        *request_type = identifier;
        return 1;
    }

    // Check if the identifier represents Simple Query Protocol ("Q")
    if (identifier == POSTGRES_MESSAGE_SIMPLE_QUERY) {
        *request_type = identifier;
        bpf_printk("Client will send a Simple Query message\n");
        return 1;
    }

    // Check if the identifier represents and Extended Query Protocol, which is either:
    // - P/D/S (Parse/Describe/Sync) creating a prepared statement
    // - B/E/S (Bind/Execute/Sync) executing a prepared statement
    if (identifier == POSTGRES_MESSAGE_PARSE || identifier == POSTGRES_MESSAGE_BIND) {
        // Read last 5 bytes of the buffer (Sync message)
        char sync[5];
        if (bpf_probe_read(&sync, sizeof(sync), (void *)((char *)buf + (buf_size - 5))) < 0) {
            return 0;
        }

        // Extended query protocol messages end with a Sync ("S") message.
        // Sync message is a 5 byte message with the first byte being "S" and
        // the rest indicating the length of the message, including self (4 bytes in this case - so no message body)
        if (sync[0] == 'S' && sync[1] == 0 && sync[2] == 0 && sync[3] == 0 && sync[4] == 4) {
            bpf_printk("Client will send an Extended Query\n");
            *request_type = identifier;
            return 1;
        }
    }

    return 0;
}
We utilize a tracepoint at the entry of the read syscall on the server to capture its input parameters, such as the file descriptor and the query payload. This data is then forwarded to a tracepoint at the exit of the read syscall for protocol classification.
Last but not least, tracepoint on the exit of read syscall on the server then performs message identifier checks, specifically examining the first byte of the message using:
static __always_inline
__u32 parse_postgres_server_resp(char *buf, int buf_size) {
    // Return immeadiately if buffer is empty
    if (buf_size < 1) {
        return 0;
    }

    // Read the first byte from the buffer
    // This should be the identifier of the PostgresQL message
    char identifier;
    if (bpf_probe_read(&identifier, sizeof(identifier), (void *)((char *)buf)) < 0) {
        return 0;
    }

    // Checks if the message identifies an error.
    if (identifier == 'E') {
        return ERROR_RESPONSE;
    }

    // Identify SQL commands (tag field, e.g. SELECT, INSERT, UPDATE, DELETE, CREATE, DROP, etc.)
    if (identifier == 't' || identifier == 'T' || identifier == 'D' || identifier == 'C') {
        return COMMAND_COMPLETE;
    }

    return 0;
}
Once we classify the message format, we send its data through the perf buffer to the user-space application, which then renders it on our web interface.
💡 Perf buffer (Perfbuf) is a collection of per-CPU circular buffers that allow efficient data exchange between the kernel and user space.
Performance Evaluation
To conclude, we conducted basic performance tests to evaluate the impact of our eBPF programs on the host server, specifically focusing on latency and CPU load when intercepting and parsing PostgreSQL protocol traffic. The tests involved measuring the average latency over 10,000 requests.
First, we deployed the PostgreSQL container locally using:
docker run --name my-postgres-container -e POSTGRES_PASSWORD=mysecretpassword -d -p 5432:5432 --memory=4g --cpus=4 -v ./postgresql.conf:/etc/postgresql/postgresql.conf -e POSTGRES_CONFIG_FILE=/etc/postgresql/postgresql.conf postgres
To optimize performance and prevent throttling, we assigned 4 CPUs and 4GB of memory to the container. Additionally, we configured it with some commonly recommended memory settings:
# PostgreSQL configuration file - postgresql.conf

# Memory settings
shared_buffers = 1GB              # recommended: 25% of total memory
effective_cache_size = 3GB        # recommended: 75% of total memory
work_mem = 64MB                   # recommended: 2-4MB per CPU core
maintenance_work_mem = 512MB      # recommended: 10% of total memory
And then evaluated the setup both with and without our eBPF programs monitoring the PostgreSQL traffic to observe the impact:
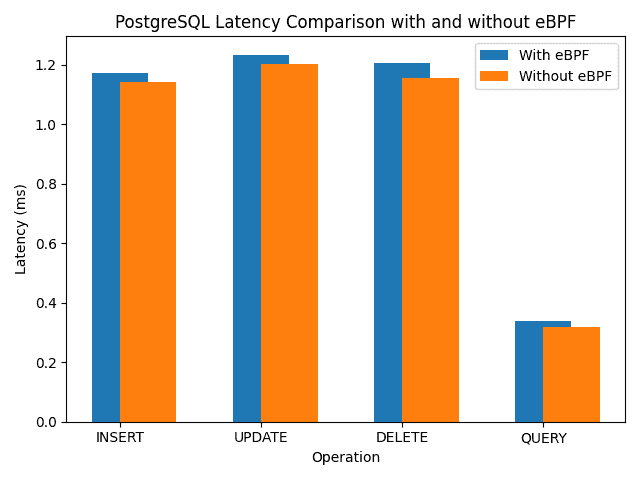
Our results indicate that the eBPF program adds a constant eBPF overhead of approximately 0.03 ms (on average). Additionally, the average CPU load introduced by each hook is as follows: 0.4% for tracepoint/syscalls/sys_enter_read, 1.41% for tracepoint/syscalls/sys_exit_read, and 0.8% for tracepoint/syscalls/sys_enter_write.
You can find the load testing programs in the
/perfdirectory of the repository referenced below.
These findings address the trade-off between the added latency and CPU load due to eBPF instrumentation and the benefits of detailed protocol observation and analysis.
To be honest, there’s quite a bit of code surrounding the described functionality, primarily focused on extracting the buffer and conducting other protocol-related checks. Presenting Alaz in its entirety might be slightly complex for now. However, to provide you with a tangible example, we’ve prepared a focused demo code that incorporates only the features relevant to PostgreSQL. You can access it at the following link.
Conclusion: Monitoring PostgreSQL Database on Kubernetes using eBPF
In conclusion, our eBPF-based monitoring solution, integrated into the Anteon platform, provides comprehensive observability for PostgreSQL databases deployed on Kubernetes. By leveraging eBPF, we efficiently capture and analyze client queries and protocol message formats without requiring any modifications to the application code. This capability is crucial for identifying performance bottlenecks, ensuring optimal resource utilization, and enhancing overall application security. Stay tuned for upcoming articles where we will delve deeper into monitoring encrypted traffic and explore additional features of our platform.

