Introduction
In this article, we'll focus on monitoring the Amazon EKS Kubernetes cluster's performance. To do this, we will measure various values such as latency, and RPS in the Kubernetes cluster. We'll also detect the bottlenecks and zombie services to improve cluster performance. Thus, we'll also identify potential problems in the cluster before they become critical and adjust our strategy and resources accordingly.
To make it more realistic we will run a dummy load for our cluster using a load-testing tool. In this way, we will test our microservice application for special days (Valentine’s Day, Black Friday, etc.) when online traffic increases tremendously. We will ensure the performance of our microservices app in the cluster by taking the necessary precautions according to the test results.
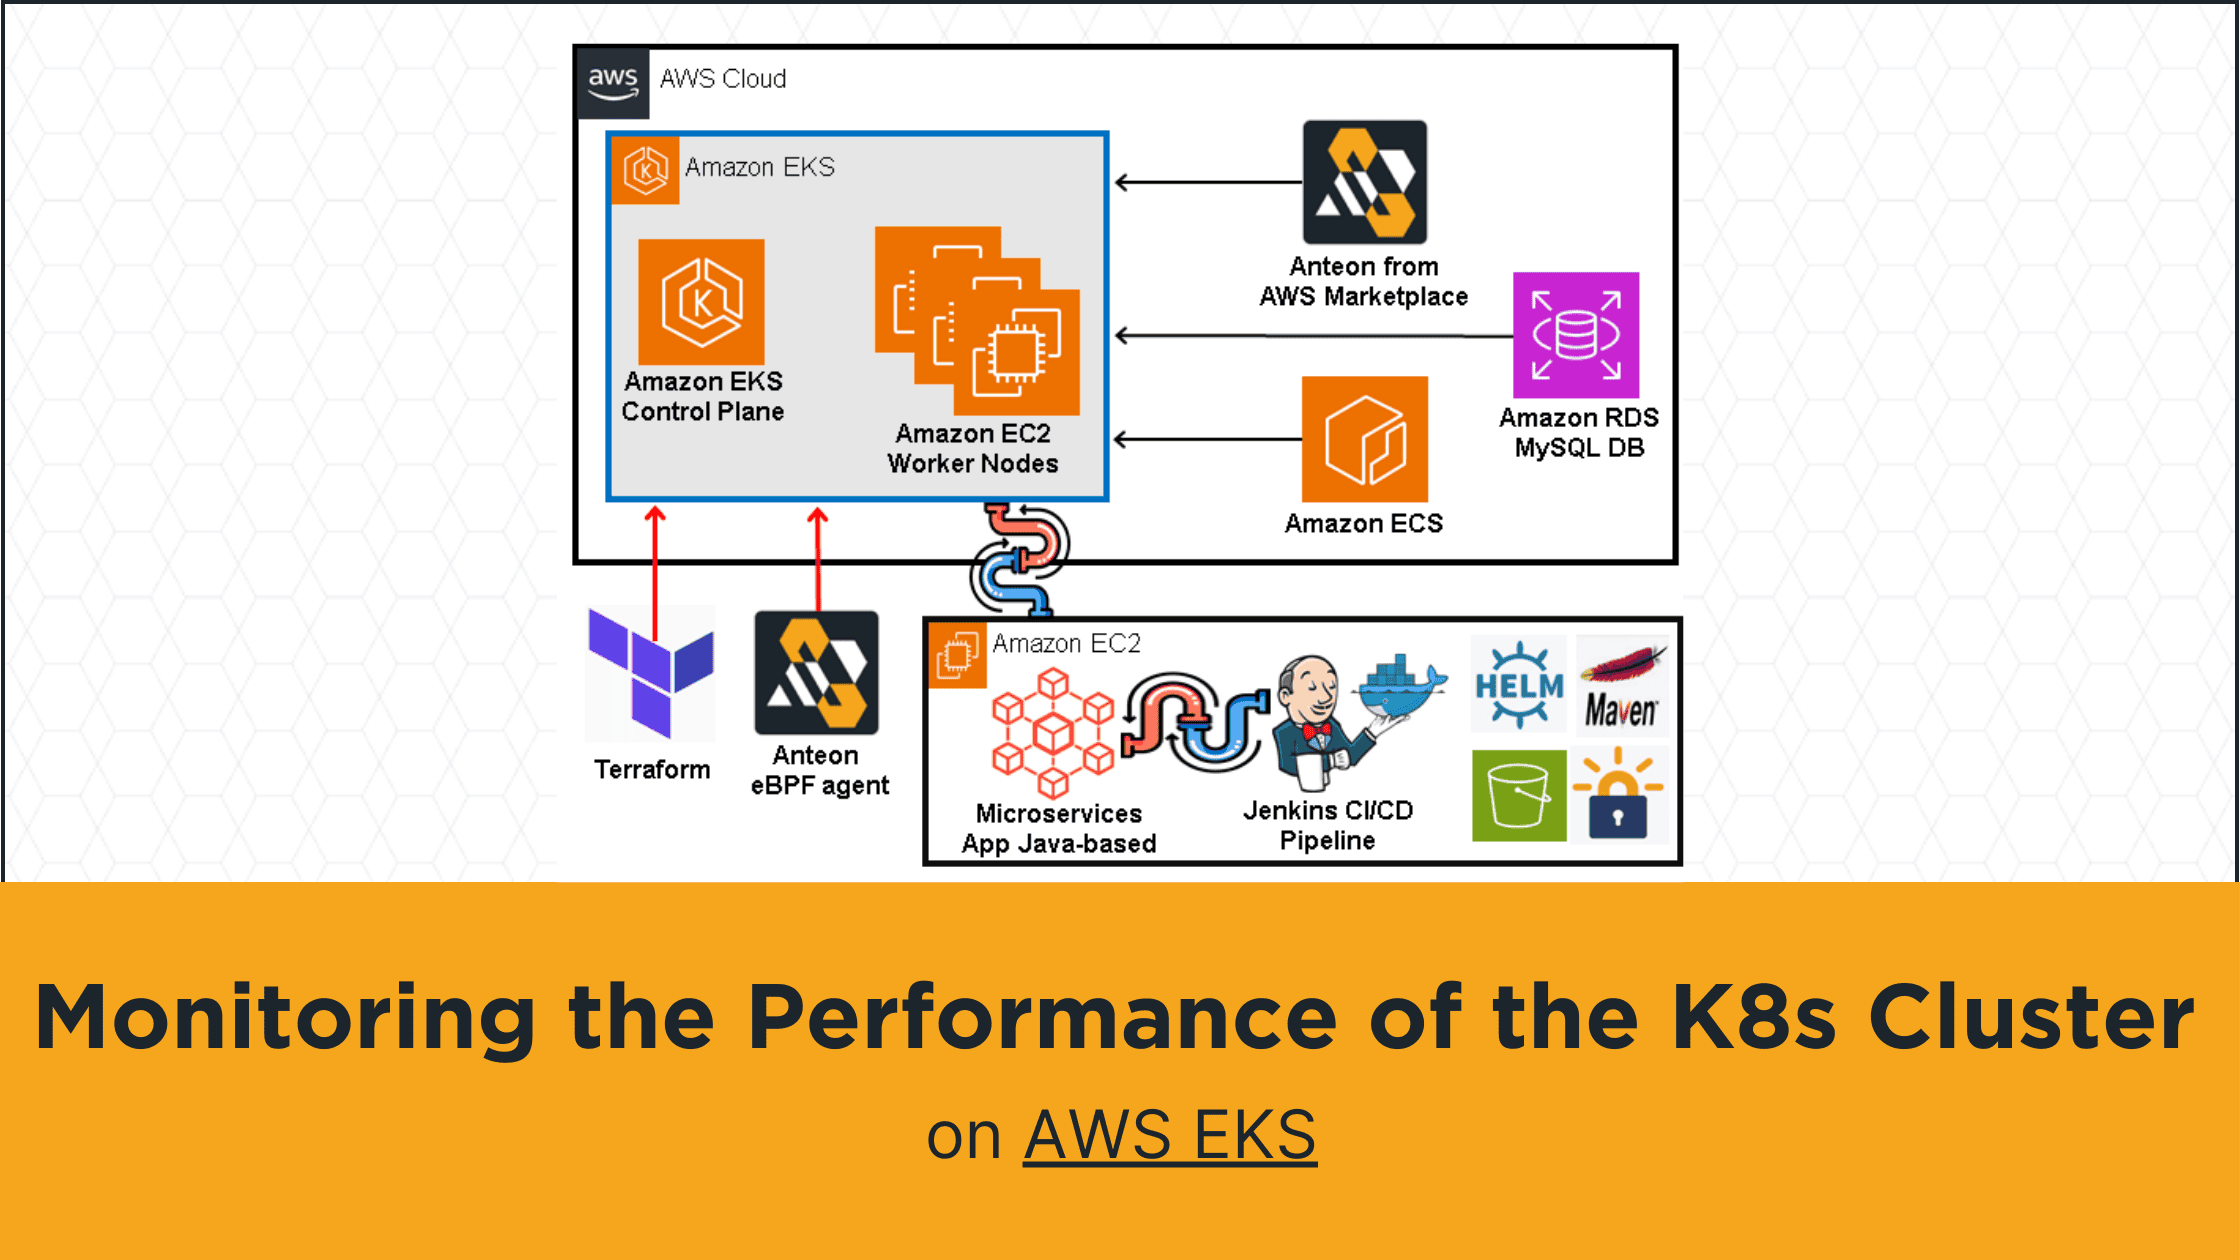
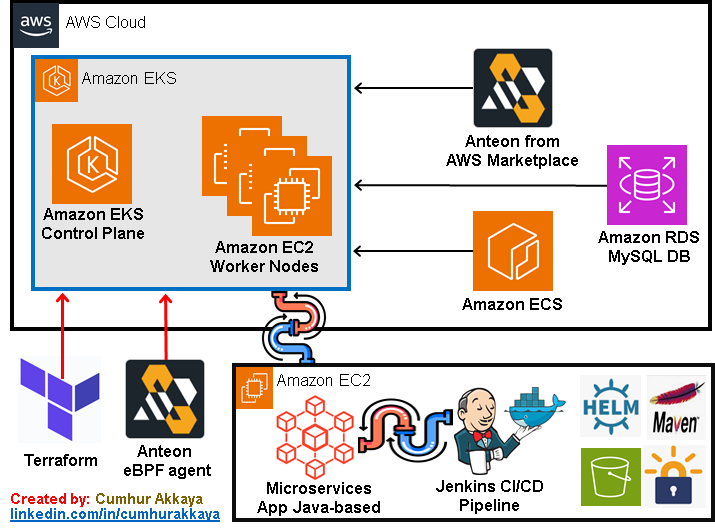
To test what we have explained in the real business world, first, we'll create an environment. We'll use Terraform to create an Amazon EKS Kubernetes cluster on a custom Amazon VPC. Then, we'll deploy and run a microservices application with MySQL Database into this Amazon EKS using a Jenkins CI/CD pipeline.
Then, we'll deploy Anteon by using AWS Marketplace for easy deployment on the AWS Cloud. We'll integrate the Kubernetes cluster into Anteon. Finally, we'll monitor the Amazon EKS Kubernetes cluster's performance using Anteon. We will look for answers to the following questions by using the Anteon Service Map:
* What is the average latency between service X and service Y?
* Which services have higher/lower latency than XX ms?
* What is the average RPS between service X and service Y?
* Is there a Zombie Service on your cluster?
* How to find a bottleneck in a cluster?
* How much time does it take to run SQL queries?
We will do these practically step by step in this article.
While Kubernetes has many advantages, it also comes with many maintainability and reliability issues. We navigate most of the time turbulent waters of managing Kubernetes clusters.
Setting up and maintaining Kubernetes can be complex, especially for small teams or organizations with limited resources.
To get the best efficiency from Kubernetes, we can focus on defining resource requests and limits, using optimized and lightweight container images, using smart scaling policies, implementing Cluster Autoscaling (CA) and Horizontal Pod Autoscaling (HPA), adopting GitOps for configuration management, monitoring/logging Kubernetes performance to improve applications, and configuring alerts to notify us of critical issues before causing problems, etc.
However, one of them is more important than the others: Monitoring and Logging. We can ensure that the Kubernetes system is running stably by monitoring and evaluating the cluster. Because, when we identify potential problems before they become critical, we can adjust our strategy or resources accordingly. Also, logging is important to solve and identify problems.
Accurate monitoring of cluster utilization, application errors, and real-time performance data is essential while you scale your apps in Kubernetes. Spiking memory consumption, Pod evictions, and container crashes are all problems you should know about, but standard Kubernetes doesn’t come with any observability features to alert you when problems occur. Monitoring tools collect metrics from Kubernetes and notify you of important events. Kubernetes without good observability can create a false sense of security. You won’t know what’s running or be able to detect emerging faults. Failures will be harder to resolve without easy access to the previous logs(1).
Also, another important issue in the Kubernetes cluster is "managing and maintaining". It is not required to manage the underlying infrastructure of Kubernetes yourself unless there is an extreme limitation. In this article, we used Amazon EKS as a managed service that eliminates the need to install, operate, and maintain our own Kubernetes control plane on AWS. Thus, EKS has made using and managing Kubernetes easy for us. You no longer need to worry about installing, operating, and maintaining your own Kubernetes control plane by using Kubernetes in the cloud.
Also, in this article, we focus on monitoring. Continuous monitoring is necessary to guarantee optimal performance and reliability in the Kubernetes cluster. We’ll use Anteon for this purpose in this article, and we see the importance of monitoring the cluster to detect problems and bottlenecks before they happen.
The tools we will use in this article
We will use the below tools in this article:
Amazon EKS (Amazon Elastic Kubernetes Service) is an AWS-managed Kubernetes service to run Kubernetes on AWS without needing to install, operate, and maintain. We’ll deploy and run a microservices application with MySQL Database into this Amazon EKS Kubernetes cluster.
Terraform is an infrastructure-as-code software tool. We’ll use it to create an Amazon EKS cluster on a Custom Amazon VPC.
Anteon is an open-source Kubernetes Monitoring and Performance Testing platform. We’ll monitor the Amazon EKS Kubernetes cluster’s performance with Anteon. In this article, we’ll install and run it from AWS Marketplace.
Amazon ECR (Amazon Elastic Container Registry) is an AWS-managed Docker container image registry service. We’ll create an Amazon ECR Private Repository to store the artifacts of the microservices application.
Amazon RDS (Amazon Relational Database Service) is a fully managed, cloud relational database service. We’ll use it to store the customer records.
GitHub is a developer platform that allows developers to create, store, manage, and share their code. We’ll use it as a source code repository.
Jenkins is a Continuous Integration/Continuous Delivery and Deployment (CI/CD) automation software. We’ll use it to automate the deployment of the microservices application.
Docker is a containerization platform (to build, run, test, and deploy distributed applications quickly in containers). We’ll use it to create docker images from the artifact (.jar files) of the microservices application.
Prerequisites
- Amazon AWS Account: An Amazon AWS Account is required to create resources in the AWS cloud. If you don’t have one, you can register here.
- AWS Access Key: An access key grants programmatic access to your AWS resources. Use this link to create an AWS Access Key if you don’t have one yet.
- An Amazon EC2 key pair: If you don’t have one, refer to creating a key pair.
- Docker: It is a containerization platform (to build, run, test, and deploy distributed applications quickly in containers. If you don’t have it, you can install it from here.
- GitHub Account: It is a developer platform that allows developers to create, store, manage, and share their code. If you don’t have it, you can create an account on GitHub from here.
- Terraform: We will use it as an “Infrastructure as code” to create an Amazon EKS Kubernetes cluster on the AWS cloud. If you don’t have it, you can install it from here.
- Jenkins: It is a Continuous Integration/Continuous Delivery and Deployment (CI/CD) automation software. If you don’t have it, you can install it from here.
Now it’s time to get some hands-on experience. We will do what we explained above practically step by step in the following items. Let’s start.
1. Creating an Amazon EKS Cluster on a Custom Amazon VPC Using Terraform
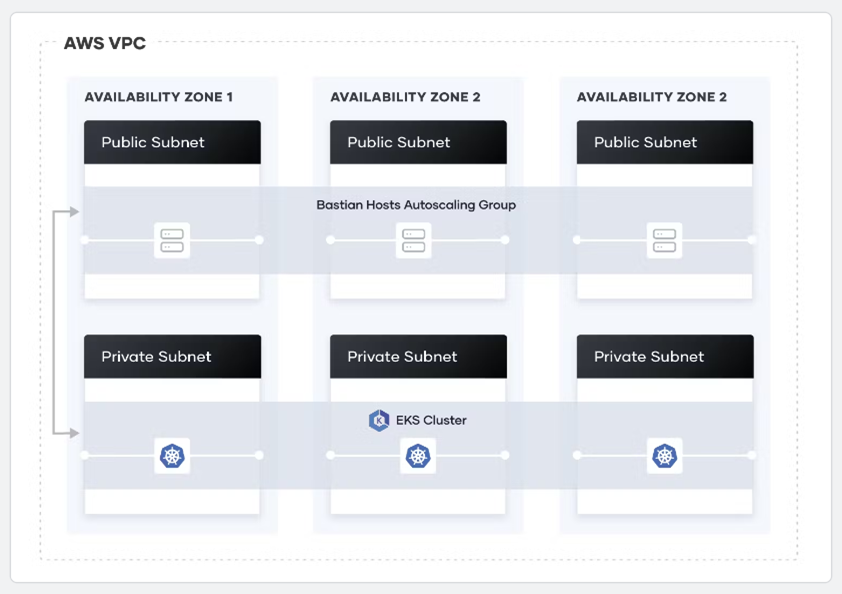
We’ll use Terraform to create an Amazon EKS Kubernetes cluster on a custom Amazon VPC. The Terraform files that we will use (main.tf, terraform.tf, variables.tf, outputs.tf) contain configuration to provision a custom VPC, security groups, and an EKS cluster with the following architecture(2):
Clone the repo and go to the deployment directory with the following commands.
git clone https://github.com/cmakkaya/terraform-eks-for-aws-marketplace-article.git
cd terraform-eks-for-aws-marketplace-article/
Authentication For The AWS Cloud
Note: Before running Terraform, you must run aws configure to enter AWS keys on your computer/instances, as shown in the picture below.
aws configure
Warning: To avoid security risks, don't use IAM users for authentication when developing purpose-built software or working with real data. Instead, use federation with an identity provider such as AWS IAM Identity Center(12).
Configuring and Running The Terraform Files
On the main.tf file, you can change the following values as you want:
name = "node-group-1"
min_size     = 1
max_size     = 3
desired_size = 2

name = "node-group-2"
min_size     = 1
max_size     = 2
desired_size = 1

cluster_name = "cumhur-microservice"  # For Cluster

name = "cumhur-microsevices-app-vpc"  # For VPC
On the variable.tf file, you can change the following values as you want:
default = "us-east-1"
After the settings are finished, initialize the working directory with the following command, as shown in the picture below.
terraform init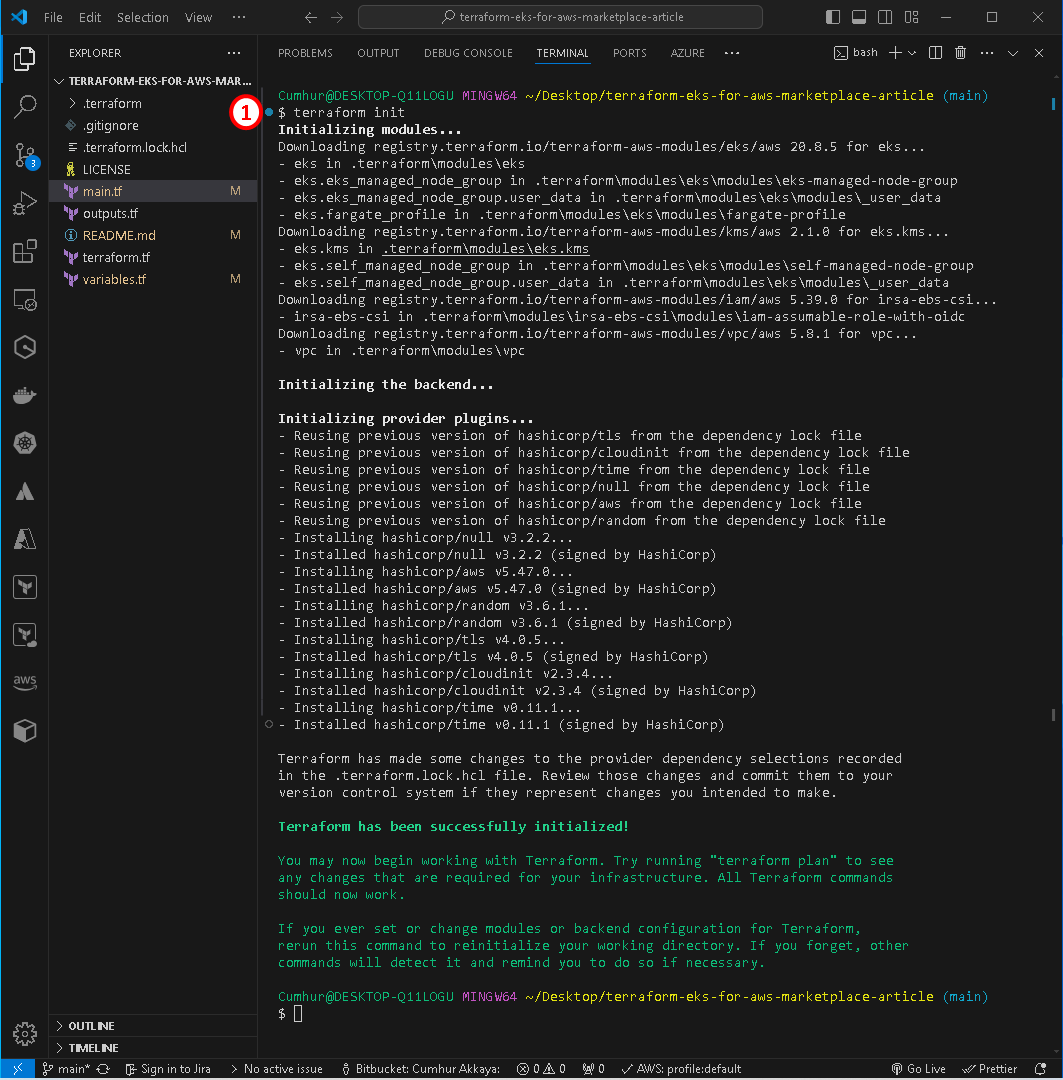
If you want to run the below command to create an execution plan and review it.
terraform plan
Run the following command to create an Amazon EKS cluster and other necessary resources. We can check that the installation has been completed successfully, as shown in the figures below.
This process can take up to 10–15 minutes. Upon completion, Terraform will print your configuration’s outputs.
terraform apply --auto-approve
Run the below command to configure the kubectl, as shown in the figures below.
aws eks --region $(terraform output -raw region) update-kubeconfig --name $(terraform output -raw cluster_name)

Run the below command to test your connection to the EKS cluster and verify that all three worker nodes are part of the cluster, as shown in the figures below.
kubectl get nodes

The cluster is ready to use.
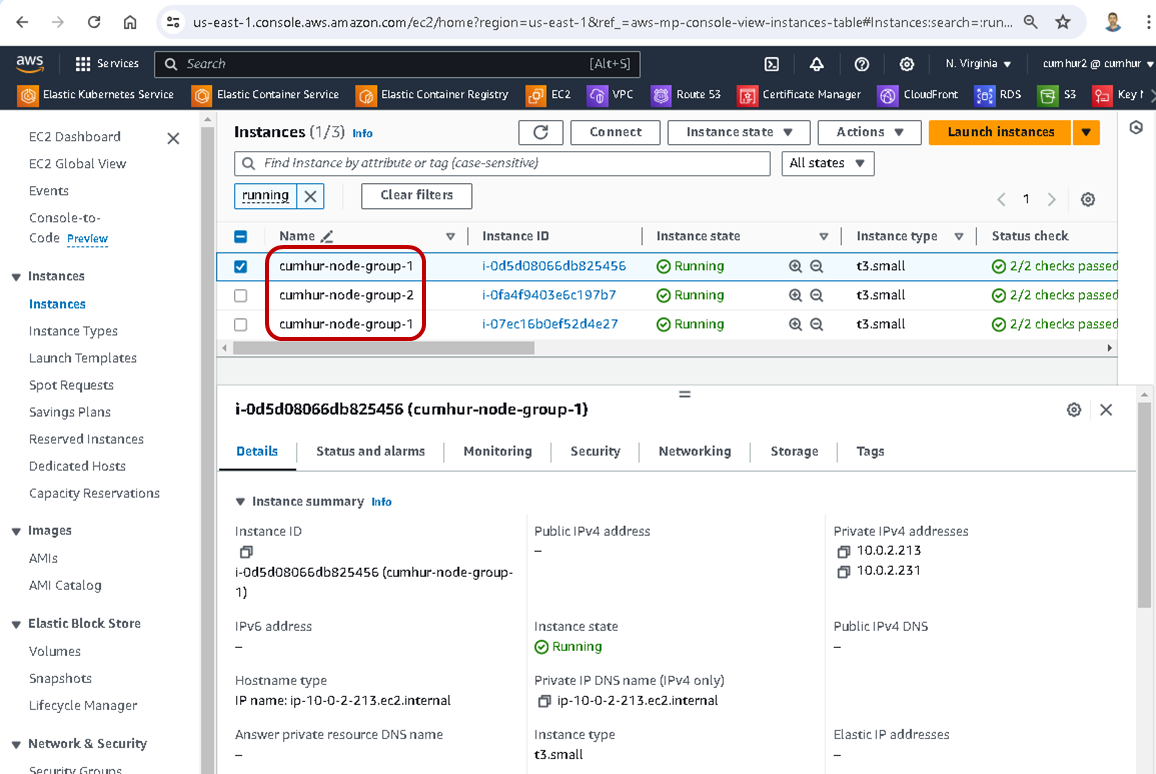
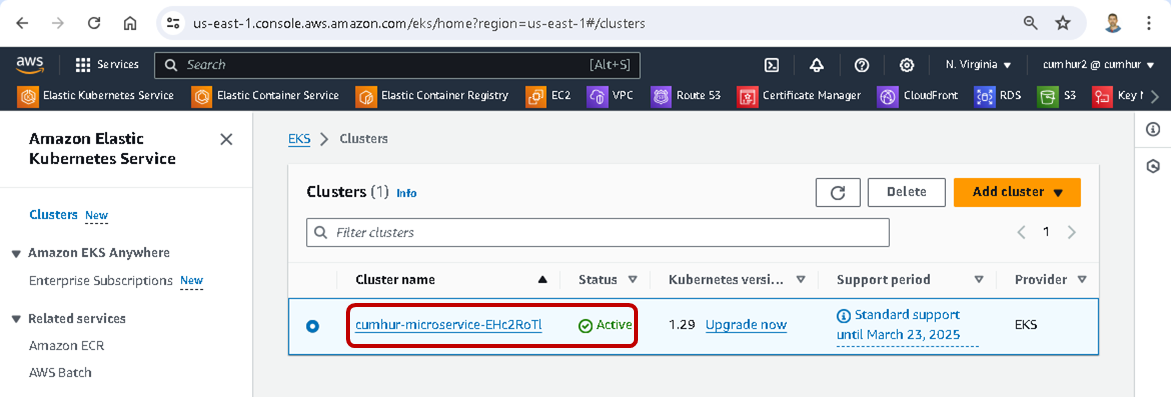
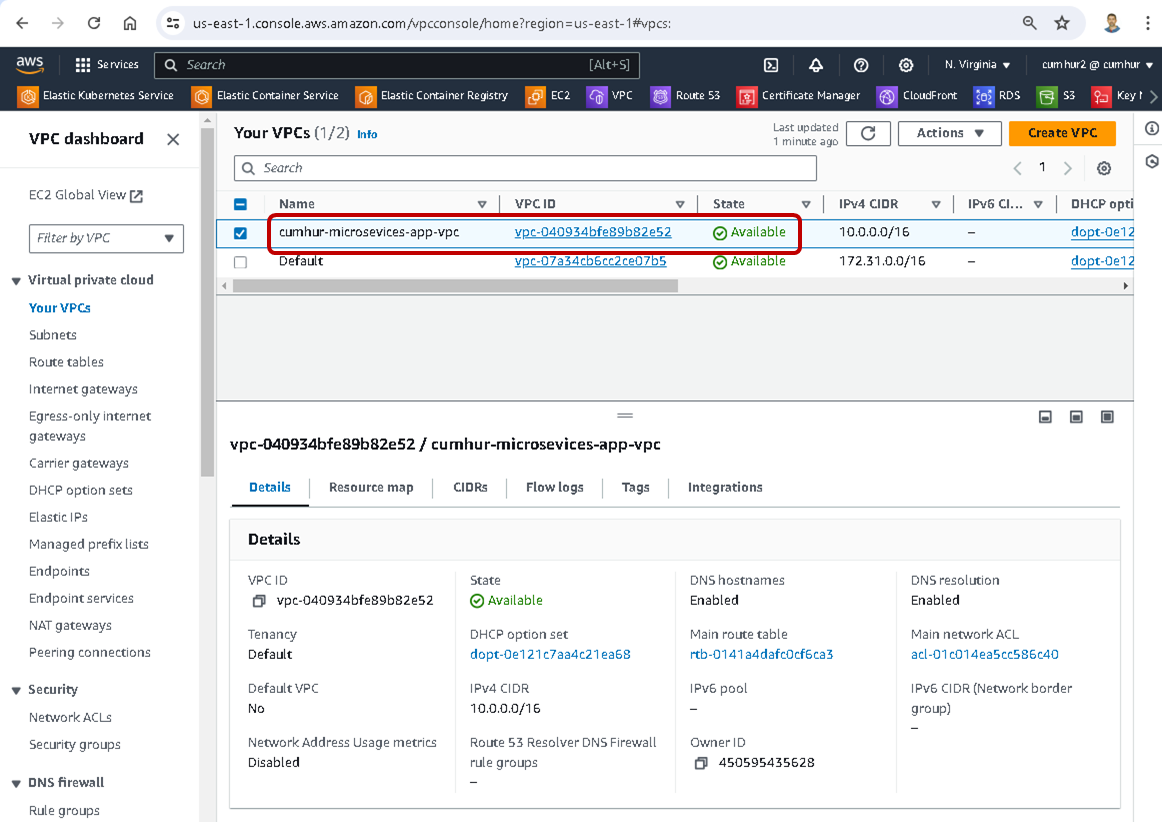
We can also check that the installation has been completed successfully in the AWS Console, as shown in the figures below.
Created nodes;
Created Amazon EKS Cluster;
Created custom Amazon VPC for Amazon EKS;
2. Installing Anteon from AWS Marketplace
AWS Marketplace is an organized digital catalog that customers can use to find, buy, deploy, and manage third-party software, data, and services to build solutions and run their businesses. You can quickly launch preconfigured software, and choose software solutions in Amazon Machine Images (AMIs), software as a service (SaaS), and other formats(3).
We’ll deploy Anteon by using AWS Marketplace for easy deployment on AWS. AWS Marketplace prepares the necessary infrastructure and deploys software on the AWS cloud for us.
We will not need to launch an EC2 with the required configuration and deploy Anteon to this EC2 using Docker Compose or Helm Charts. Also, we will not have to deal with any necessary updates to the infrastructure or software. All these operations will be done automatically by AWS Marketplace.
On AWS Marketplace, one way of delivering the products to buyers is with Amazon Machine Images (AMIs). An AMI provides the information required to launch an Amazon Elastic Compute Cloud (Amazon EC2) instance. Sellers create a custom AMI for their product, and buyers can use it to create EC2 instances with your product already installed and ready to use(4). Today, we will launch an Amazon EC2 from Anteon’s “64-bit (x86) Amazon Machine Image (AMI)” and run Anteon on this Amazon EC2.
2.1. Pricing Anteon on AWS Marketplace
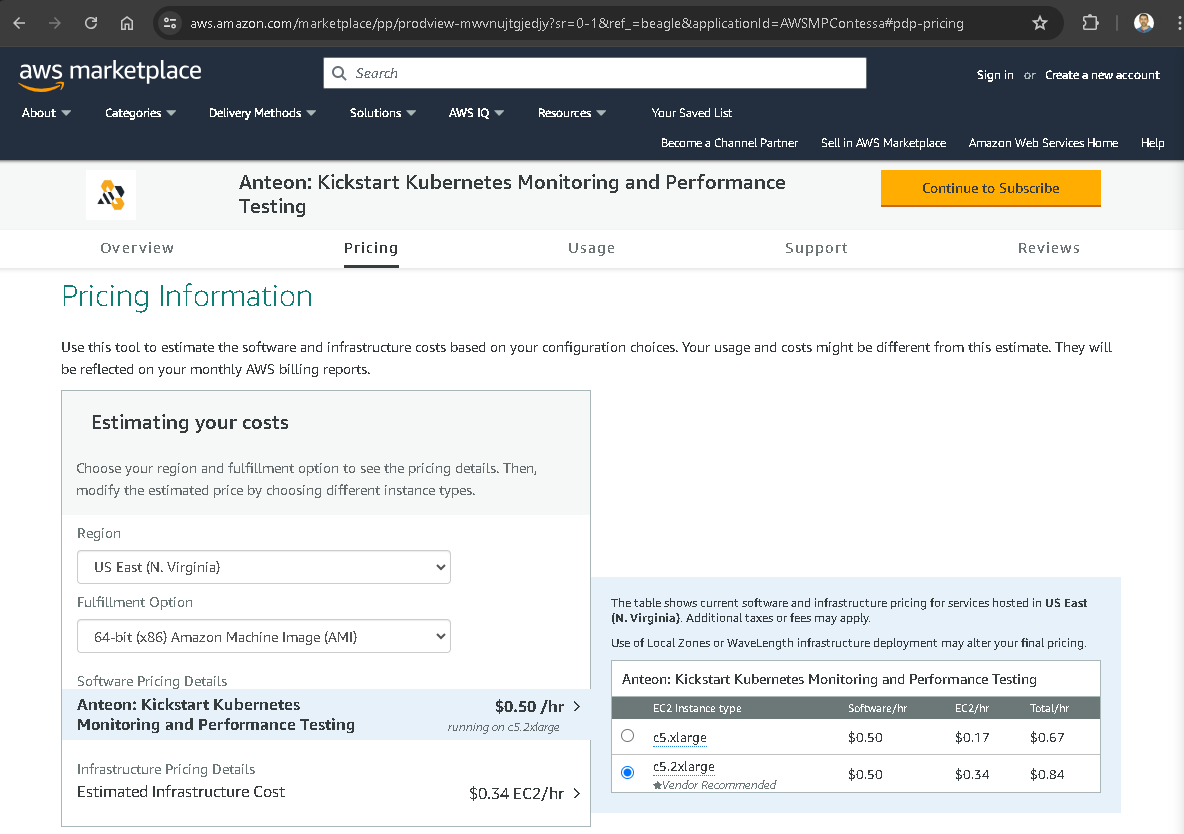
When you navigate to the AWS Marketplace website, you can see the details of Anteon’s hourly usage price in the Pricing tab. The table shows the estimated current software and infrastructure cost for Anteon. For example, Total/hr is $0.84 for EC2 Instance type: c5.2xlarge and Region: US East (N. Virginia), as shown in the picture below(5).
2.2. Subscribing to Anteon on AWS Marketplace
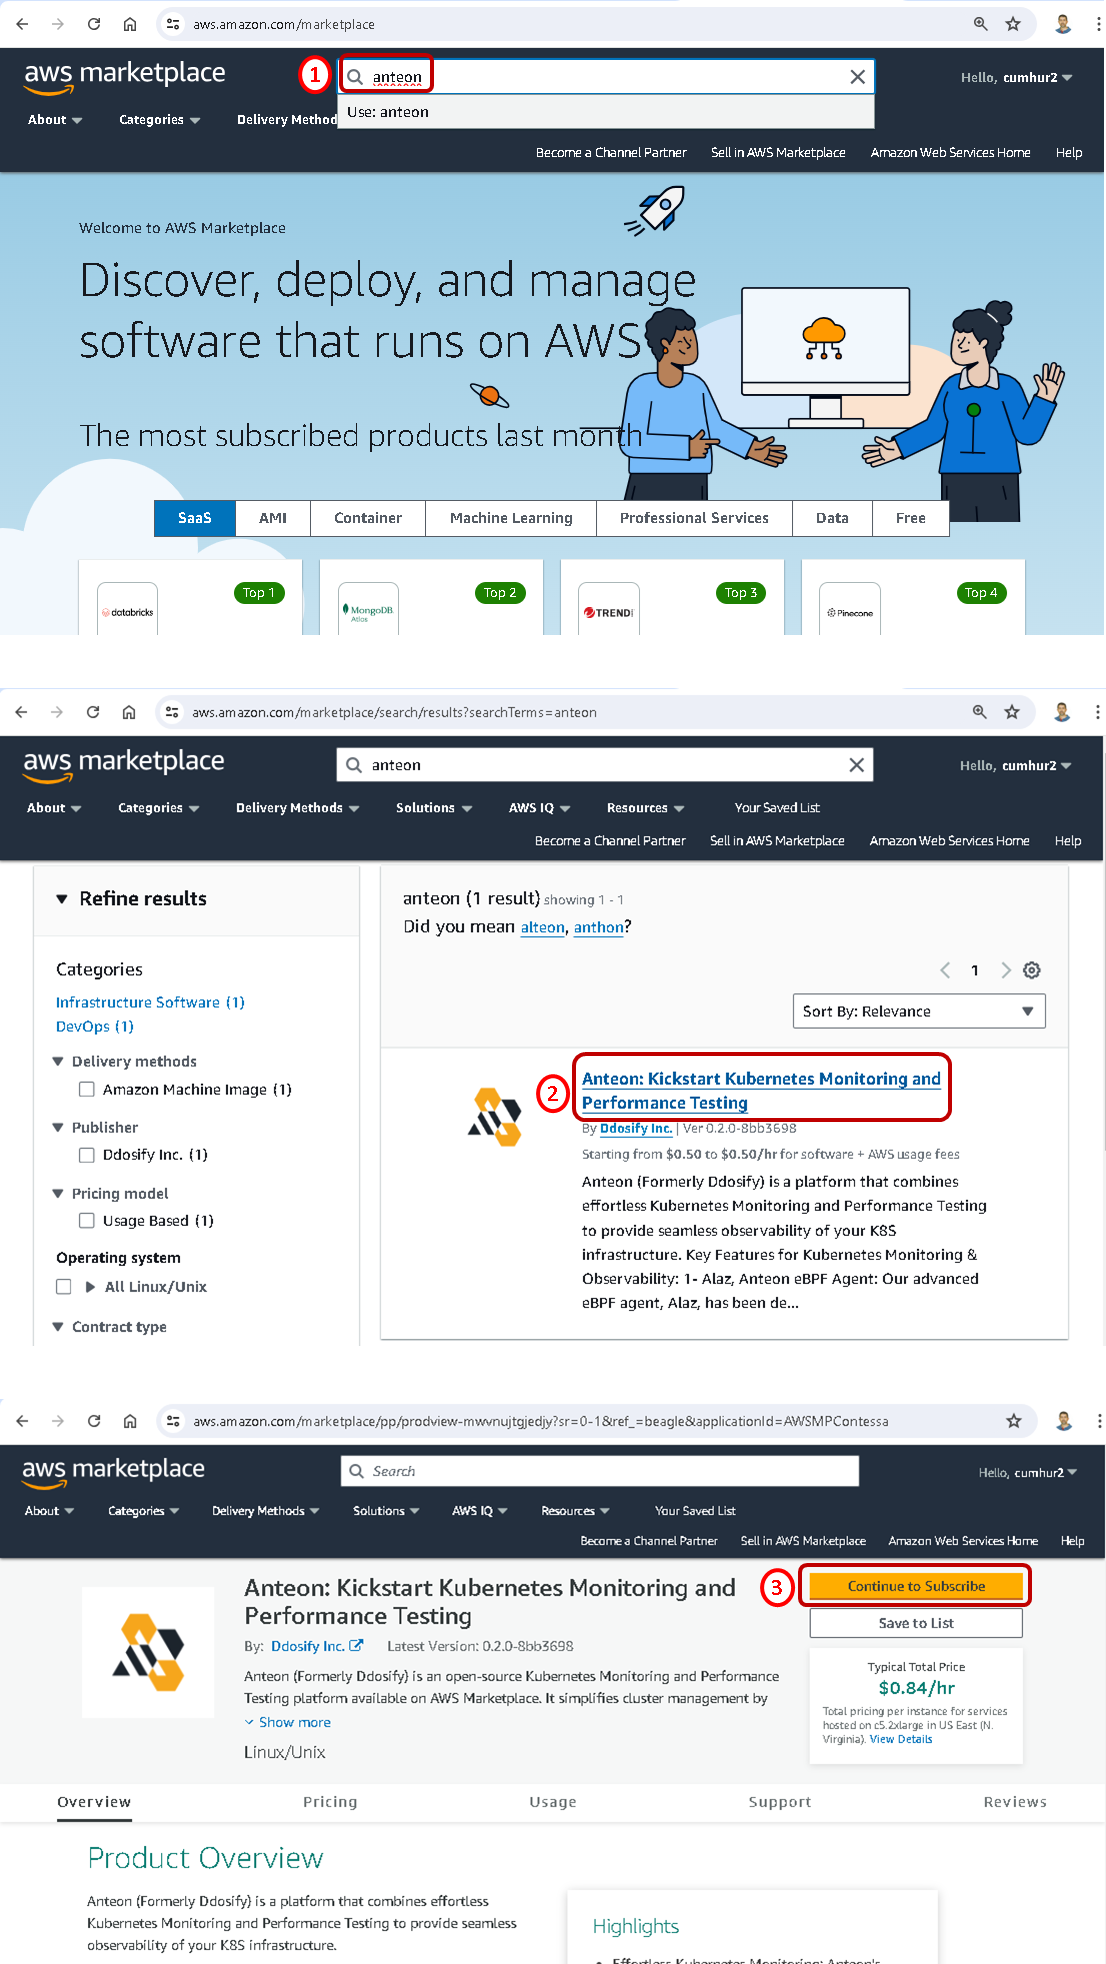
Navigate to the AWS Marketplace website, enter Anteon into the search section (1), click on the enter button, choose Anteon: Kickstart Kubernetes Monitoring and Performance Testing (2), and click on the Continue to Subscribe button (3), as shown in the picture below.
You must first review and accept the terms by clicking on the accept terms button, as shown in the picture below.
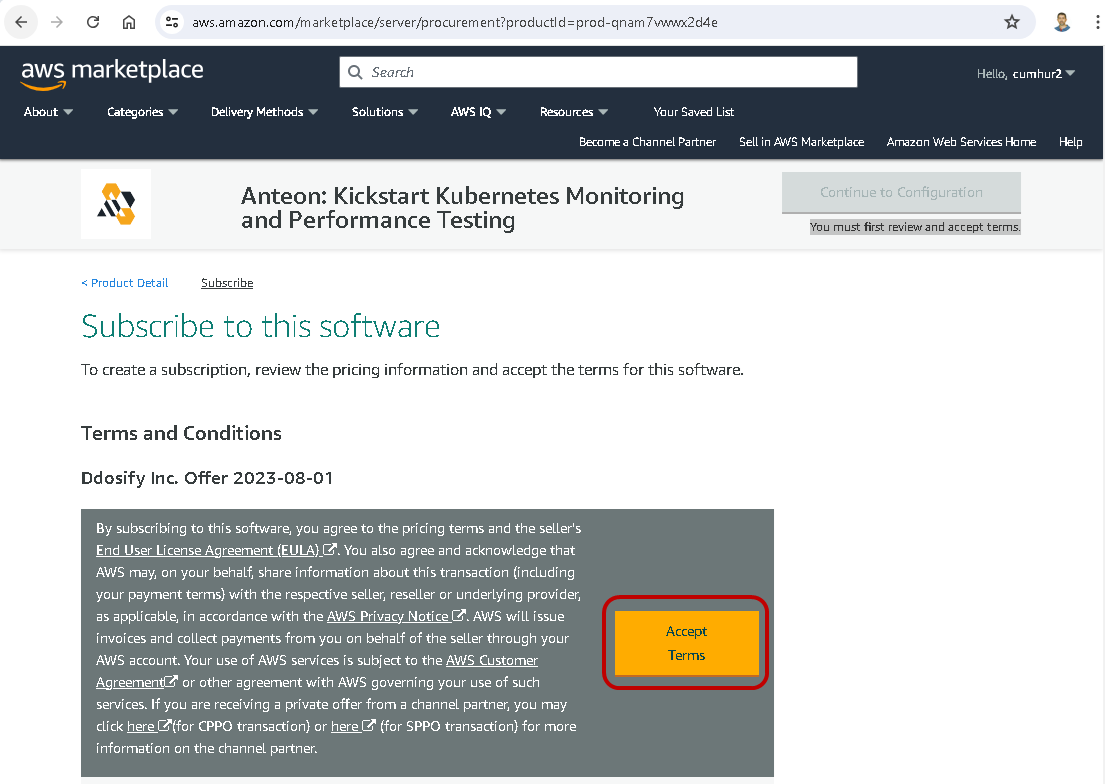
Confirmation will be given within 1–2 minutes, and then the Continue to Configuration button will be activated.

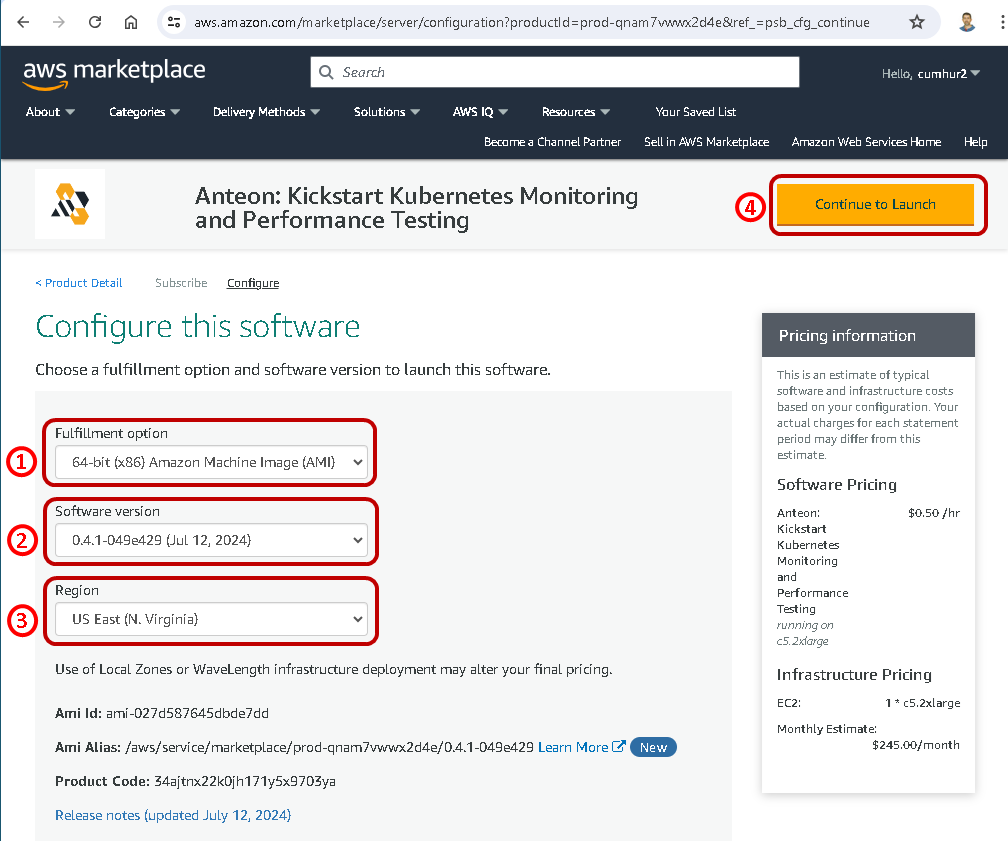
After clicking on the Continue to Configuration button, configure your software on the Configure this software page that opens, as shown in the picture below.
On the Configure this software page, select 64-bit (x86) Amazon Machine Image (AMI) for the Delivery Method (Fulfillment option).
Select the latest version available for Software Version.
Select the Region you want to launch the product in, for example, I selected US East (N. Virginia).
Then, click on the Continue to Launch button, as shown in the picture below.
2.3. Launching Anteon
After clicking on the Continue to Launch button, configure your software in the Launch this software page that opens;
On the Launch this software page, select Launch from Website in the dropdown list, as shown in the picture below.
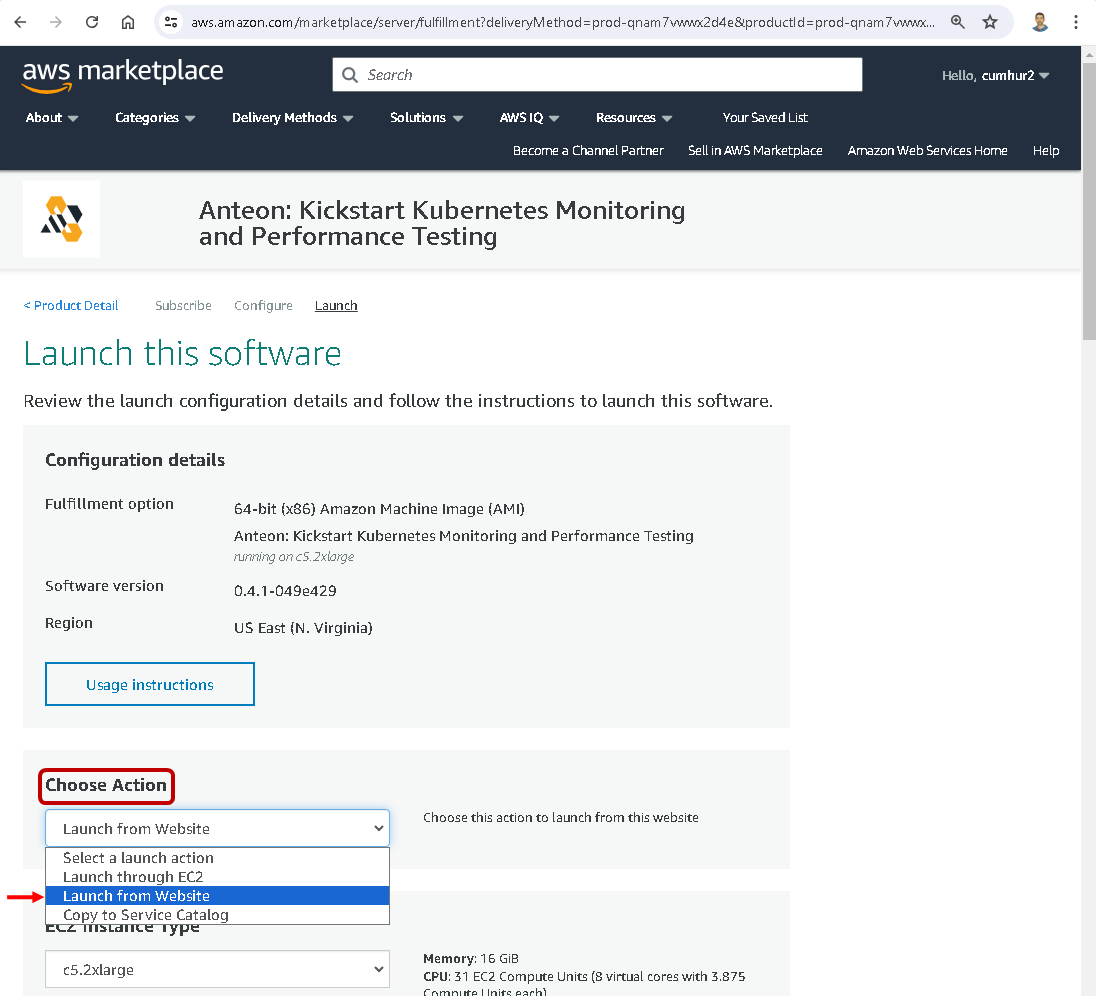
If you select Launch through EC2 in the dropdown list, this action launches your configuration through the Amazon EC2 console.
If you select Copy to Service Catalog in the dropdown list, this action copies your configuration of software to the Service Catalog console where you can manage your company’s cloud resources.
Setting EC2 Instance Type, VPC, and Subnet
Then, in the EC2 Instance Type dropdown list, choose an instance type. c5.2xlarge is Vendor Recommended, as shown in the picture below.
In the VPC Settings and Subnet Settings dropdown lists, select the network settings you want to use, as shown in the picture below.
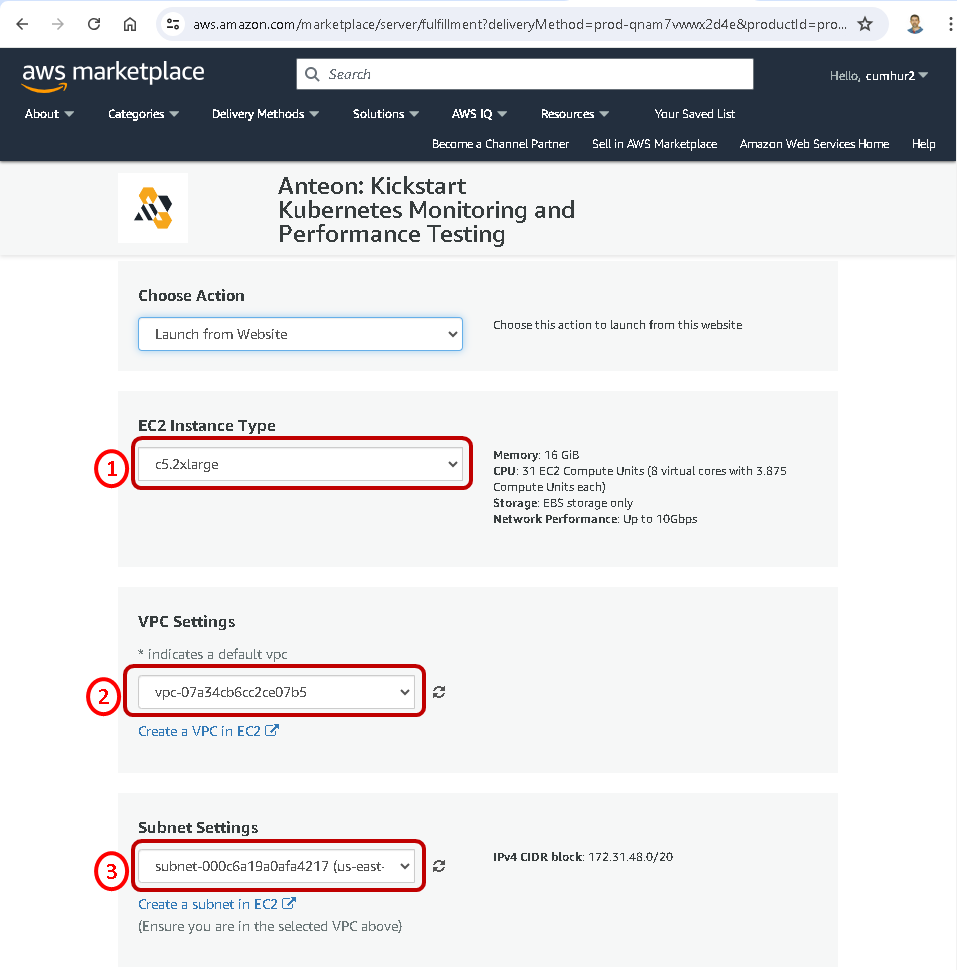
Note: To avoid getting the error shown below, do not select subnet (us-east-1-e) because instance type (c5.2xlarge or c5.xlarge) is not supported in the Availability Zone (us-east-1e).

Setting A Security Group
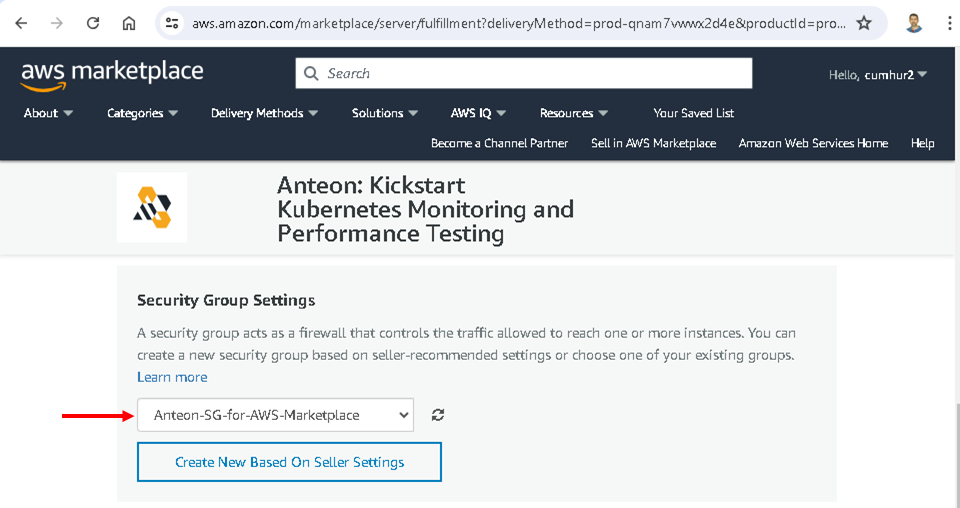
A security group acts as a firewall that controls the traffic allowed. We can create it to reach the Anteon EC2 instances. You can create a new security group based on seller-recommended settings or choose one of your existing groups. Make sure to open ports 8014 and 22 in your security group.
I chose the Create New Based On Seller Settings button. Then, enter a name into Name your security Group and Description, and click on the Save button, as shown in the picture below.

The security group has been created and selected, as shown in the picture below.
Setting A Key Pair
Choose an existing key pair if you have one. I chose my key pair named Cumhur, as shown in the picture below. If you don’t have a key pair, click on the Create a key pair in EC2. For more information about Amazon EC2 key pairs, see Amazon EC2 key pairs.
Finally, click on the Launch button to launch Anteon, as shown in the picture below.
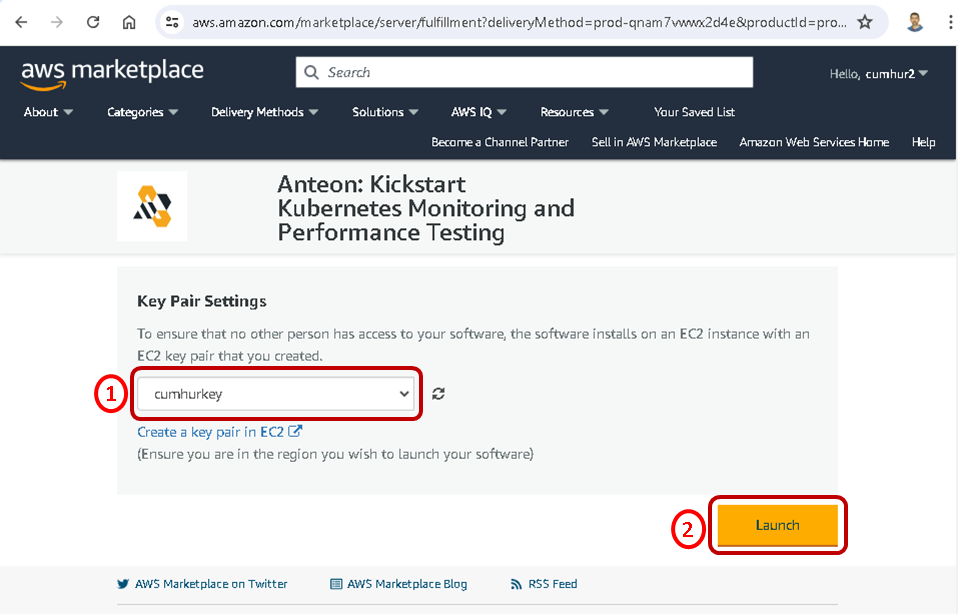
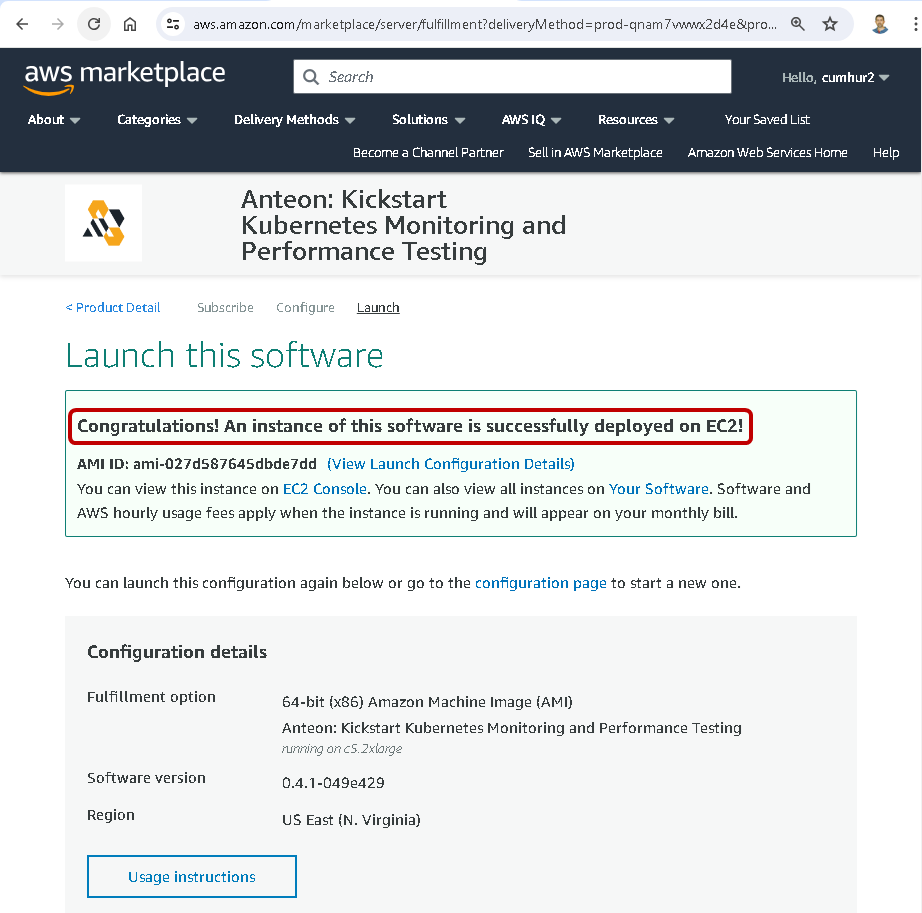
The instance of Anteon software is successfully deployed on Amazon EC2, as shown in the pictures below.
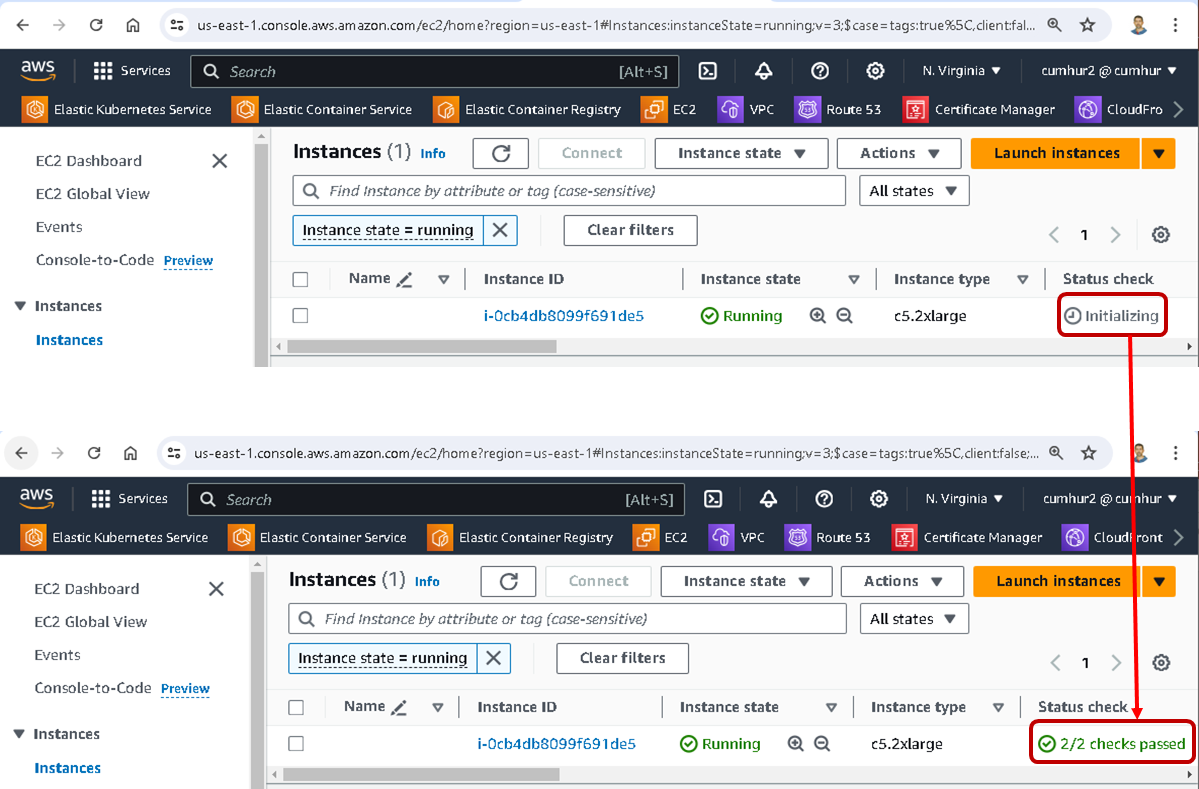
We can check it on the EC2 menu on the Amazon Console.
2.4. Accessing The Anteon UI
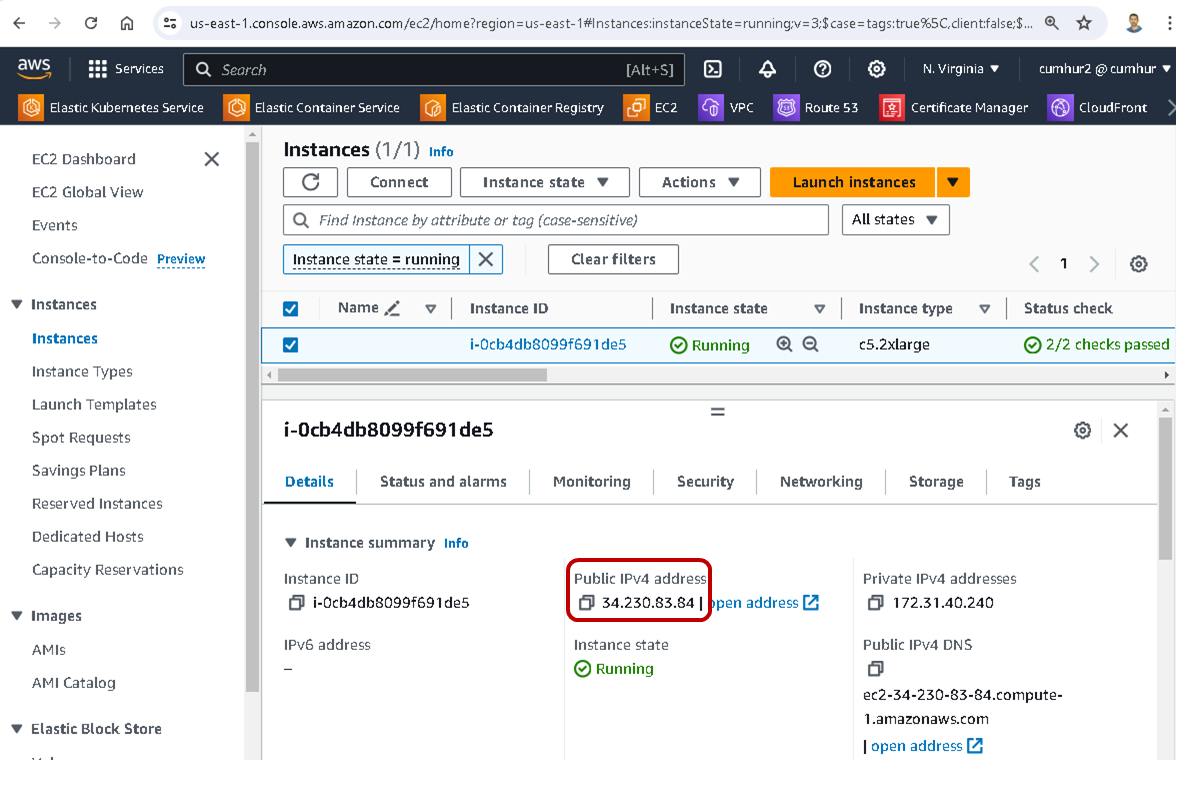
To access the Anteon UI, please visit http://<your_EC2_external_ip>:8014. For this, copy your Public IPv4 address from the EC2 menu on the Amazon Console, as shown in the picture below.
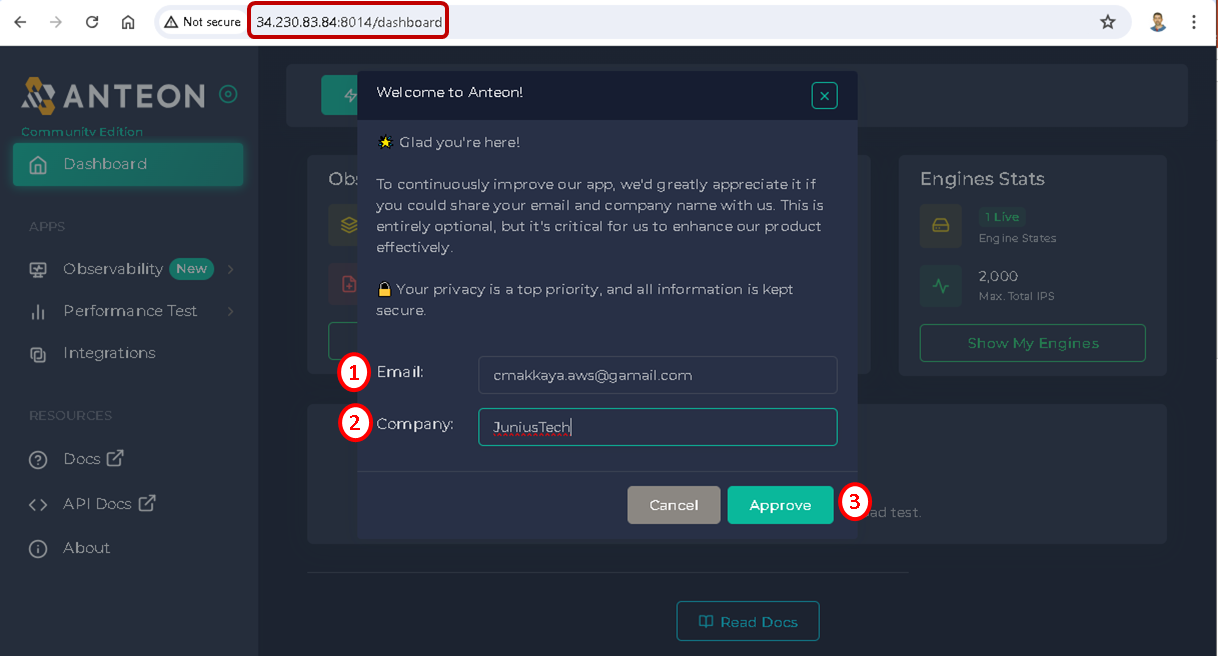
For example, I entered http://34.230.83.84:8014, to access the Anteon UI running in the Amazon instance. In the Anteon IU window that opens, enter your e-mail and company name and confirm (this is optional), as shown in the picture below.
2.5. Upgrading to Enterprise Edition
Now, Anteon is ready for monitoring and performance testing, as shown in the picture below.
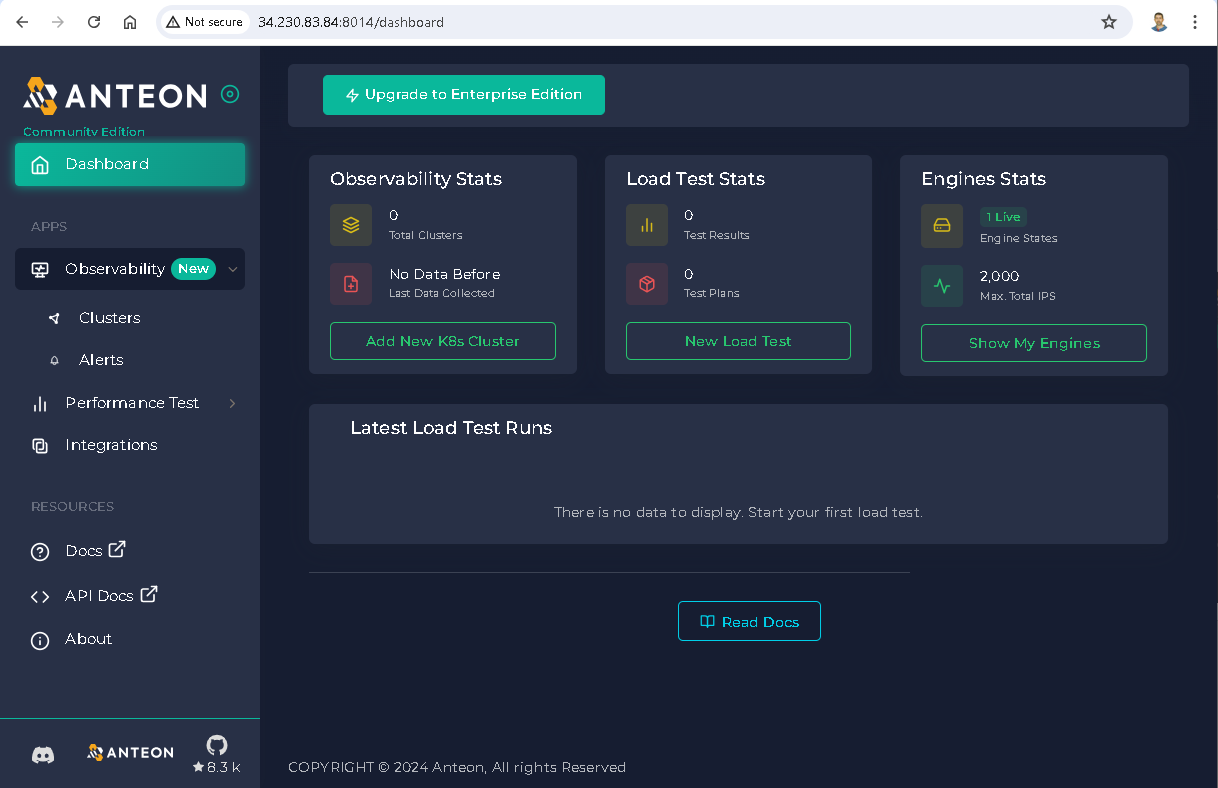
In Anteon, Community Edition is free but has some limitations(6). For more information about creating an Anteon Account, usage charges, free usage, and limitations, check out my article at this link.
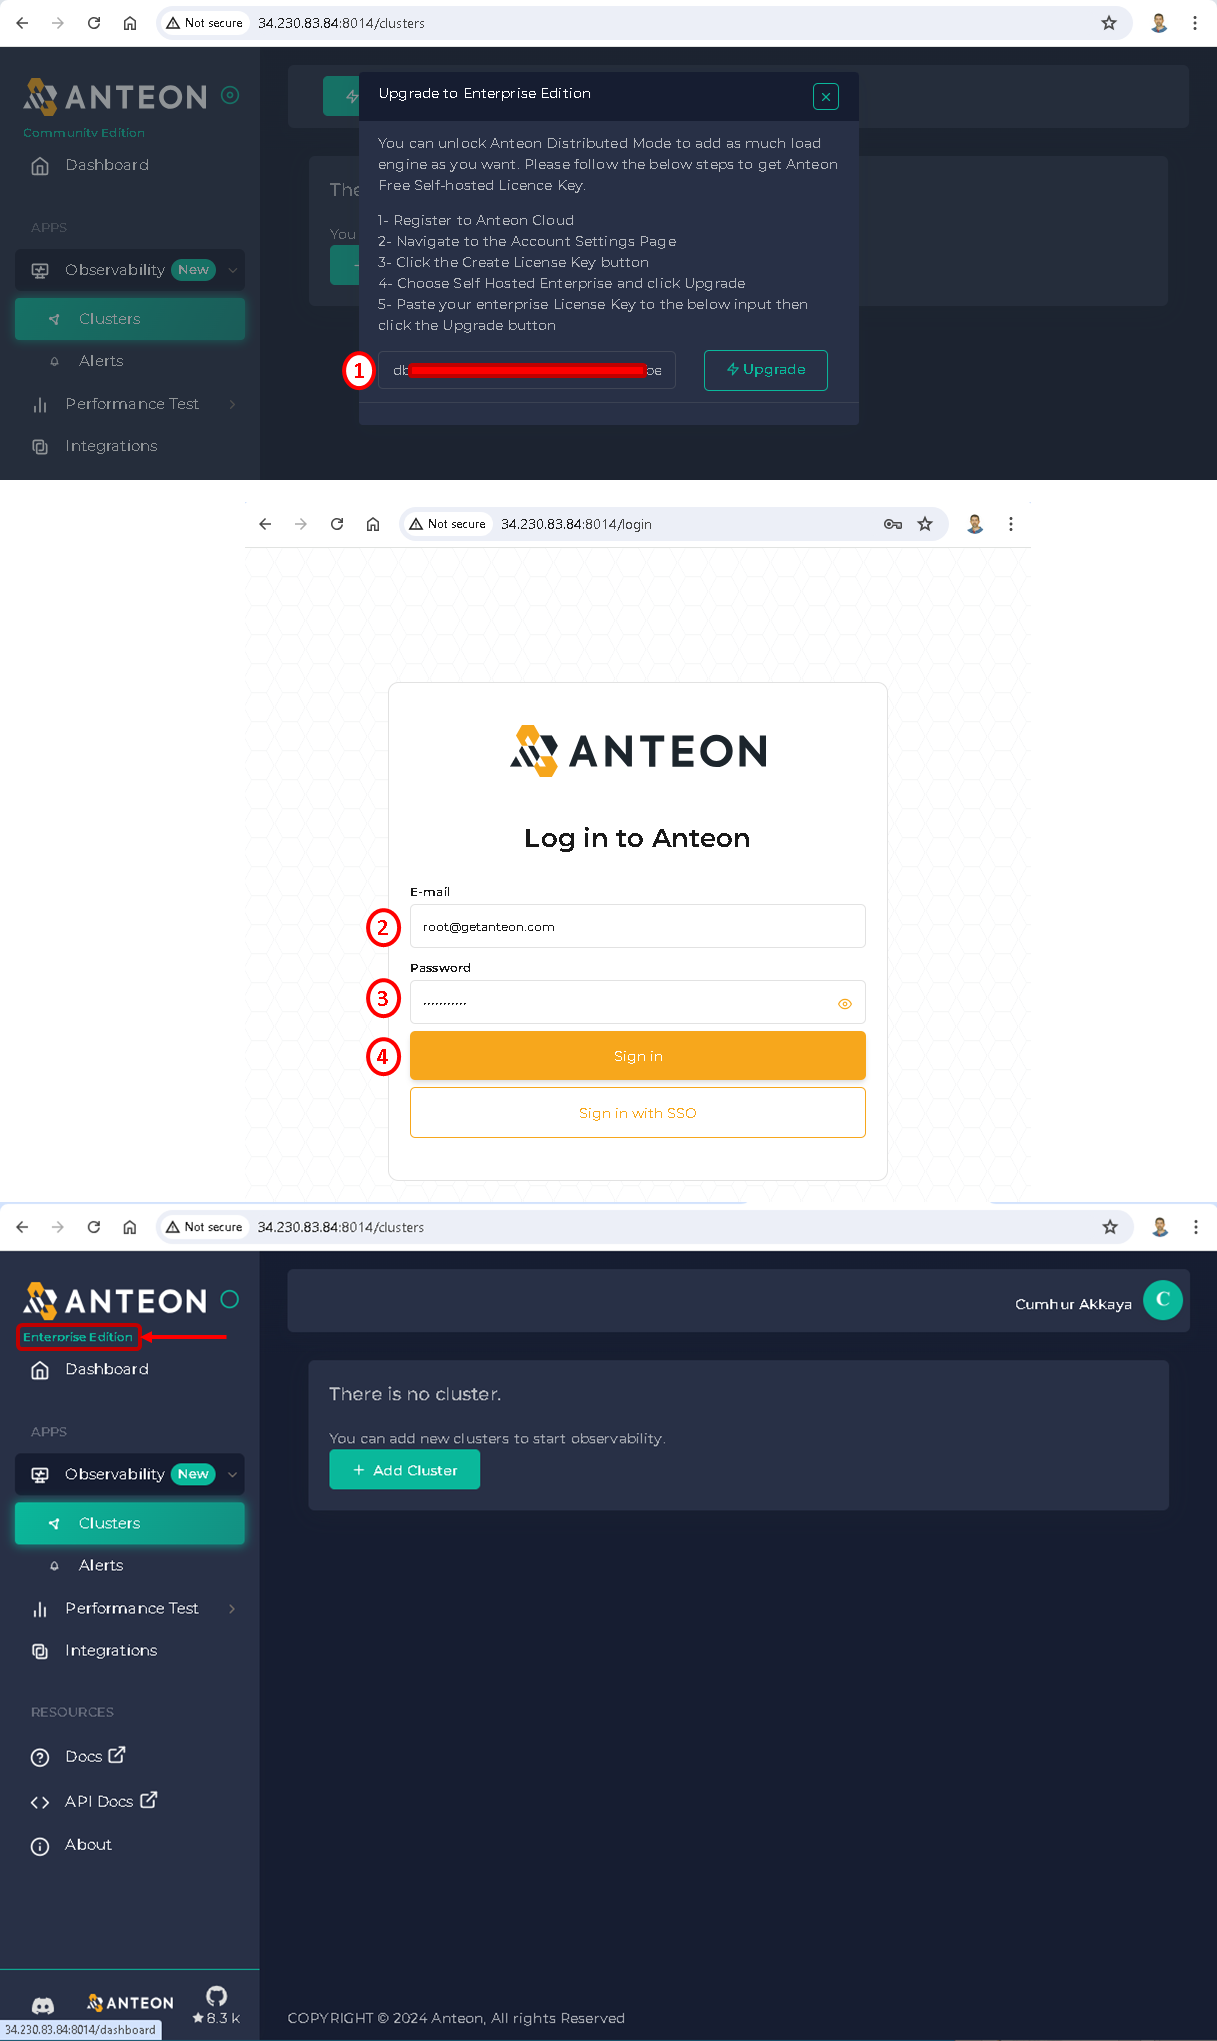
By clicking on the Upgrade to Enterprise Edition button, we can upgrade our Anteon version from Community Edition to Enterprise Edition.
To do this, first, you must get the Enterprise license by following the instructions in the pop-up window that opens. Paste your Enterprise license you got into the box (1) and then click on the Upgrade button, as shown in the picture below.
Enter your email and password then click on the Sign in button (2,3,4). That’s all, you are using the Enterprise Edition now, as shown in the picture below.
2.6. Managing Your Anteon Subscriptions
At any time, you can manage your software subscriptions in AWS Marketplace by using the Manage Subscriptions page of the AWS Marketplace console.
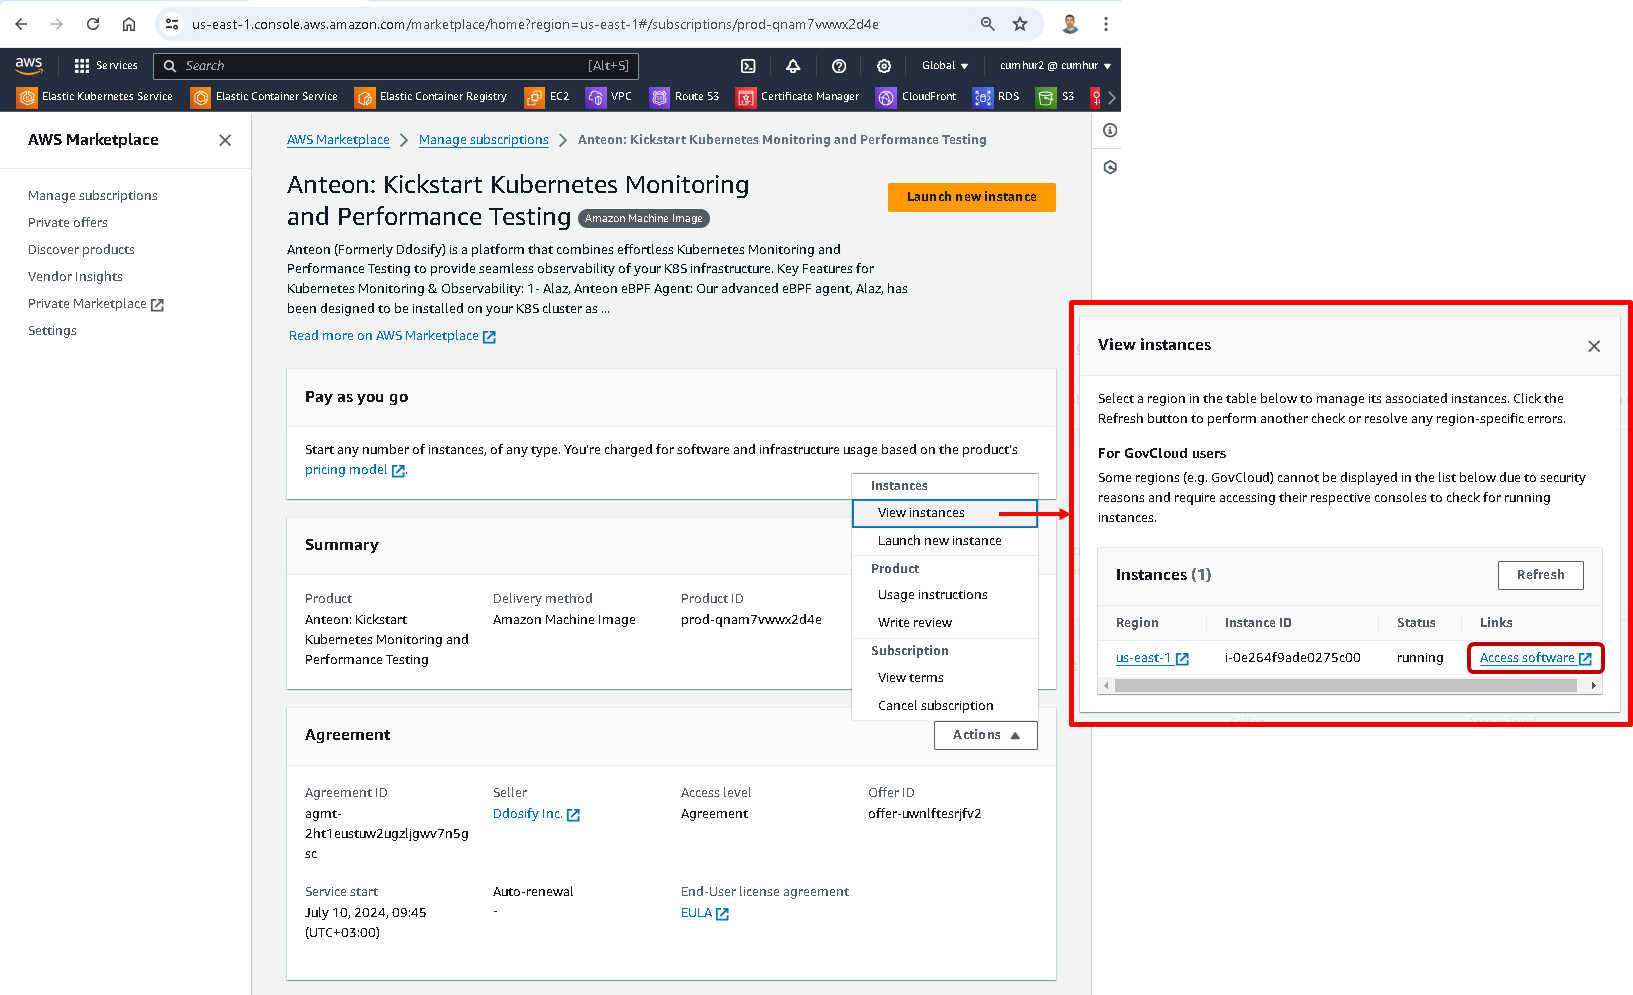
To manage your software, navigate to the AWS Marketplace console, and choose Manage Subscriptions . Now you can see your Anteon Subscriptions on the Manage Subscriptions page.
Click the Manage button, or select Anteon: Kickstart Kubernetes Monitoring and Performance Testing Manage subscriptions, as shown in the picture below.

On the “Anteon: Kickstart Kubernetes Monitoring and Performance Testing Manage subscriptions” page that opens:
- You can access Anteon by clicking the
Access softwarebutton, as shown in the picture below. - You can cancel your Anteon subscription by clicking the
Cancel subscriptionbutton. - You can view your instance status by clicking the
View instancesbutton, thus we can see the deployed EC2 instance. - You can launch a new instance.
- You can view seller profiles for your instance.
- You can manage your instances.
- Link directly to your Amazon EC2 instance so you can configure your software.
3. Deploying and Running a Microservices App with MySQL Database on The Amazon EKS Kubernetes Cluster
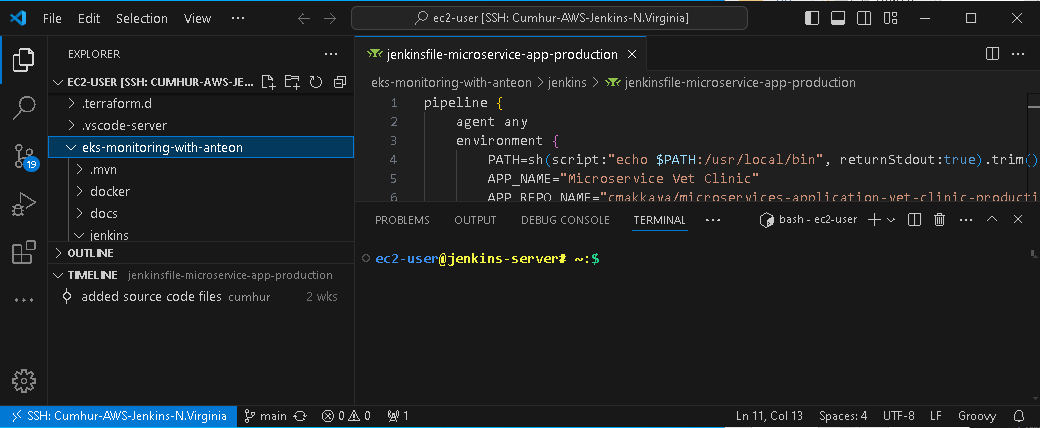
We’ll use an Amazon EC2 (Amazon Elastic Compute Cloud) instance to run the Jenkins CI/CD Pipeline and reach our Kubernetes cluster. I will use my EC2 instance named AWS Jenkins server for this job. Copy your EC2 instance’s public IP to connect to the EC2 instance (The name of my EC2 instance is AWS Jenkins server), as shown in the figures below.

I use VSCode to connect to my servers. Paste the AWS Jenkins server’s public IP into the VSCode config file, and then click on the Connect to host, and select the host you want to connect to, that’s all, I connected to my EC2 instance named AWS Jenkins server, as shown in the figures below.
Note: You can check my article link for more information about the connection to the EC2 instance using VSCode. You can also check this link for more information about different connection methods to EC2 instances.
Kubernetes Microservices Deployment
I ran the Jenkins CI/CD Pipeline, and it was completed successfully, as shown in the figures below.
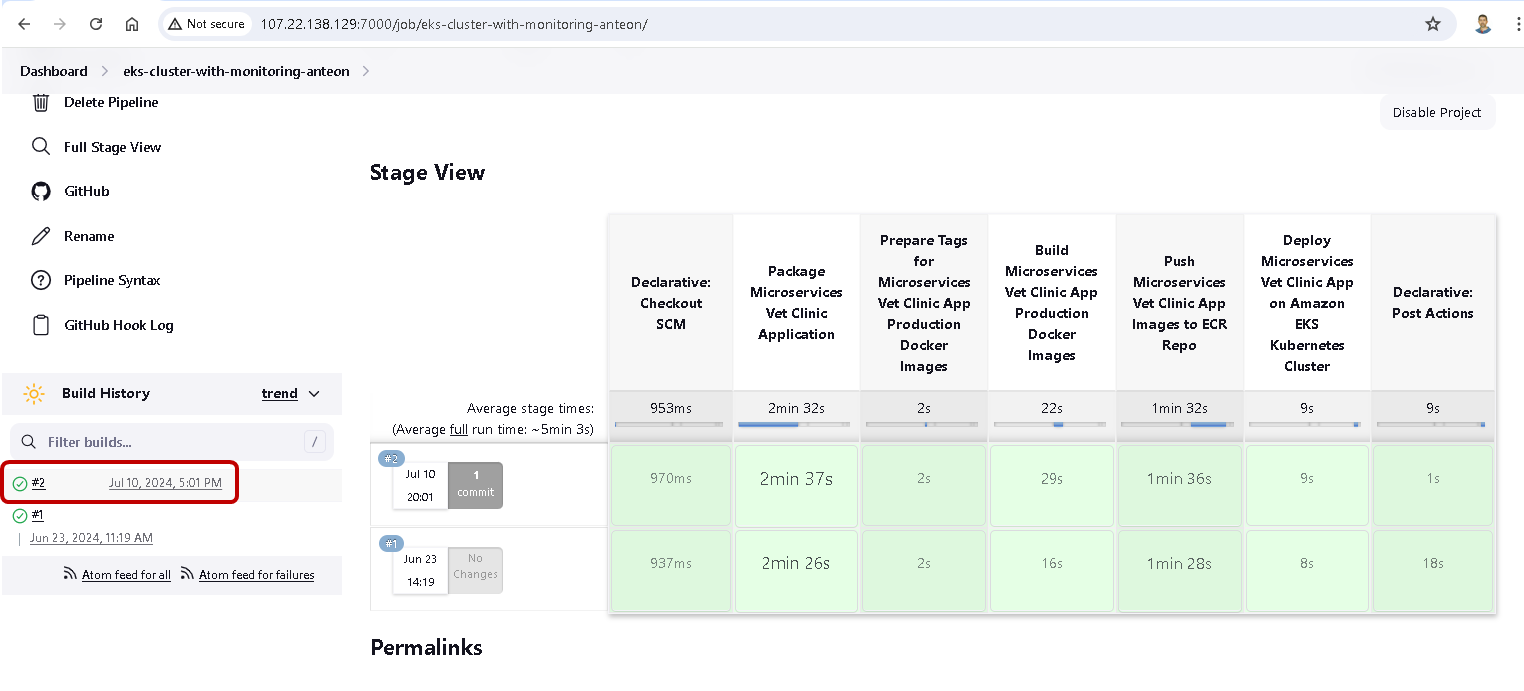
In my previous article (Step-by-Step Tutorial to Set Up, Build a CI/CD Deployment Pipeline, and Monitor a Kubernetes Cluster on Amazon EKS), we prepared a pipeline in Jenkins and deployed a Java-based web application that consists of 11 microservices into the Kubernetes cluster by using Helm on the Jenkins pipeline. We integrated the Amazon RDS MySql Database for customer records into the microservices app on the Jenkins pipeline. We also used a GitHub Repository for Source Code Management and an Amazon ECR Private Repository for Artifacts.
Additionally, we used Amazon Route 53 for the domain registrar and configured a TLS/SSL certificate for HTTPS connection to the domain name using Let’s Encrypt-Cert Manager. After running the Jenkins pipeline, we checked whether our microservices application works in the browser or not.
We'll use the same CI/CD Pipeline and microservices web application to monitor Kubernetes Cluster Performance today. I won’t explain the same steps in detail again here, for more information please check this link.
4. Checking Whether The Microservices App Is Running Via CLI And The Browser.
We can check that our resources have been successfully deployed with the following commands, as seen in the figure below.
kubectl get nodes
kubectl get po,deploy,svc,ing -n petclinic-prod-ns
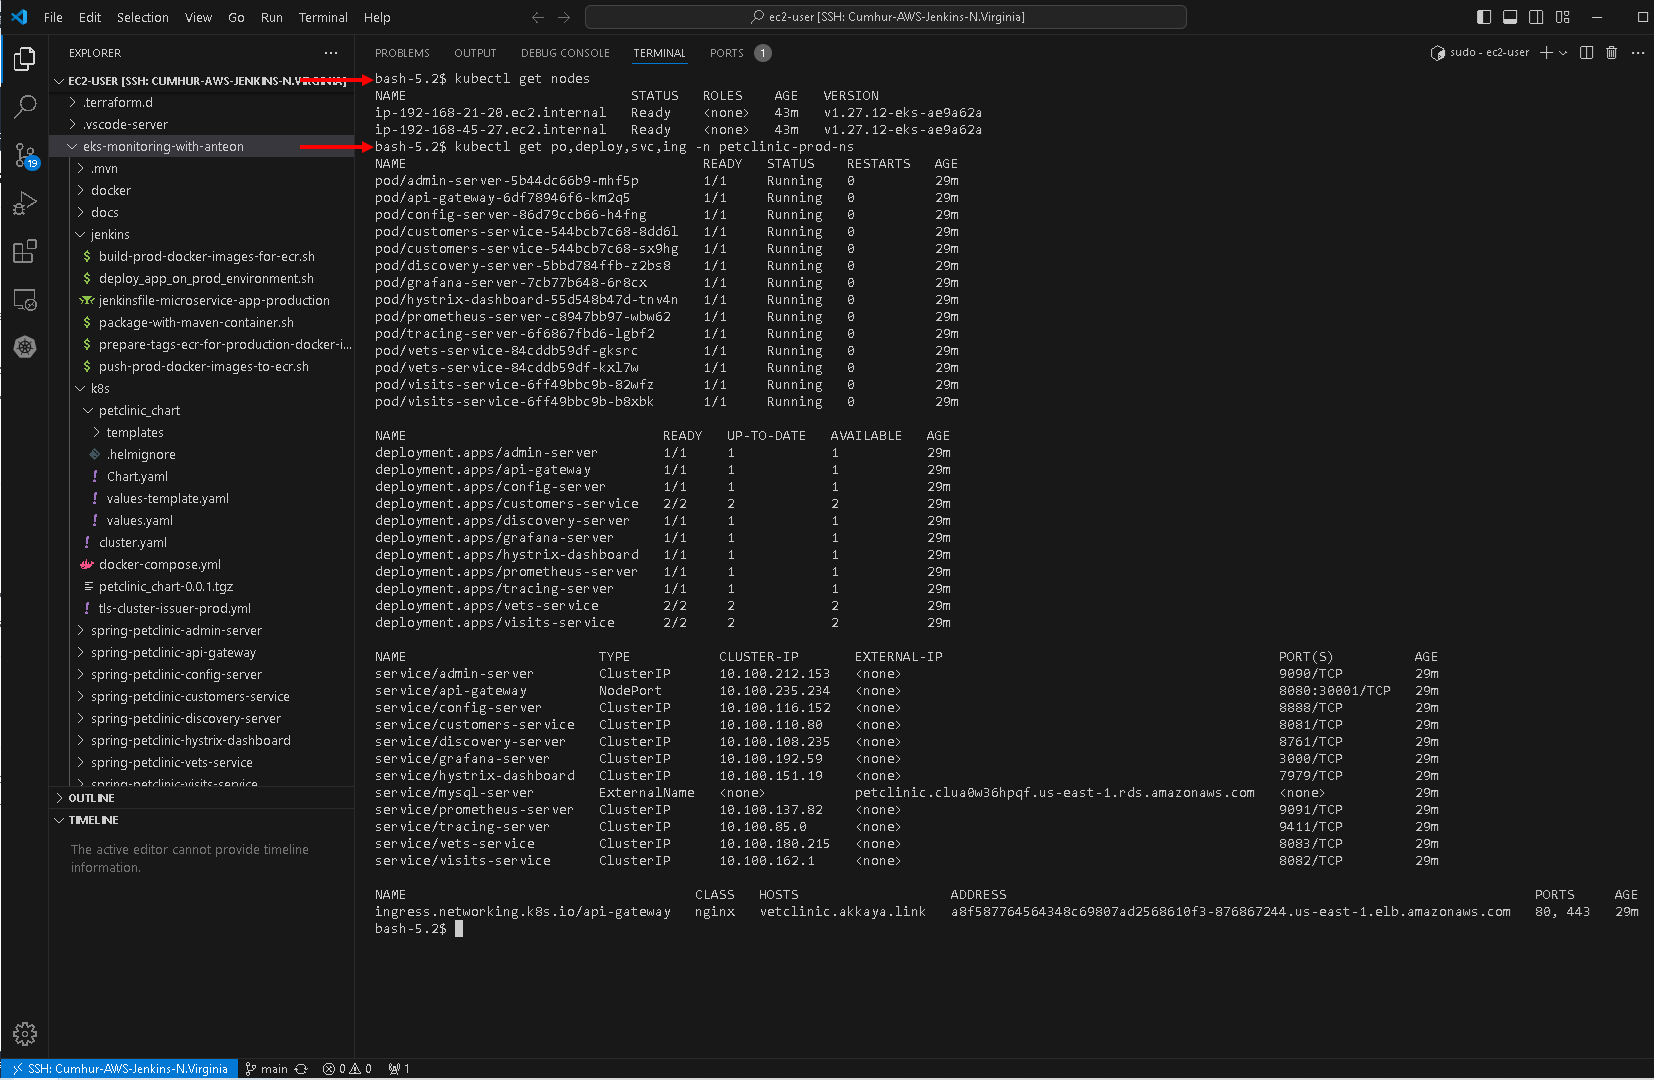
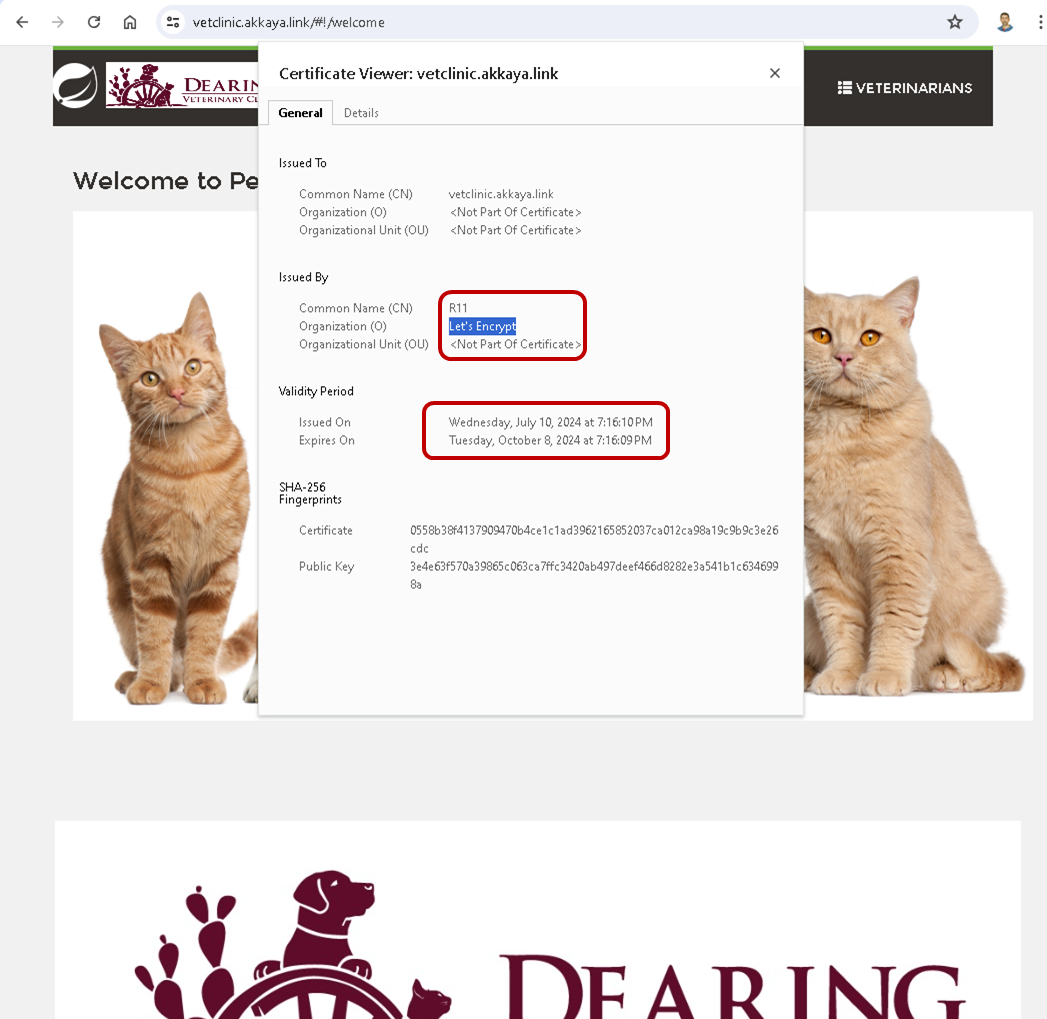
We can check that we have received our 3-month valid certificate from Let’s Encrypt, as shown in the figures below.
Created Amazon RDS MySql Database for customer records, as shown in the figures below.
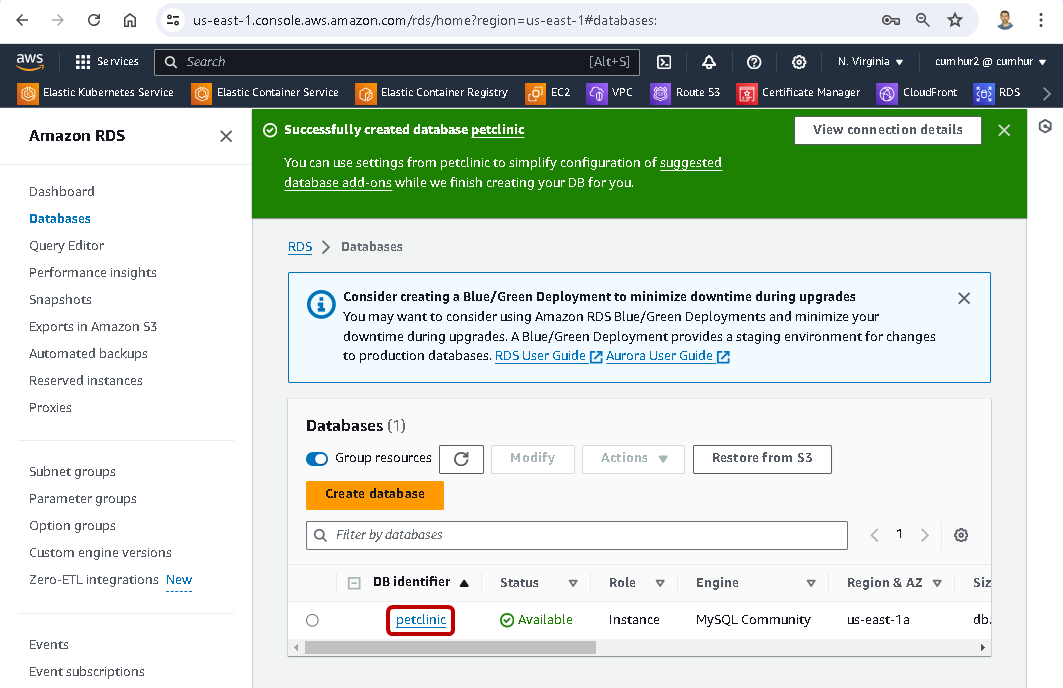
The database for customer records is running, as shown in the figures below.
Created microservices app image in the Amazon ECR, as shown in the figures below.

5. Kubernetes Monitoring Using Anteon
Kubernetes cluster has been created and the microservice application is running successfully in it.
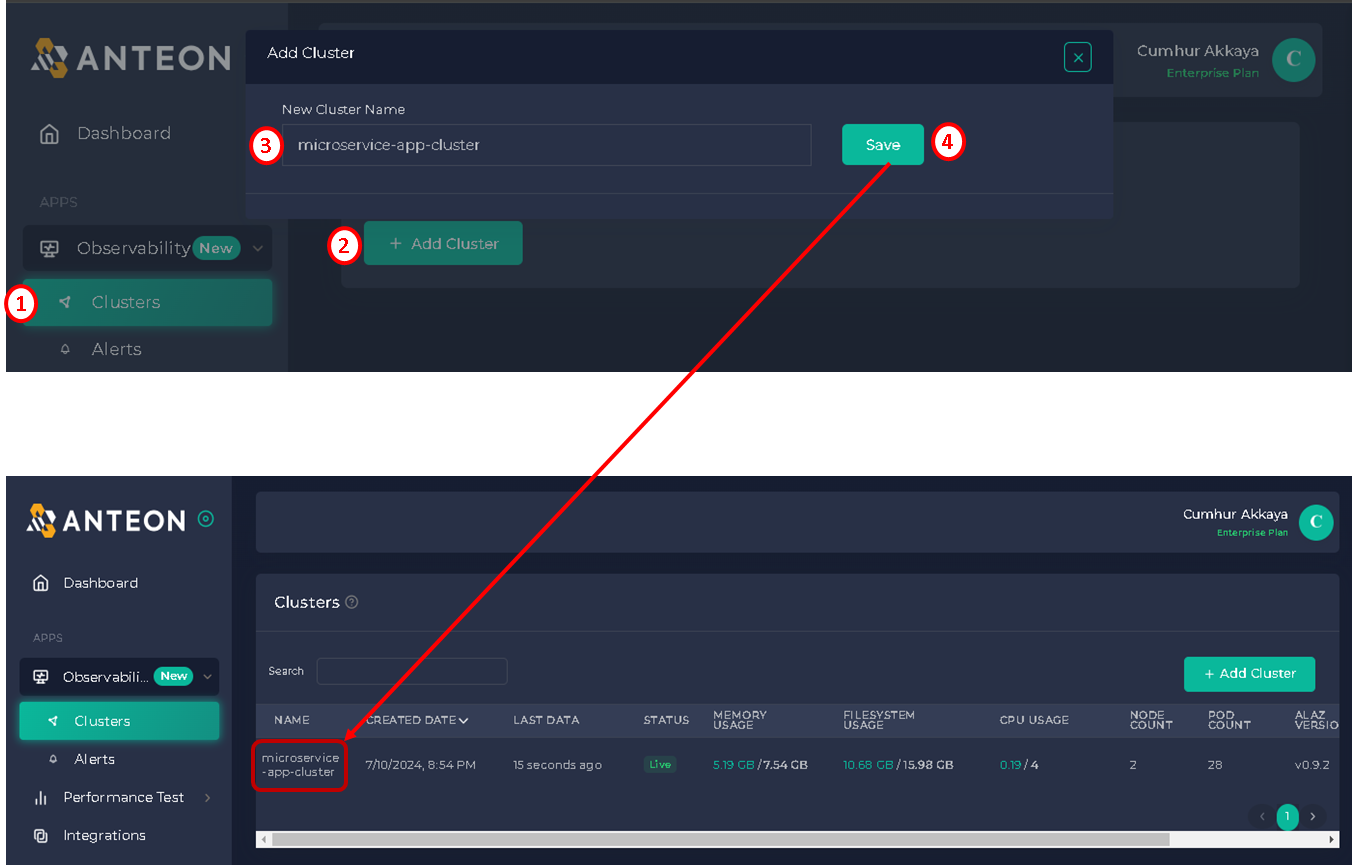
To start monitoring our Kubernetes Cluster, we need to create a new Cluster on the Anteon platform. To achieve this:
1. Click on the Clusters button under the Observability on the left menu,
2. Navigate to the Clusters page and click on the +Add Cluster button.
3. Enter a unique name for the Cluster (I entered microservice-app-cluster as my cluster name),
4. Finally, click on the Save button. The cluster is created, as shown in the figures below.
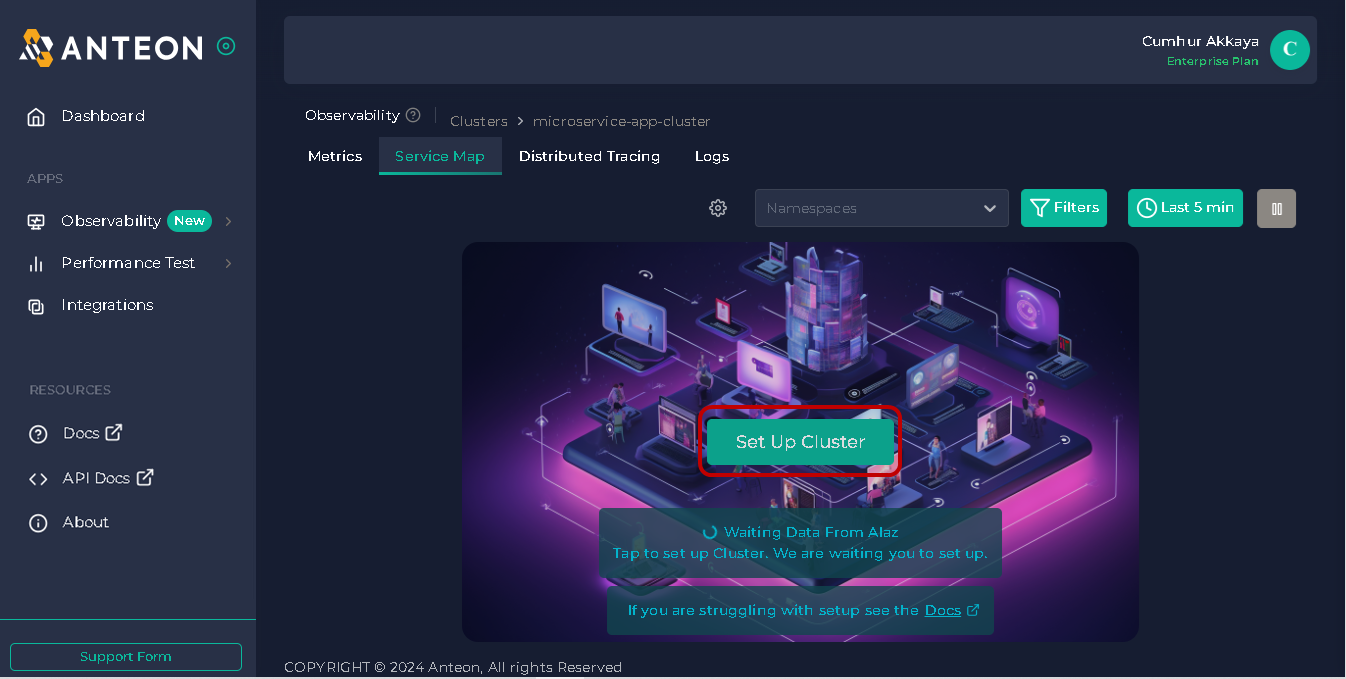
After the cluster is created, we will see Alaz installation instructions. Alaz is an open-source Anteon eBPF agent that can inspect and collect Kubernetes service traffic without the need for code instrumentation, sidecars, or service restarts. It does this using eBPF technology(13). We'll install and run Alaz as a DaemonSet in our Kubernetes Cluster. It'll run on each cluster node separately, collect metrics, and send them to Anteon Cloud or Anteon Self-Hosted. Thus, we can view the metrics on the Anteon Observability dashboard.
Click on the Set Up Cluster button to see Alaz installation instructions, as shown in the figures below.
A pop-up will open and show you how to install Alaz via Kubectl or Helm, I chose Kubectl and then clicked on the Copy button, as shown in the figures below.
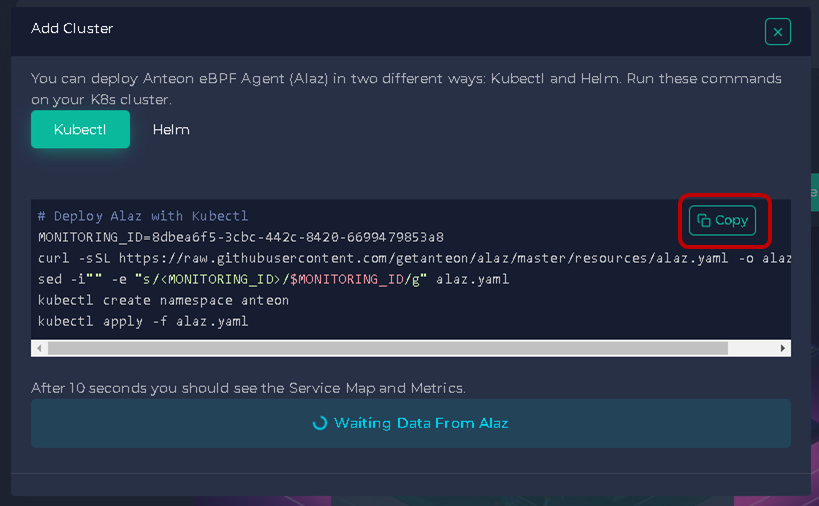
I pasted this code into my cluster, and it installed Alaz as a DaemonSet in my cluster.

Kubernetes Observability
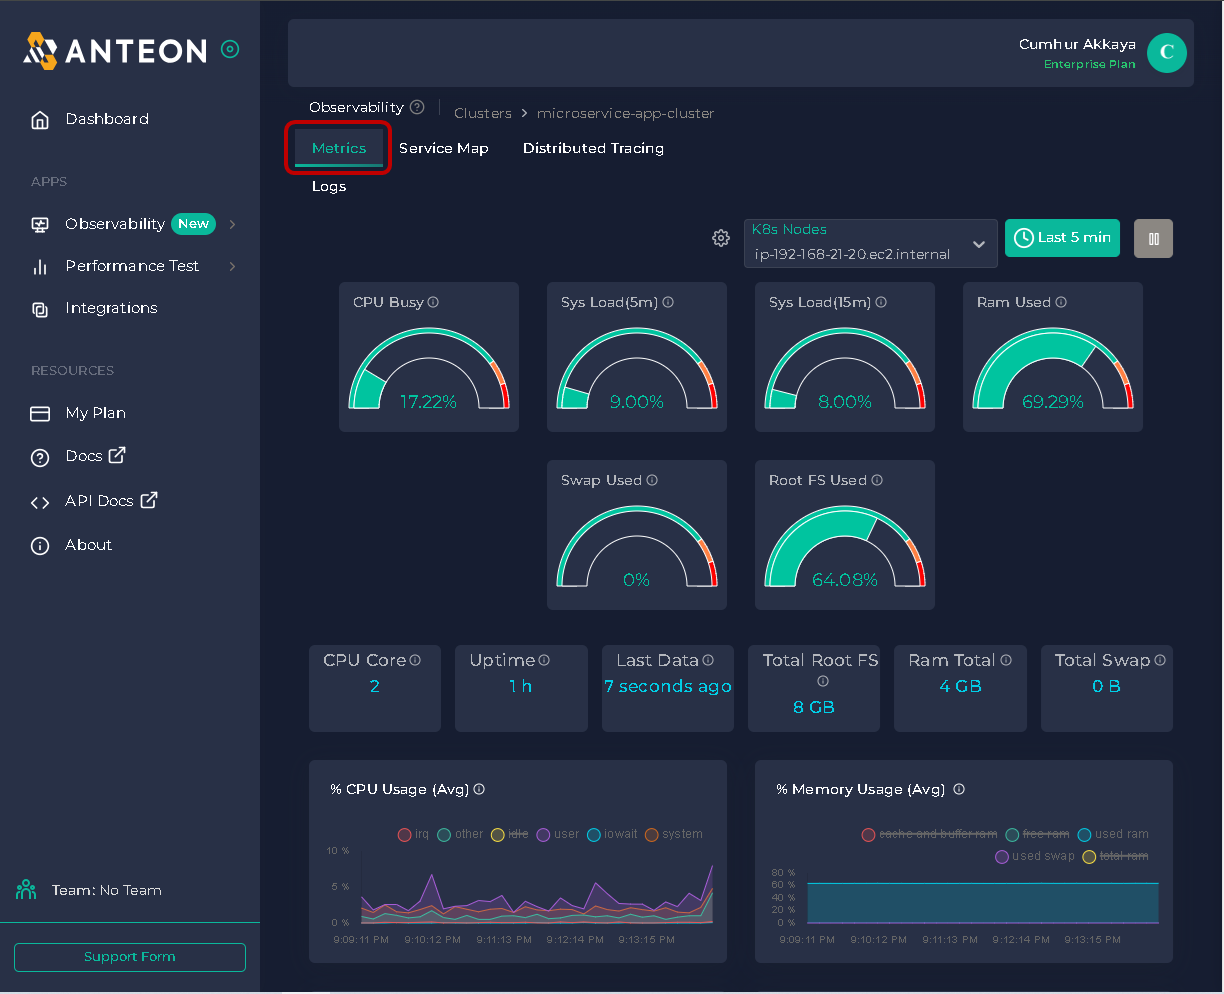
After a few seconds, the Service Map and Metrics Dashboard will be ready on Anteon, and you can see your K8s cluster on Anteon. We can analyze cluster metrics with live data on our CPU, memory, disk, and network usage of our cluster instances in the Metrics tab, as shown in the figure below.
5.1. Microservice Visualization: Anteon Service Map
Once you properly set up your Cluster, Anteon automatically creates a service map for this cluster so you can easily get insights about what is going on in your cluster. Service Map allows you to view the interactions between the resources in your K8s Cluster. Here, you can take a look at the requests sent, their latency, RPS, and many more. You can also filter them. After you click on a cluster you want to observe on the Clusters page, click on the Service Map tab. This will take you to the Service Map page, as shown in the figure below.
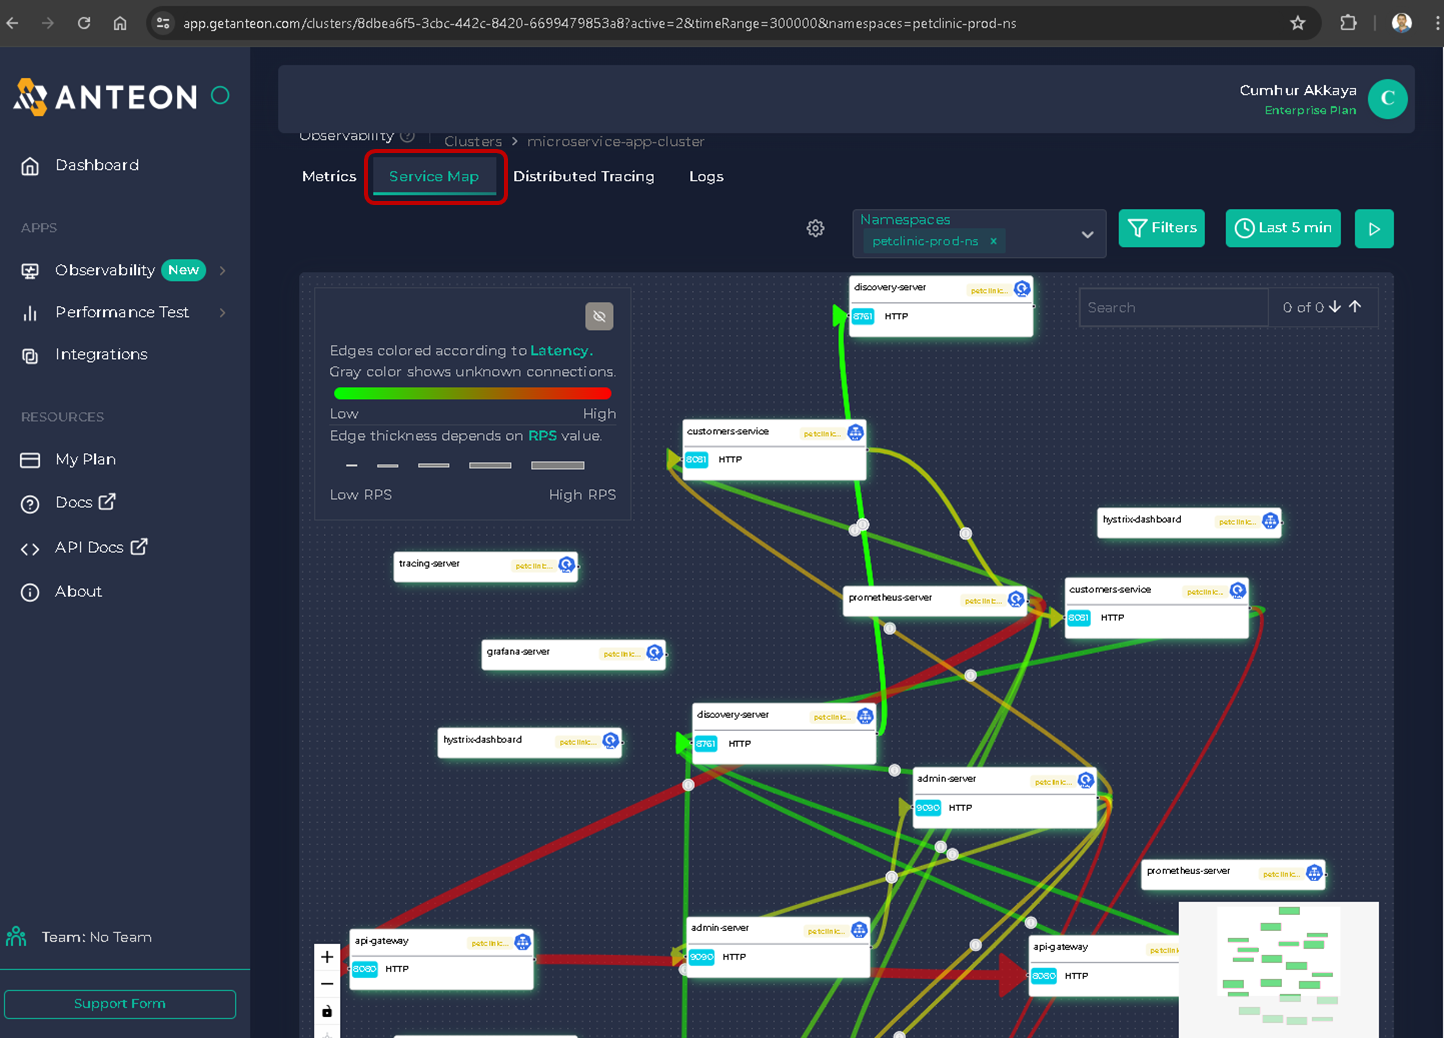
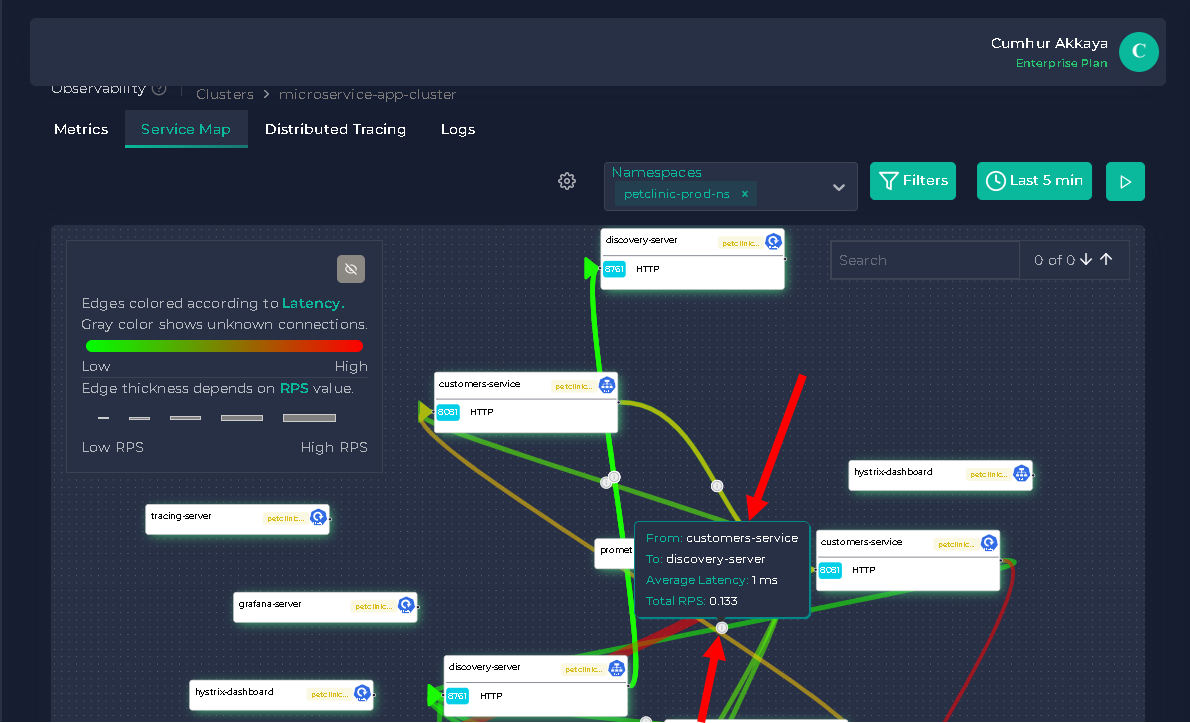
The lines between the resources show the traffic between them. The thicker the line, the more traffic between the resources. The more red the line, the more latency between the resources. You can see the latency and RPS between the resources by hovering ℹ️ over the line, as shown in the figure below.
You can also filter your K8s cluster traffic by namespace, protocol, RPS, and latency, as shown in the figure below.

5.2. Using Service Map To View The Interactions Between The Resources in The K8s Cluster
Identifying potential problems in the cluster before they become critical and adjusting our strategy and resources accordingly is very important to improve Kubernetes cluster performance. To do this, we can examine the interactions between the resources in the K8s Cluster with the Service Map tab.
In this section, we will look for answers to the following questions and find solutions easily(7):
- What is the average latency between service X and service Y?
- Which services have higher/lower latency than XX ms?
- What is the average RPS between service X and service Y?
- Is there a Zombie Service on your cluster?
- How to find a bottleneck in a cluster?
5.2.1. How to Reduce Latency? First Monitor Microservice Performance!
What Is The Average Latency Between Service X and Service Y?
We can learn the average latency between services by using Anteon’s Service Map.
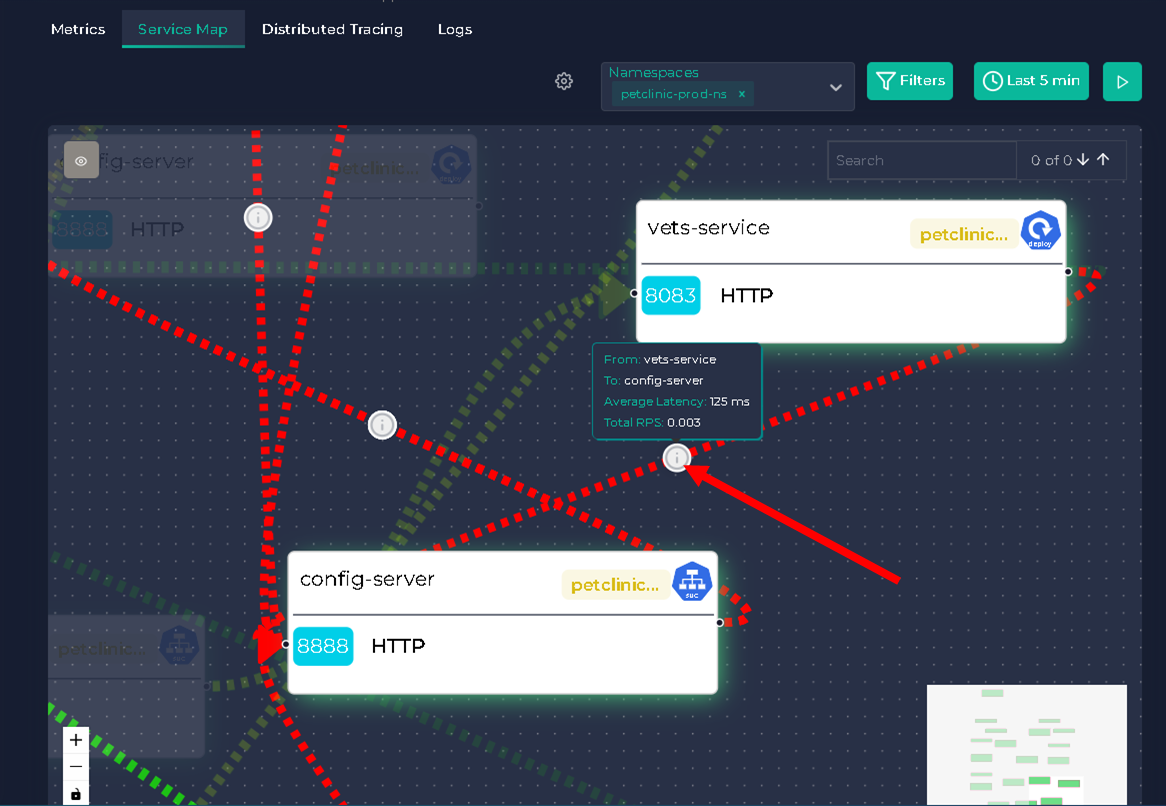
To learn the average latency between service X and service Y, for example, between vets-service and config-server by clicking ℹ️ over the line.
From vets-service to config-server average latency is 125 ms, as shown in the figure below.
5.2.2. Low latency vs. High latency. Which Services Have Higher/Lower Latency Than XX ms?
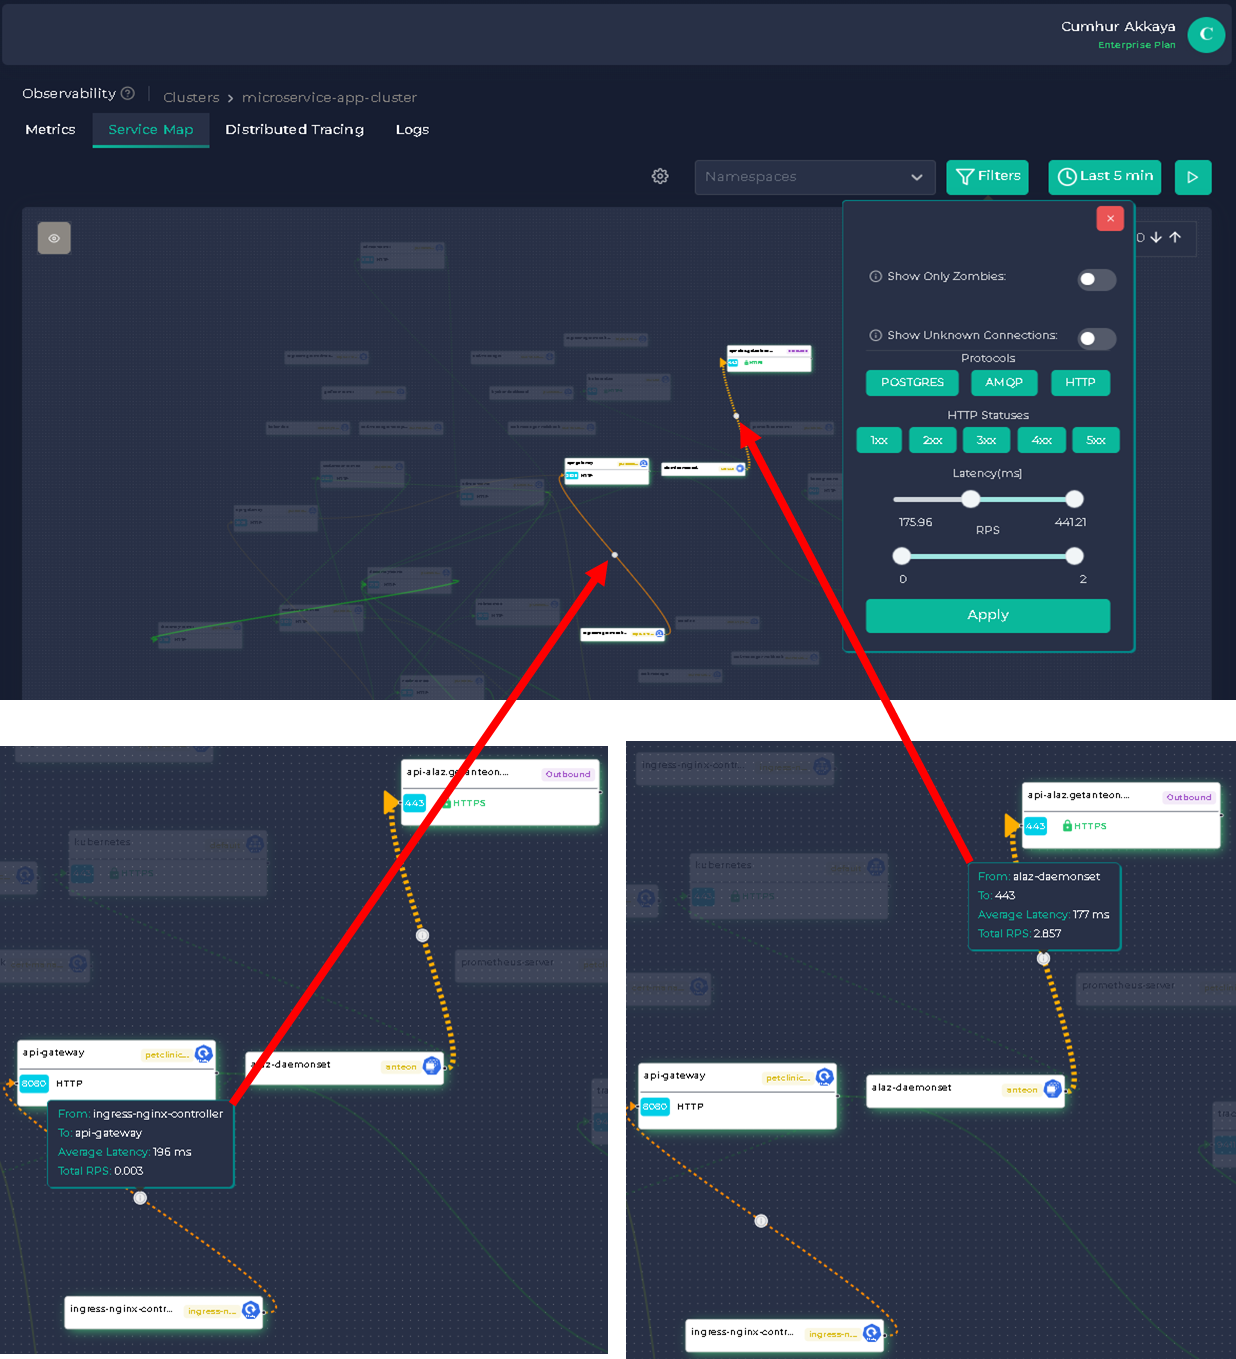
To find latencies greater than 175 ms, we can use Filters, as shown in the figure below.
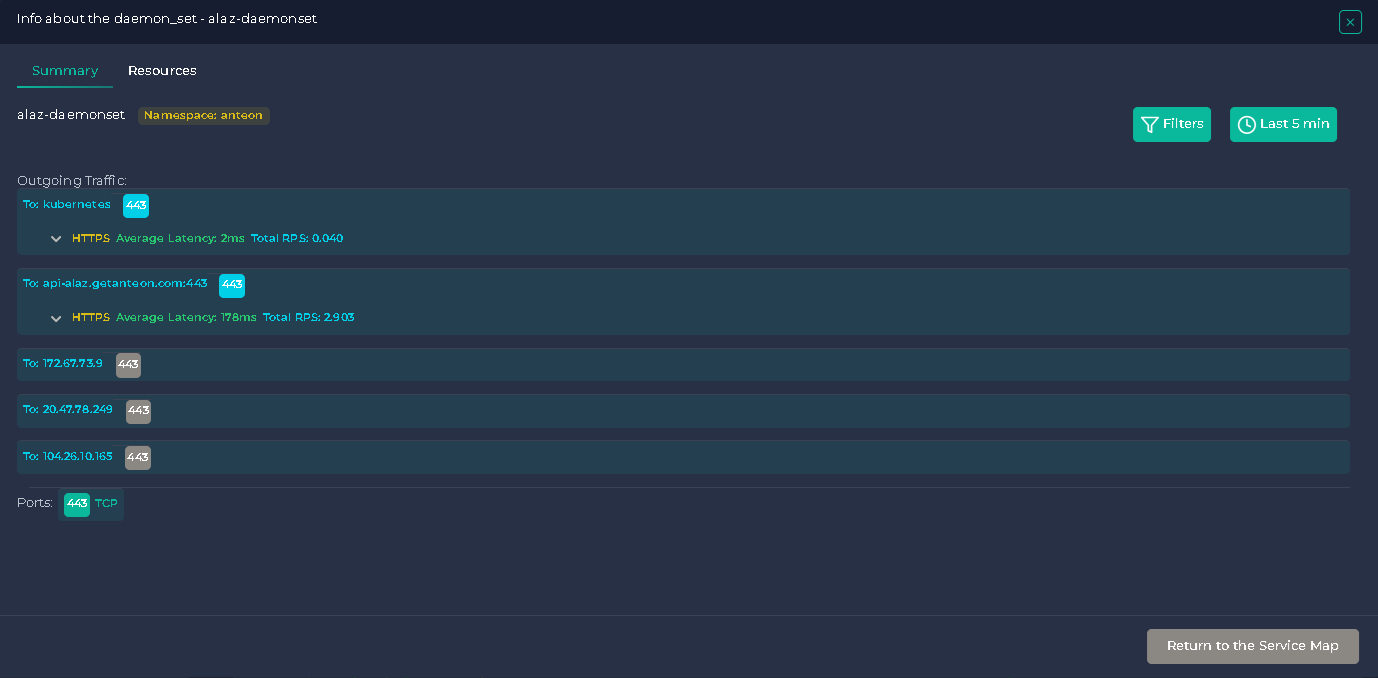
Accordingly, the only services with a delay of more than 175 ms. are between apigateway and ingress-nginx-controller, and alez-daemonset and api-alez.getanteon.
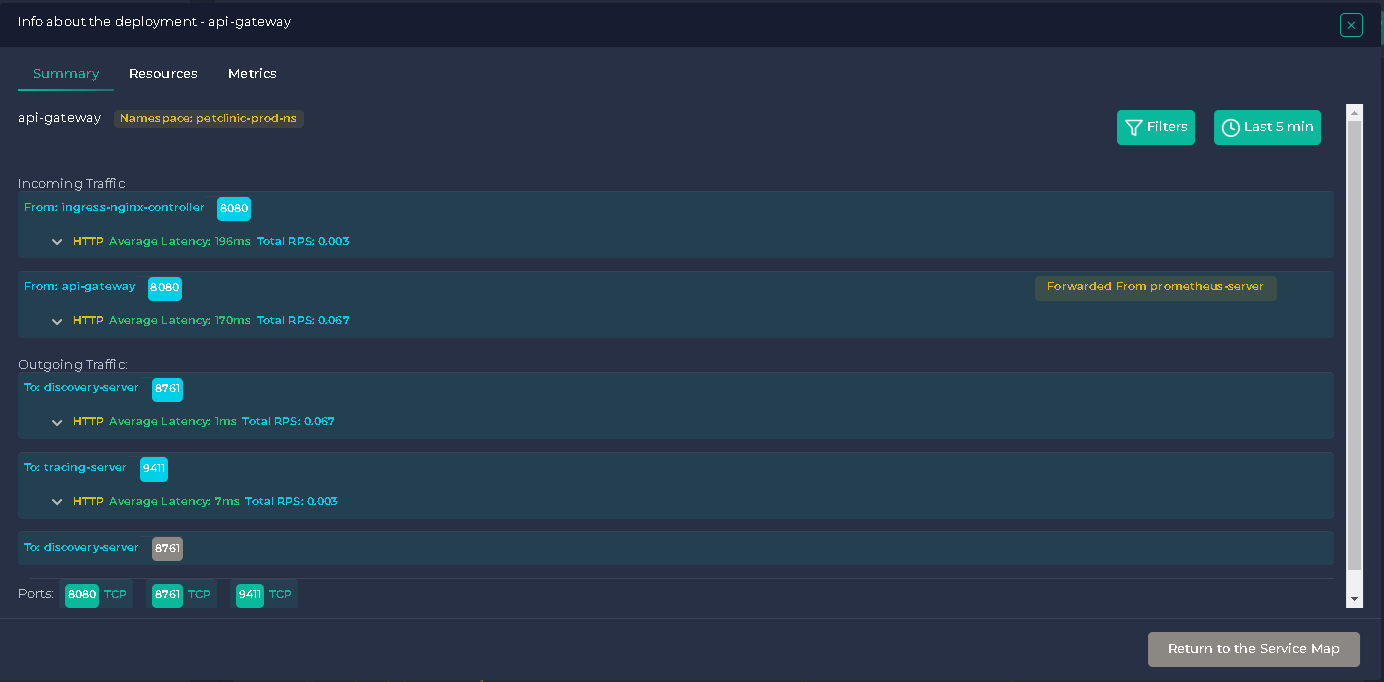
When we double-click on the resources, a window opens where we can get more detailed information about them, as shown in the figure below.
When we double-click on the api-gateway, the window shown below opens;
When we double-click on the alez-daemonset, the window shown below opens;
5.2.3. What Is The Average RPS between Service X and Service Y?
RPS stands for “request per second”, and it is used to define the number of connections that may be accepted from an IP per second(8).
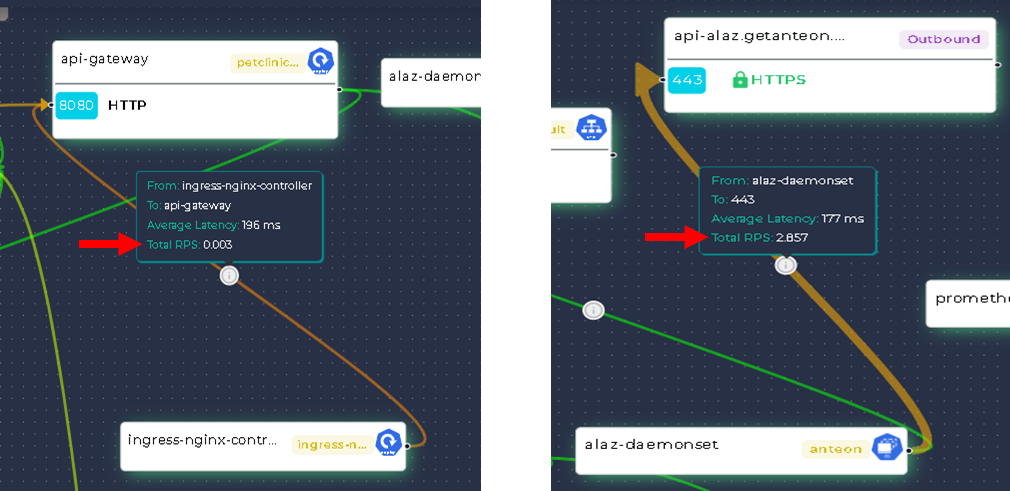
We can learn the average RPS between services by using Anteon’s Service Map. For example, between apigateway and ingress-nginx-controller by clicking ℹ️ over the line.
The average RPS from the ingress-nginx-controller to the apigateway is 0.003, while the average RPS from the alez-daemonset to the api-alez.getanteon is 2.857, as shown in the figure below.
5.2.4. Is There A Zombie Service On Your Cluster?
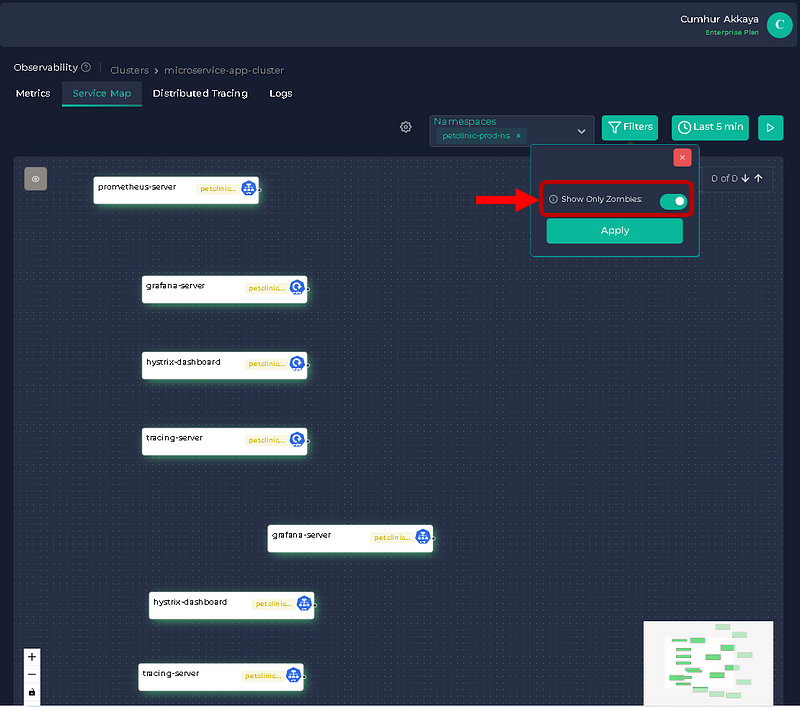
In Kubernetes, a zombie process refers to a container that is no longer responding to signals, including termination signals but is still running and consuming resources. The container is considered a zombie because it is not responding to any commands and is essentially dead, but it continues to consume resources, such as CPU, memory, and network bandwidth(9).
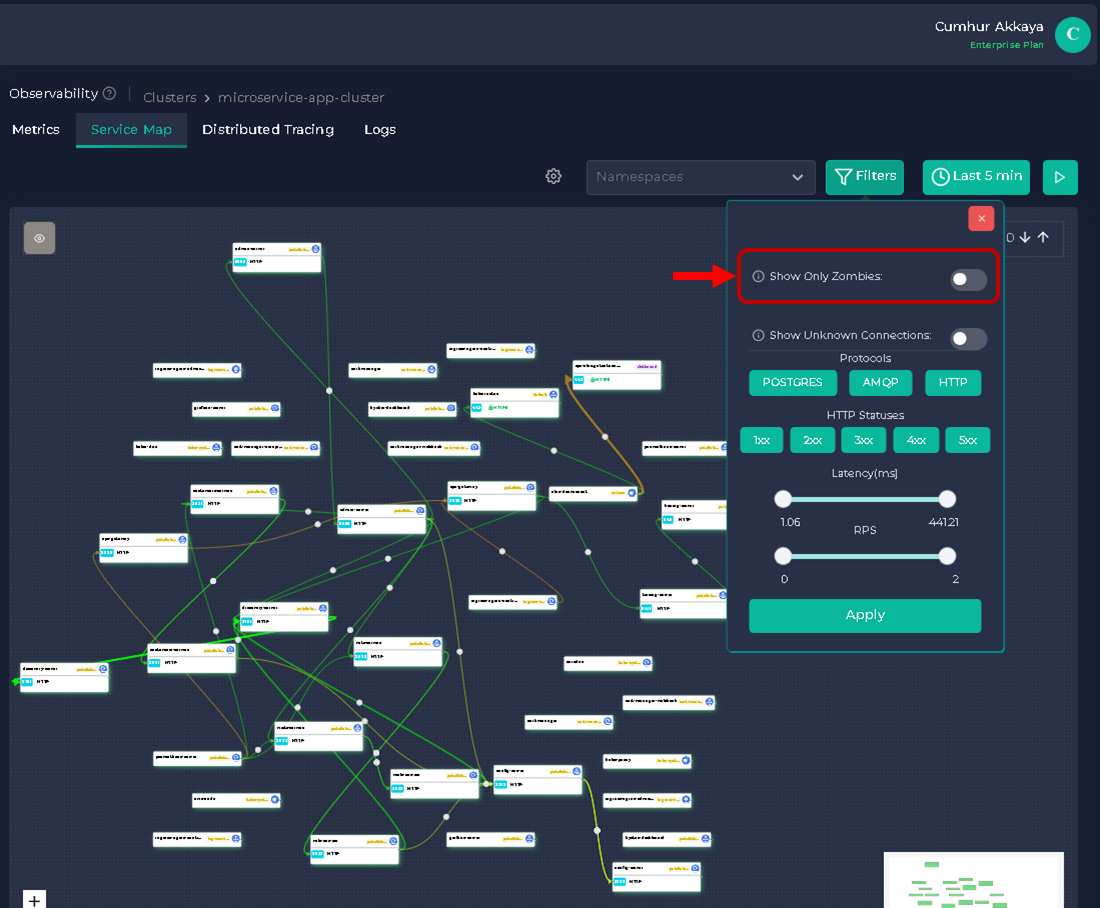
You can click on the Show Only Zombies option to highlight the Kubernetes resources without any traffic, as shown in the figures below.
There are seven Zombie Services on the cluster, as shown in the figure below. The zombie resources of the service map do not have any traffic related to them.
5.2.5. Running Ddosify Engine As A Dummy Load
To make our testing more realistic, we will run a dummy load for our cluster using a load-testing tool. In this way, we will test our microservice application for special days (Valentine’s Day, Black Friday, etc.) when online traffic increases tremendously. We will ensure the performance of our microservices application in the cluster by taking the necessary precautions according to the test results.
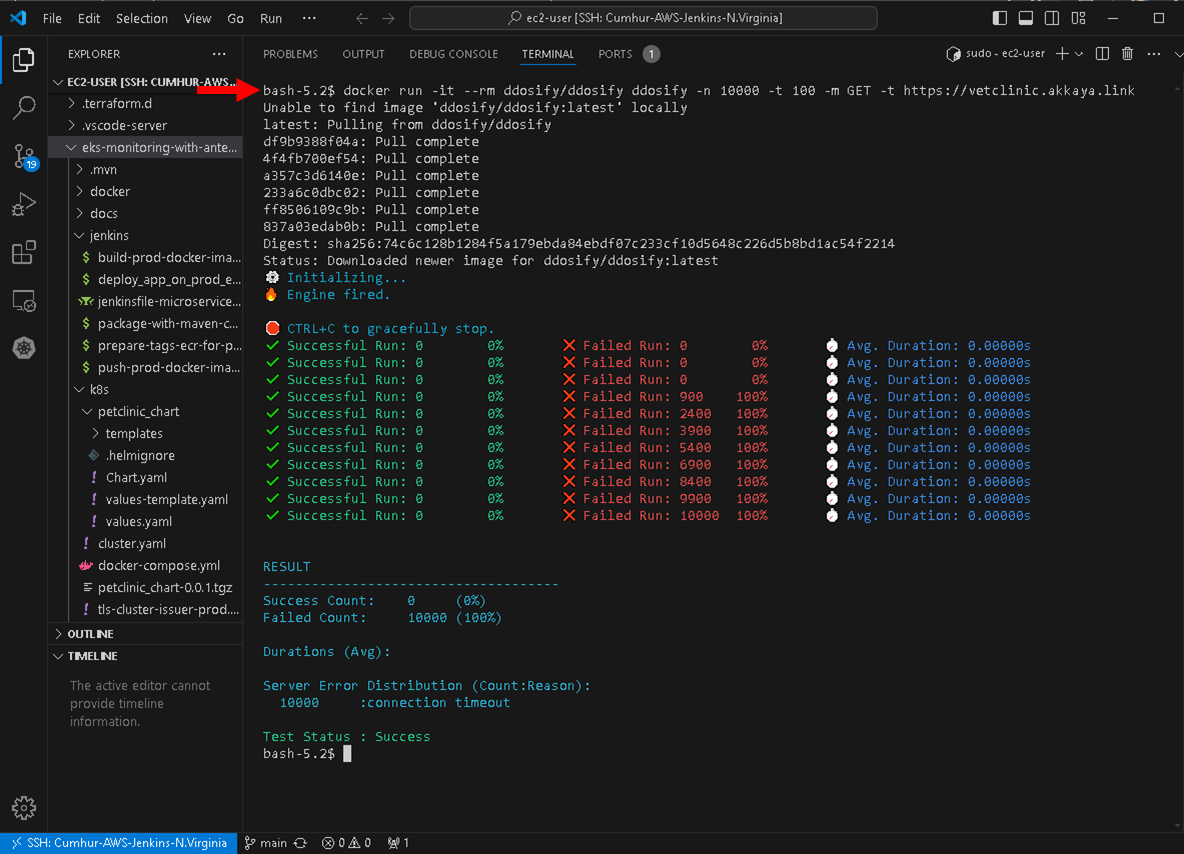
Now, we will create a load for our cluster using Ddosify Engine. Ddosify Engine is a high-performance load-testing tool, written in Golang. We will use the Ddosify Engine docker image to generate a load to our cluster with the following command, as shown in the figure below.
docker run -it --rm ddosify/ddosify ddosify -n 10000 -t 100 -m GET -t https://vetclinic.akkaya.link
This command will generate 10000 requests over 100 seconds to the target endpoint. You can change the number of requests and the test duration by changing the -n and -t parameters. You can also change the HTTP method by changing the -m parameter(10).
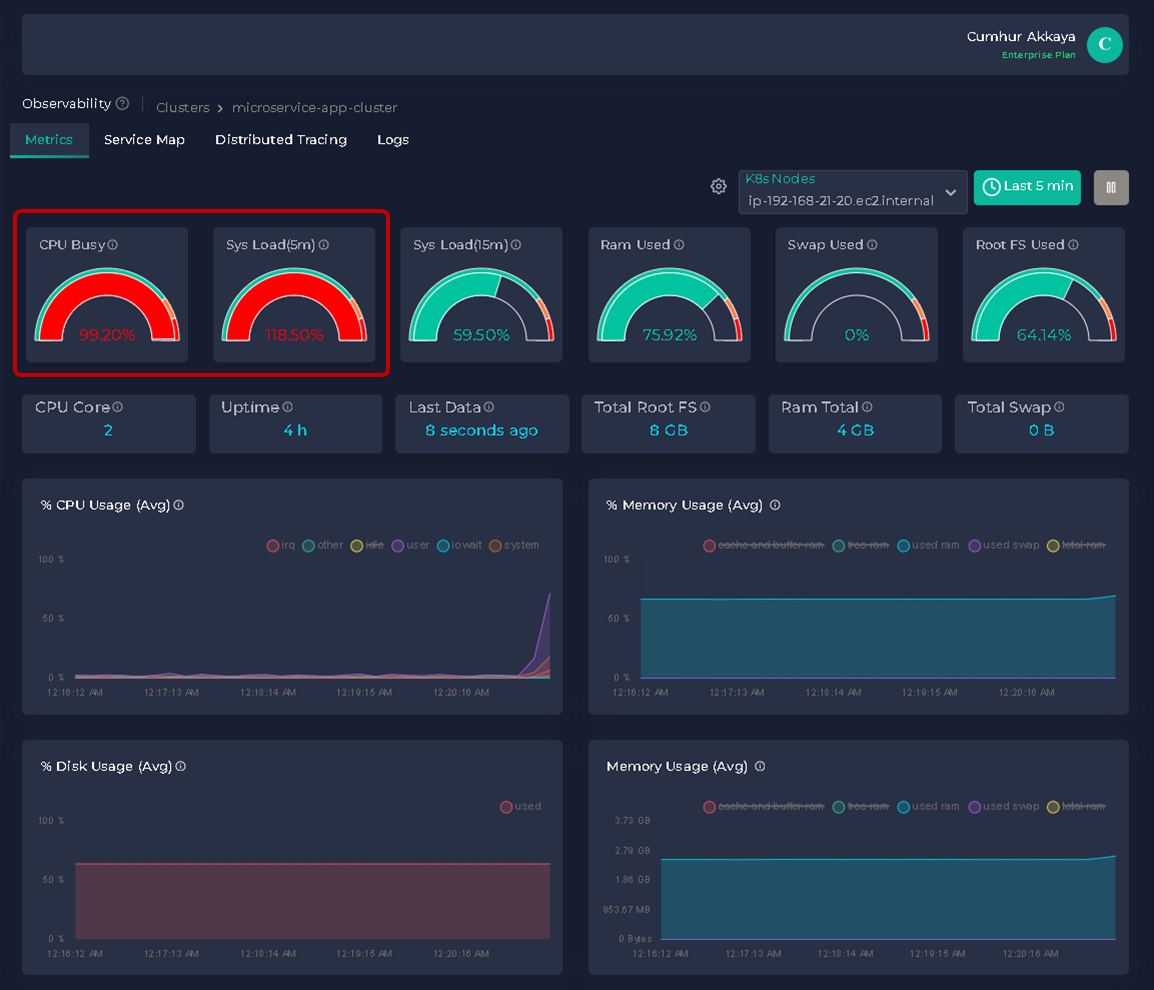
We observe the CPU Busy and Sys Load value of the system from Anteon Metrics. Both values increased excessively after the performance load-testing was run, as shown in the figure below.
Note: We will create a load and test the cluster more professional way using "Anteon Performance Testing" in my future articles.
5.2.6. Microservice Monitoring: Finding Bottlenecks In The Cluster
One common analogy is that traffic from a large road leads into a narrow road. Even if the narrow road is used to its maximum capacity, it can't support more than what it offers. Thus the narrow road becomes the bottleneck. A bottleneck is a point in the system where the performance gets constrained, leading to reduced throughput or increased latency(11).
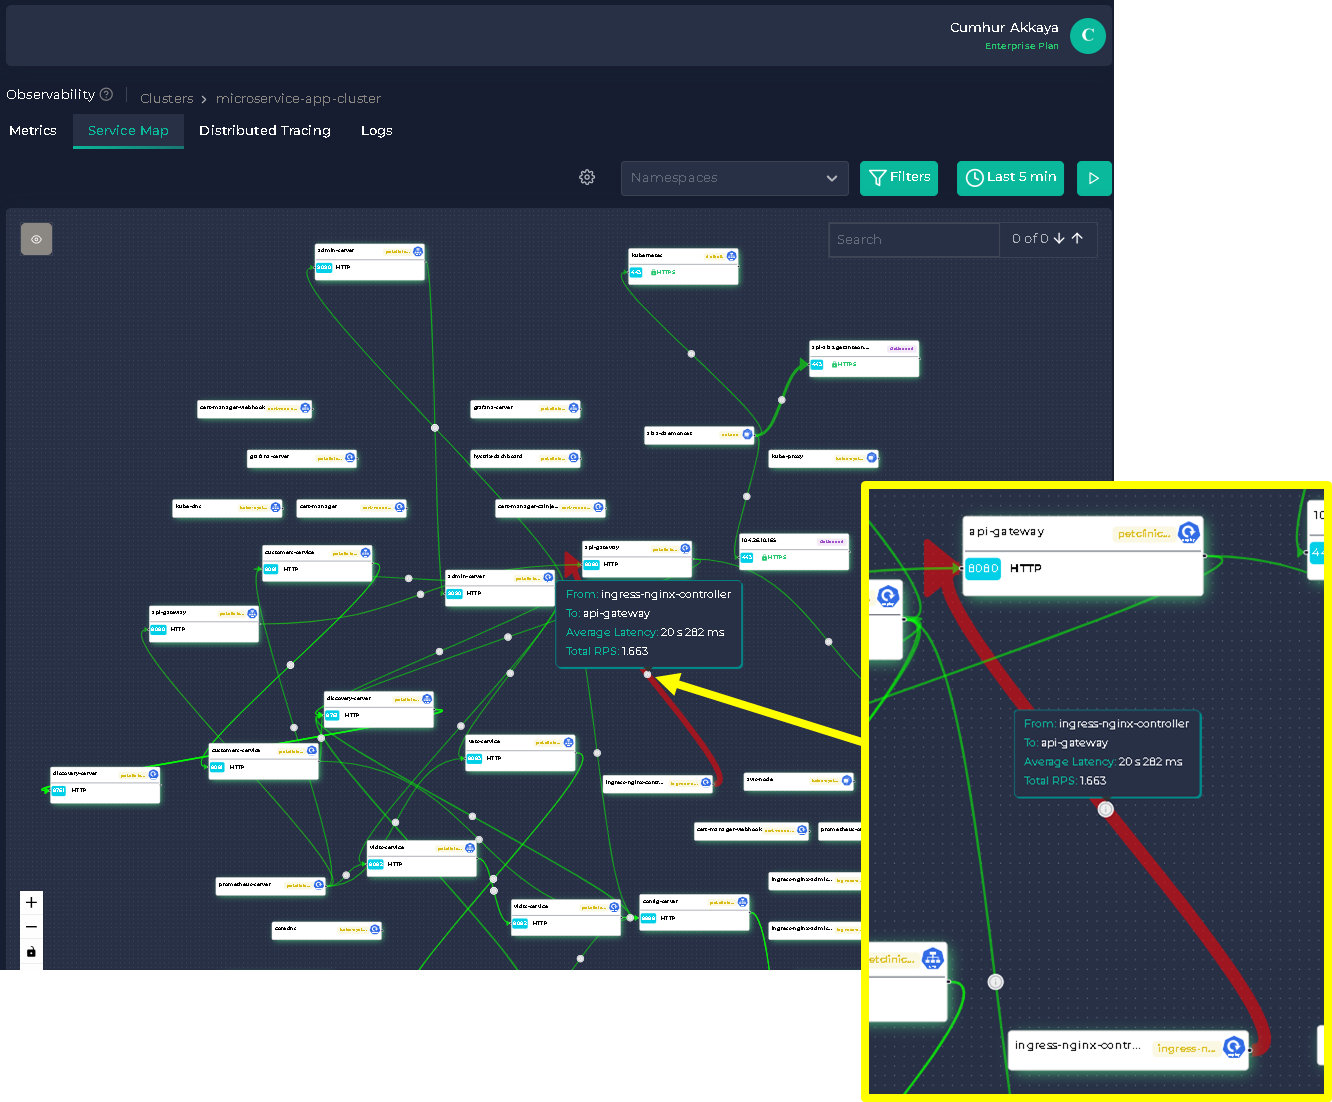
After the performance load-testing was run, the latency was 20.282 sn between apigateway and ingress-nginx-controller in the Anteon Service Map, as shown in the figure below. This is an unacceptable value for the microservices application and a solution must be found for this bottleneck.
Thus the performance test helped us find bottlenecks in the system before the microservices application ran into the production stage. We tested our app and adjusted our strategy and resources according to all the results we found. It is ready to run for special days anymore (Valentine’s Day, Black Friday, etc.) when online traffic increases tremendously. Otherwise, when we do not carry out all these actions, special days can be a complete nightmare for us.
6. Clean-Up
6.1. Canceling Your Subscription
When you’ve decided that you no longer need the instance, you can terminate it. To terminate your instance;
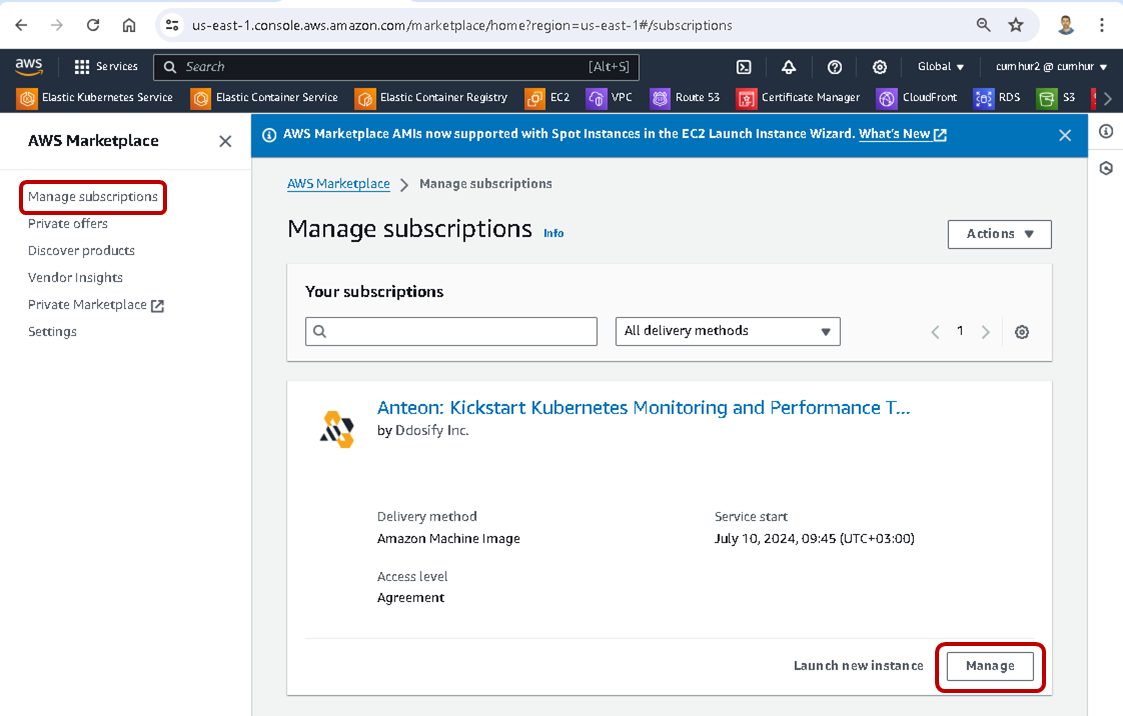
Navigate to the AWS Marketplace console, and choose Manage subscriptions. On the Manage Subscriptions page, choose the software subscription (Anteon), and click on the Manage button, as shown in the picture below.
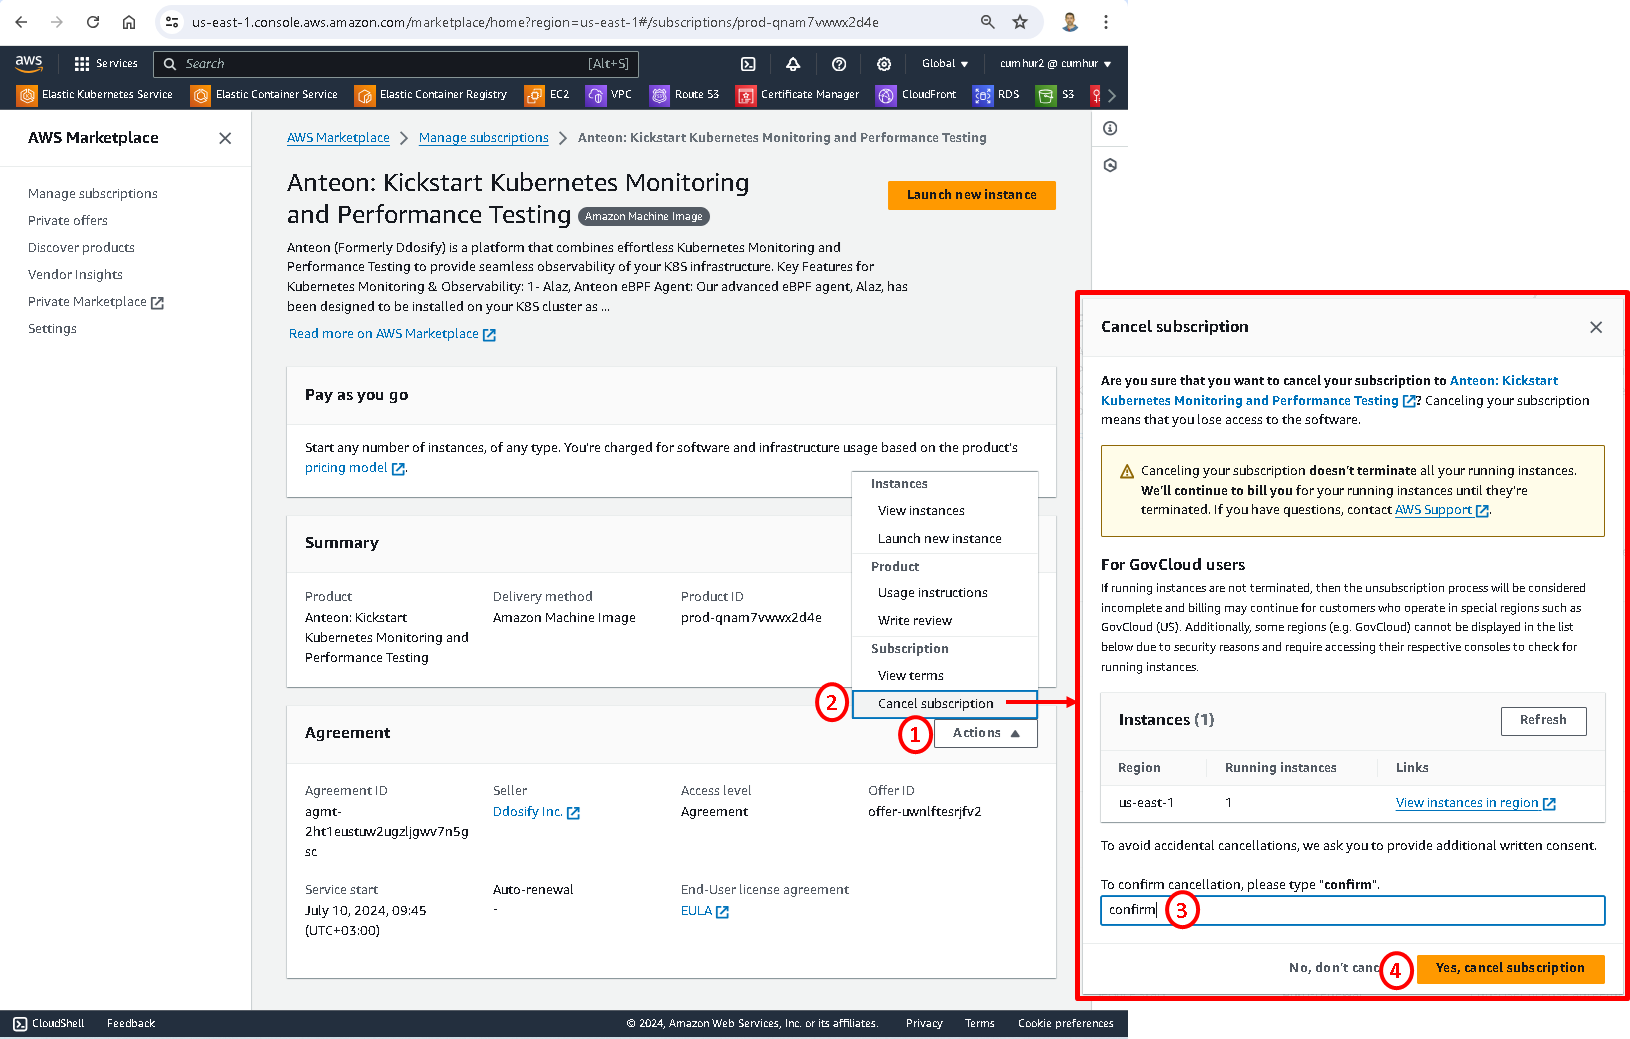
On the “Anteon: Kickstart Kubernetes Monitoring and Performance Testing Manage subscriptions” page, choose Cancel subscription from the Actions dropdown list. Then, to confirm the cancellation, type confirm and click on the Yes, cancel subscription button, as shown in the picture below.
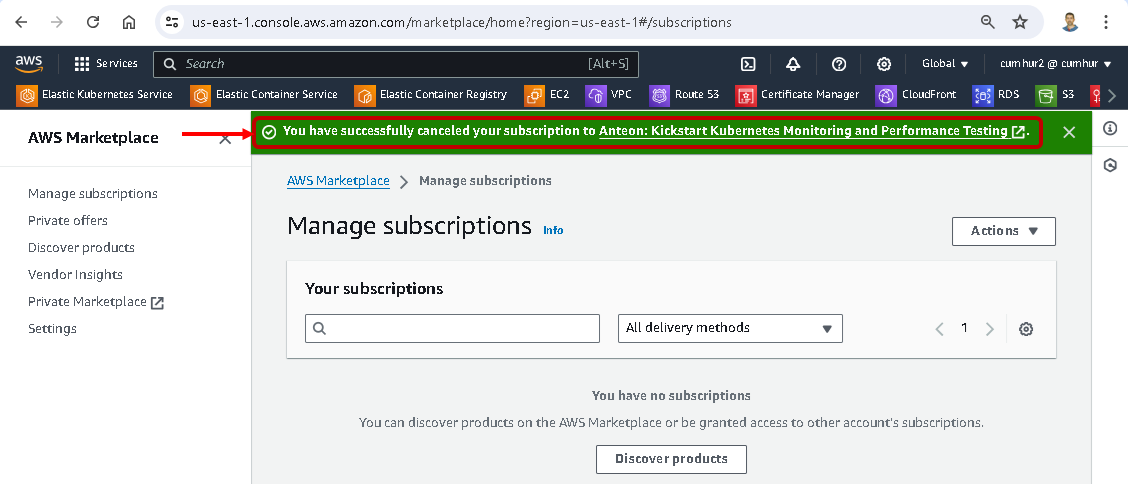
We can check out on Manage subscription’s page that our subscription has been canceled, as shown in the picture below.
6.2. Terminating Your Instance
Canceling your subscription doesn’t terminate all your running instances for Anteon. Amazon continues to bill you for your running instances until you’re terminated. Now, we’ll terminate our running instances for Anteon.
Navigate the “Anteon: Kickstart Kubernetes Monitoring and Performance Testing Manage subscriptions” page, choose View instances from the Actions dropdown list. Then, Select the Region that the instance you want to terminate, as shown in the picture below.
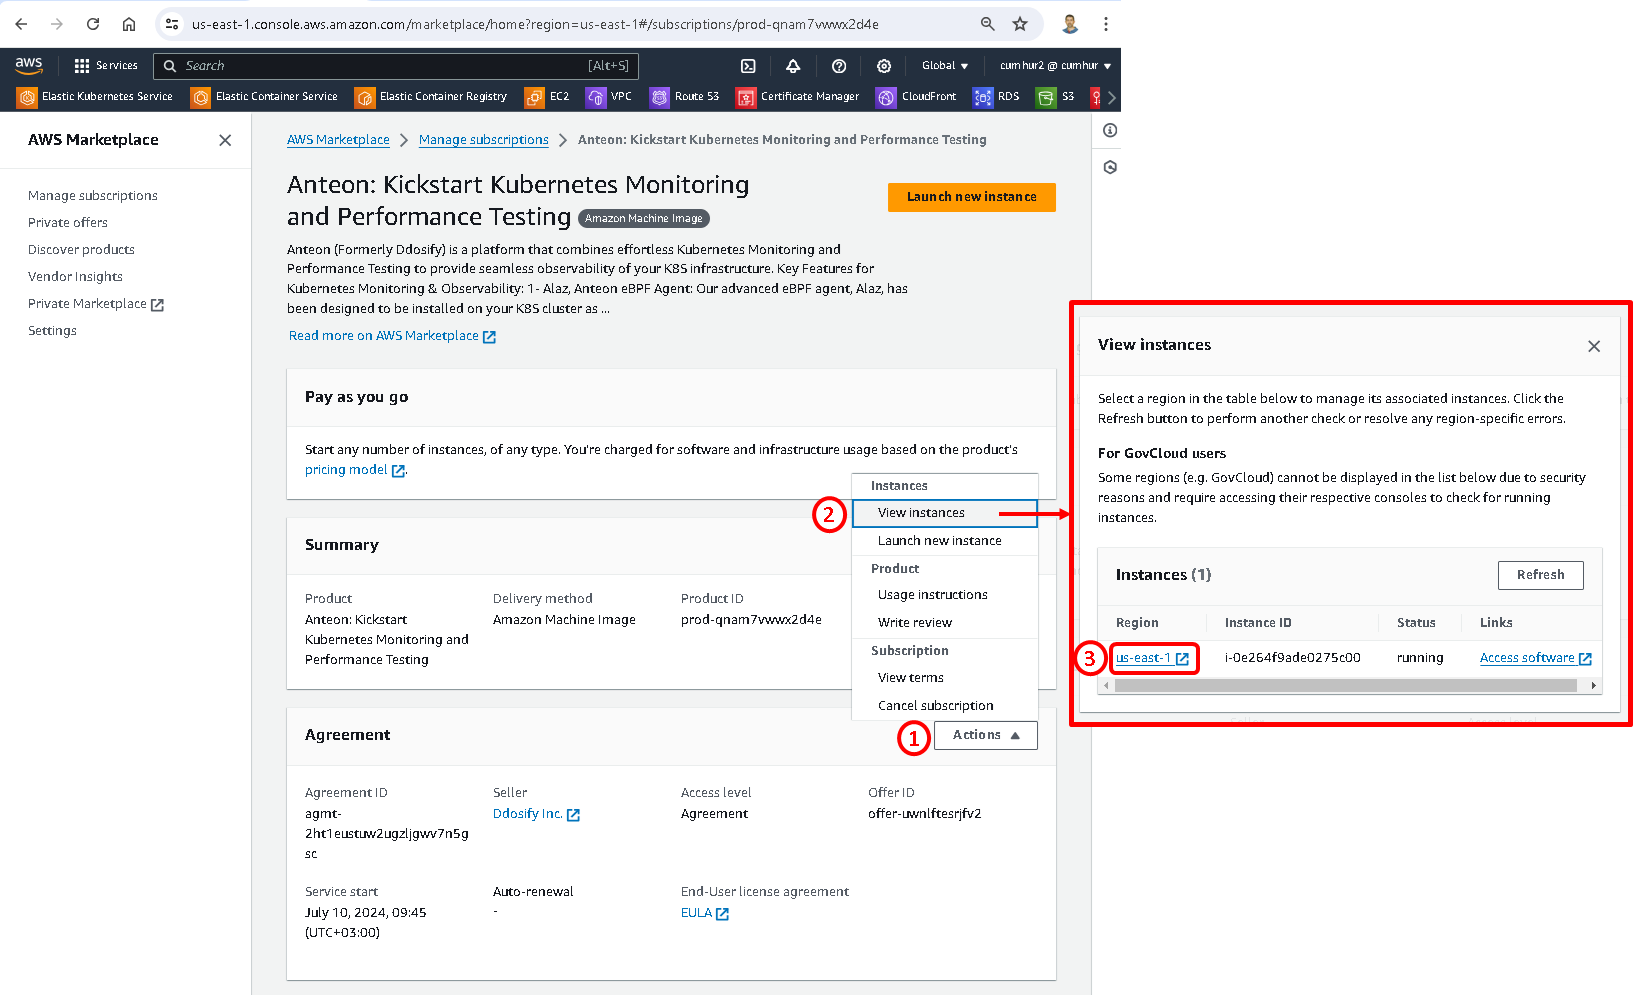
This opens the Amazon EC2 console and shows the instances in that Region in a new tab, as shown in the picture below. If necessary, you can return to the AWS Marketplace tab to see the Instance ID for the instance you want to terminate.

In the Amazon EC2 console, choose the Instance ID. Then, choose Terminate instance from the Instance state dropdown list. Choose Terminate when prompted for confirmation, as shown in the picture below.
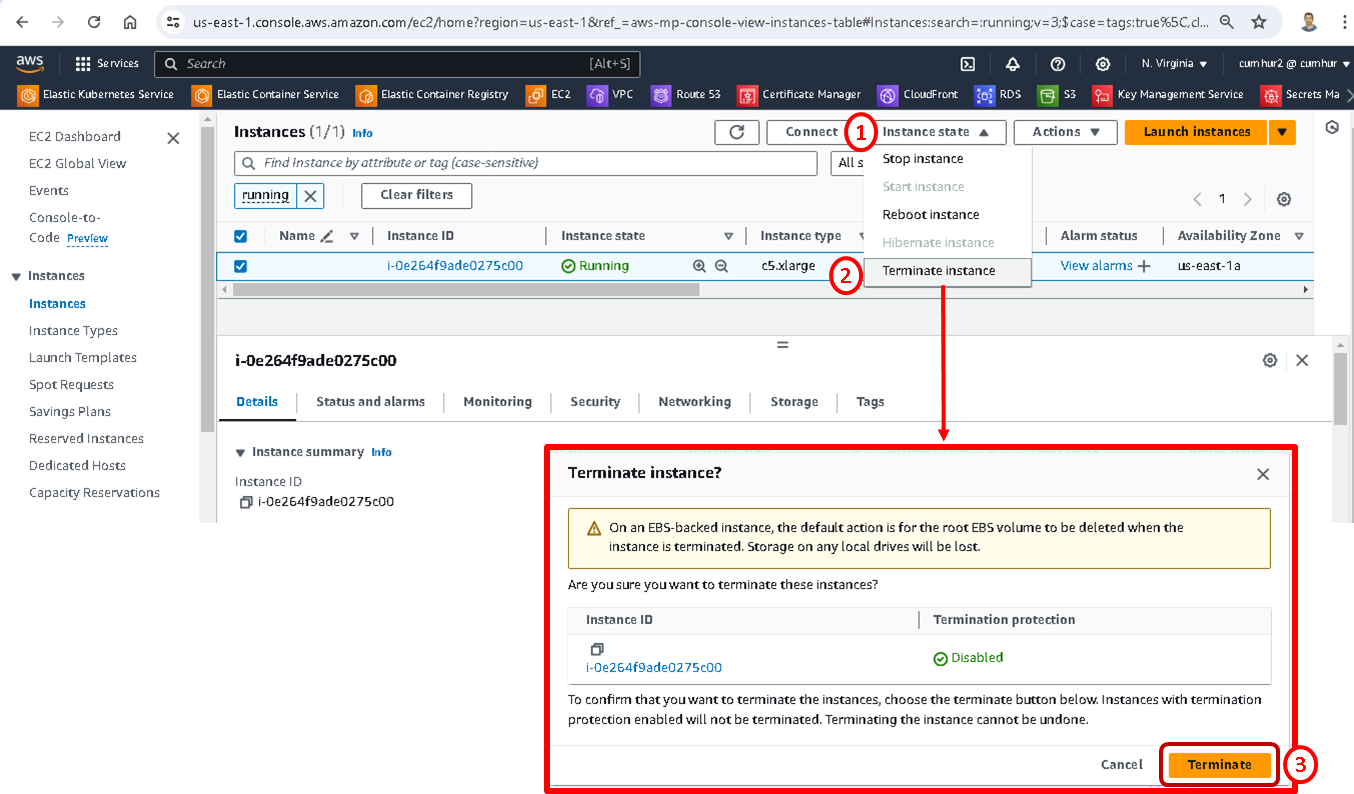
Termination takes a few minutes to complete, as shown in the picture below.

6.3. Terminating Amazon EKS Cluster
If the deployment is not needed anymore, run the following command to delete the Amazon EKS Cluster, as shown in the picture below.
terraform destroy --auto-approve


We can also check that the installation has been completed successfully in the AWS Console, as shown in the figures below.
Terminated nodes;

Terminated Amazon EKS Cluster;

Terminated Amazon custom VPC;

7. Conclusion
In this article, we focused on monitoring the performance of the Amazon EKS Kubernetes cluster by measuring latency and RPS values and detecting problems such as bottlenecks and zombie services in the cluster. Thus, we identified potential problems in the cluster before they became critical and adjusted our strategy and resources accordingly. Also, we tested our microservice application for special days (Valentine’s Day, Black Friday, etc.) when online traffic increased tremendously by using a load-testing tool.
Also, we learned to create an Amazon EKS Kubernetes cluster on a custom Amazon VPC using Terraform. We deployed and ran a microservices application with MySQL Database into this Amazon EKS. We deployed Anteon by using AWS Marketplace and integrated the Kubernetes cluster into Anteon.
Finally, we found answers to the following questions:
What is the average latency between service X and service Y?
Which services have higher/lower latency than XX ms?
What is the average RPS between service X and service Y?
Is there a Zombie Service on your cluster?
How to find a bottleneck in a cluster?
Kubernetes is the most common method for automating the deployment, scaling, and management of containerized applications. We used Amazon EKS as a managed service that eliminates the need to install, operate, and maintain our own Kubernetes control plane on AWS. Thus, Amazon EKS made it easy for us to use and manage Kubernetes.
Continuous monitoring is necessary to guarantee optimal performance and reliability in the Kubernetes cluster. We also used Anteon for this purpose in this article, and we saw the importance of monitoring the cluster to detect problems and bottlenecks before they happen.
8. Next Post
We will continue monitoring the Kubernetes cluster. We‘ll deploy Anteon Self-Hosted on the Kubernetes cluster using the Helm chart. We‘ll also set up Anteon to the Amazon EC2 instances using Docker Compose. We will also examine the Performance Testing and Service Map features in more detail in these deployment options.
We will also test the effect of using Amazon CloudFront on the performance of microservices applications with Anteon Performance Testing. I’m sure you will be very surprised when we examine the results in the Metrics, Test result, and Service Map
Later, we‘ll deploy and run Anteon Self-Hosted both on the Azure Kubernetes Service (AKS), Google Kubernetes Engine (GKE), and on the Azure Virtual Machine (VMs) and GCP Compute Engine (VMs).
Also, we’ll run the CI/CD pipeline for the deployment of a microservices app on the Azure AKS by using Azure DevOps (Azure Pipelines) instead of Jenkins, and monitor it using Anteon. In GCP, we’ll run the CI/CD pipeline by using GitHub Action, GitLab CI/CD, and BitBucket Pipelines, and also monitor them by using Anteon.
We will compare various Kubernetes monitoring tools with each other and see their advantages and disadvantages. For example, Prometheus-Grafana, Datadog, Kubernetes Dashboard, Anteon, Amazon CloudWatch, Azure Monitor, and Google Cloud Monitoring as monitoring tools.
We will do these practically step by step in the next articles.
Happy Clouding…
I hope you enjoyed reading this article. Don’t forget to follow my LinkedIn account to be informed about new articles.
9. References
(1) https://spacelift.io/blog/kubernetes-challenges#5-no-monitoringlogging
(2) https://developer.hashicorp.com/terraform/tutorials/kubernetes/eks
(3) https://docs.aws.amazon.com/marketplace/latest/userguide/what-is-marketplace.html
(4) https://docs.aws.amazon.com/marketplace/latest/userguide/ami-products.html
(5) https://aws.amazon.com/marketplace/pp/prodview-mwvnujtgjedjy?sr=0-1&ref_=beagle&applicationId=AWSMPContessa#pdp-pricing
(6) https://getanteon.com/pricing/
(7) https://develop.anteon-landing-page.pages.dev/docs/kubernetes-monitoring/service-map/
(8) https://loft.sh/blog/kubernetes-nginx-ingress-10-useful-configuration-options/#:~:text=nginx.ingress.kubernetes.io%2Flimit%2Dconnections%20%3A,from%20an%20IP%20per%20second
(9) https://romanglushach.medium.com/the-zombie-apocalypse-in-kubernetes-strategies-for-dealing-with-zombie-pod-processes-in-kubernetes-58f9daeaf6a9#:~:text=In%20Kubernetes%2C%20a%20zombie%20process,still%20running%20and%20consuming%20resources
(10) https://github.com/getanteon/anteon/tree/master/ddosify_engine
(11) https://mosimtec.com/5-insightful-bottleneck-analysis-examples/#:~:text=One%20common%20analogy%20is%20that,narrow%20road%20becomes%20the%20bottleneck
(12) https://docs.aws.amazon.com/cli/v1/userguide/cli-authentication-user.html

